Embed Size (px)
Citation preview

special report:airport group financials2013
november 2013

flightglobal.com/ab | Airline Business | 35
SPECIAL REPORT AIRPORTS
Gat
wic
k Ai
rpor
t
The privatisation of airports generates some good investment opportunities, but there is little evidence so far that it delivers improved performance for its customers. And are budget terminals, that were once all the rage, now going out of fashion?
CONTENTS
All our special reports are available online at : flightglobal.com/airlines
36 Streamling hubs There have been mixed fortunes for airports amid US airline consolidation
38 Airport group financials Our annual revenue and profit ranking for the 100 leading airports in 2012
November 2013
40 Private lives The shift from the public sector may not be all it is cracked up to be
44 Cheap and cheerful The budget terminal craze has extended beyond its Asian origins, but will this low-cost concept remain in vogue?

flightglobal.com/ab36 | Airline Business |
There have been dramatic changes in US hubs over the past decade, with consolidation and mergers between carriers bringing good fortune to some airports while others have seen boarding figures collapse. But what allows some to expand while others fail?
AIRPORTS US HUBS
November 2013
STREAMLINING HUBS
Think again if you thought you might see the inside of Pittsburgh International’s airmall or Lambert-St. Louis International’s Minoru Yamasaki terminal while transiting
between flights in the USA.Both lost hubs during the past decade, the
result of consolidation and streamlining at US carriers that has left once-major airports mere shadows of what they were in their prime, while others have continued to boom.
Cleveland, Memphis, Pittsburgh, San Jose and St. Louis saw the largest percentage de-creases in boardings out of the busiest 50 air-ports in the USA from 2000 to 2012, US Fed-eral Aviation Administration data shows. Cincinnati, a former Delta Air Lines hub, also saw a double-digit percentage decrease that pushed it out of the top 50 by 2012.
REPORTEDWARD RUSSELLWASHINGTON DC
“The airports were victims of airline hub strategies and consolidation,” says Deborah McElroy, interim president of the Airports Council International North America.
United Airlines has cut capacity in Cleve-land since its merger with Continental Air-lines in 2010 while American Airlines, Delta and US Airways have eliminated hubs in St. Louis, Memphis and Pittsburgh, respectively, after their own mergers in the past decade.
Charlotte, Denver, Fort Lauderdale, Fort Myers and New York JFK airports have expe-rienced the opposite – significant traffic growth since 2000. Low-cost carriers as well as consolidation and streamlining helped boost these airports.
William Swelbar, a research engineer at the Massachusetts Institute of Technology’s (MIT)
International Centre for Air Transportation, calls the growth at Denver, Fort Lauderdale, Fort Myers and JFK “low-cost carrier stories” and adds that streamlining is a factor behind many of the decreases and increases at the top airports in each list.
STRATEGISING HUBSDelta could be considered the leader in changing its hub strategy. Its former hubs in Cincinnati and Memphis have shrunk dra-matically since its merger with Northwest, and prior to that, it pulled down its Dallas-Fort Worth hub in 2005 as a result of post-9/11 capacity cuts.
Both Cincinnati and Memphis overlapped with other hubs and were also affected by the carrier’s shift away from small regional jets. Location was also an issue since Cincinnati is

flightglobal.com/ab | Airline Business | 37
She says that St Louis had service on 14 carriers in 2011, up from seven at the begin-ning of the decade. Traffic was also diversified with Southwest Airlines carrying nearly half of all passengers with the rest split between other carriers, compared to about 70% on TWA prior to the merger.
US Airways’ pull-down in Pittsburgh fol-lowed a showdown between airline and air-port management, the latter of which did not agree to reduce costs for the airline resulting in the demotion of the city to just a spoke from a hub in its network.
Boardings at Pittsburgh were down more than 60% to 3.9 million in 2012, according to the FAA. US Airways remains the airport’s largest carrier but Delta and Southwest have both taken advantage of its downsizing to ex-pand at the western Pennsylvania facility.
STREAMLINING“If you look at the major metro areas, you’re seeing a consolidation around one major airport instead of two, or two instead of more,” says Swelbar. “It’s a way for airlines to serve metro areas without having redundant service.”
This is true in the Los Angeles area with Burbank and Ontario, the New York area with airlines focusing on operations into the airports where they are strongest – no one has dropped service to any of the city’s main three airports – and in the San Francisco bay area at Oakland and more notably San Jose.
San Jose Mineta International saw board-ings drop by more than a third to 4.1 million by 2012, FAA data shows. This drop is par-tially a result of the tech bubble that buoyed traffic in the late 1990s as well as the reduc-tions in redundant service that Swelbar men-tions, says the airport.
The airport has seen a great deal of change in the past decade. American dropped its focus city early on while Virgin America’s launch from San Francisco International in 2007 prompted JetBlue Airways and South-west’s decisions to enter the Bay Area’s pri-mary airport the same year. Both carriers were focused on service to Oakland and San Jose prior to that.
San Francisco saw boardings rise by more than 1.7 million while San Jose’s fell by a little more than 2 million from 2000 to 2012. Boardings at Oakland were down by about 300,000 over the period.
JetBlue, Southwest – and its present sub-
November 2013
Denver has seen significant traffic
growth since 2000
Den
ver a
irpor
t
sidiary AirTran Airways – and Spirit Air-lines have driven double digit growth at air-ports around the country, though none as much as Denver, Fort Lauderdale, Fort Myers and JFK.
Boardings at Denver were up more than 40% to 25.8 million, Fort Lauderdale more than 46% to 11.4 million, Fort Myers 41% to 3.6 million and JFK nearly 52% to 24.5 mil-lion, FAA data shows.
Reasons for this growth vary, from the strong local economy and growing population in Denver to becoming the de facto domestic O&D airport for the South Florida area at Fort Laud-erdale, but a common theme is low costs.
“Low-cost carriers stimulating the market and the ability of Broward County to keep the cost to the airlines in sustainable parameters are a significant part of the growth,” says Kent George, director of aviation for Broward County, which operates Fort Lauderdale-Hol-lywood airport. Its cost per passenger boarded is currently $4.05, he adds.
JetBlue, Southwest and Spirit all operate focus cities services at the airport that grew significantly during the past decade.
Low-cost carriers are not the only airlines concerned about cost. Charlotte-Douglas In-ternational airport, home to US Airways’ larg-est hub, claims to have the lowest net cost per passenger boarded among large hub airports at $0.96 in 2012. Since 2000, boardings have increased nearly three-quarters to more than 20 million per year.
“We’ve stayed strongly committed to low cost and we have remained a competitive hub because of our focus on our amenities and low cost,” says Brent Cagle, interim aviation director of the Charlotte airport.
Asked if any of Charlotte’s growth could be at all attributed to US Airways’ pull back in Pittsburgh during the same period, he says: “No, I don’t think we got lucky and happened to benefit because of Pittsburgh’s misfortune. You make your own luck.”
Indeed, Charlotte’s growth by more than 8.5 million boardings is significantly more than Pittsburgh’s loss of nearly six million boardings from 2000 to 2012, FAA data shows.
Many other airports across the USA saw similar trends. Budget airlines buoyed traffic at airports including Chicago Midway and Las Vegas, while consolidation – and capacity discipline across the US mainline carriers – saw decreases at airports like Chicago O’Hare and Detroit.
By and large, more of the USA’s busiest air-ports grew than shrank during the decade – a signal that demand for air travel continues to grow slowly albeit with a slightly different geographical representation than before.
“I think the days of wholesale capacity cut-ting are behind us,” says Swelbar. “What we see is the new normal.” ■
just 370km (230 miles) south of Delta’s Detroit hub, while Memphis is situated 530km from Delta’s main hub in Atlanta. This proximity left the carrier with the question of where best to flow connecting traffic, with the cities with larger origin and destination markets and in-ternational traffic winning out.
Glen Hauenstein, executive vice-president chief revenue officer of the Atlanta-based car-rier, cites an example when describing the air-line’s strategy to shift its regional fleet towards larger gauge aircraft in December 2012.
“We believe that by eliminating the 50-seat regional depth service between Birmingham and Memphis and upgauging the Birming-ham to Atlanta [service] to be on medium-sized RJs or smaller narrowbodies, like the 717s, we will be able to produce the product that’s not only more appealing to our custom-er base but it’s much more cost-efficient for us to produce,” he says.
Delta plans to remove at least 40 50-seat re-gional jets and add 16 88-seat Boeing 717s leased from Southwest Airlines and 12 Bom-bardier CRJ900s to the fleet of its wholly-owned subsidiary Endeavor Air, as part of this programme by the end of this year.
American and US Airways are far from innocent. The former has gradually eliminat-ed the St. Louis hub that it acquired through its merger with Trans World Airlines in 2001. The airport saw boardings fall by nearly 60% to 6.2 million by 2012, FAA data shows.
“There was a bit of a silver lining of being one of the first – Lambert had to react right away,” says Rhonda Hamm-Niebruegge, di-rector of the St Louis airport. American’s first cuts began in 2003, before other carriers made similar moves in other cities, prompting the airport to diversify its airline base.
Delta plans to remove at least 40 50-seat regional jets and add 16 88-seat 717s and 12 CRJ900s

flightglobal.com/ab38 | Airline Business |
AIRPORTS RANKINGS
AIRPORT GROUP FINANCIALSDATA COMPILED BY JAMES MELLON OF FLIGHTGLOBAL DATA RESEARCH ANALYSIS BY FLIGHTGLOBAL INSIGHT
TOP 100 AIRPORT GROUPS BY REVENUE: 2012
Ranking Airports operator Country Main Revenue Op result ($m) Op margin (%) Net result ($m) Period 2012 (2011) airport(s) $ million Change (%) 2012 2012 2011 2012 2011 to end
1 (1) AENA Spain MAD 4,267 -5.6 -89.3 -2.1 -0.8 -89.0 -35.4 Dec 122 (2) Heathrow Airport Holdings UK LHR 3,923 6.9 988.7 25.2 26.9 184.7 -70.8 Dec 123 (3) Aeroports de Paris France CDG 3,406 -2.6 828.4 24.3 26.0 440.2 485.1 Dec 124 (4) Fraport Germany FRA 3,150 -4.9 642.5 20.4 20.9 324.6 350.6 Dec 125 (6) Port Authority of NY & NJ USA JFK 2,276 2.5 865.9 38.0 37.6 513.7 446.5 Dec 126 (7) Narita International Airport Japan NRT 2,272 3.3 417.2 18.4 12.3 184.0 45.1 Mar 137 (5) Infraero Brazil GRU 2,228 -1.0 303.3 13.6 10.0 55.0 88.4 Dec 128 (8) Schiphol Group Netherlands AMS 1,745 -2.4 382.5 21.9 23.8 253.4 276.1 Dec 129 (11) Hong Kong International Hong Kong HKG 1,693 8.2 858.2 50.7 49.5 726.2 687.0 Mar 1310 (9) Japan Airport Terminal Japan HND 1,635 -0.4 50.2 3.1 0.7 19.5 -33.1 Mar 13
11 (12) Avinor Norway OSL 1,582 2.1 287.3 18.2 17.2 160.2 151.6 Dec 12
12 (13) Changi Airport Group Singapore SIN 1,540 8.1 614.1 39.9 605.3 442.8 Mar 1313 (10) Flughafen München Germany MUC 1,531 -3.5 359.1 23.5 22.3 123.0 103.9 Dec 1214 (15) TAV Airports Holding Turkey IST 1,418 15.2 336.7 23.7 21.8 160.0 74.1 Dec 1215 (14) Incheon International South Korea ICN 1,417 4.7 697.3 49.2 39.4 445.9 326.4 Dec 1216 (18) Airports Authority of India Est India CCU 1,200 6.3 – – – – – Mar 1217 (26) Malaysia Airports Holdings Malaysia KUL 1,154 27.9 230.4 20.0 23.7 128.2 131.3 Dec 1218 (17) Greater Toronto Airports Authority Canada YYZ 1,139 -1.1 428.6 37.6 38.8 14.3 -17.4 Dec 1219 (25) GMR Infrastructure India DEL 1,123 22.5 – – – -7.4 -212.7 Mar 1320 (16) State Airports Authority Turkey IST 1,095 -5.1 375.0 34.2 45.5 421.1 481.0 Dec 1221 (22) Beijing Capital International China PEK 1,089 8.0 248.2 22.8 22.9 186.1 172.7 Dec 1222 (21) Southern Cross Airports Holdings Australia SYD 1,079 6.3 643.4 59.6 57.4 83.3 -126.7 Dec 1223 (20) Flughafen Zürich Switzerland ZRH 1,017 -1.1 418.7 41.2 53.5 101.5 192.9 Dec 1224 (23) Airports of Thailand Thailand BKK 980 3.7 346.7 35.4 24.3 209.3 71.6 Sep 1225 (19) New Kansai International Airport Japan KIX 947 -15.4 251.4 26.5 20.1 31.9 104.5 Mar 1326 (24) SEA Aeroporti di Milano Italy MXP 930 0.6 129.9 14.0 12.3 82.6 73.3 Dec 1227 (28) Los Angeles World Airports USA LAX 902 6.0 92.8 10.3 12.2 217.1 218.7 Jun 1228 (29) City of Chicago Department of Aviation USA ORD 860 2.7 2.4 0.3 7.9 -37.3 -64.5 Dec 1229 (33) Miami Dade County Aviation Department USA MIA 830 8.9 -55.9 -6.7 -16.5 -55.9 -125.6 Sep 1230 (30) Flughafen Wien Austria VIE 784 -3.7 139.3 17.8 11.5 92.8 44.2 Dec 1231 (32) Airports Company South Africa South Africa JNB 779 0.5 360.4 46.3 36.6 115.9 25.3 Mar 1332 (35) Shanghai Airport Authority China PVG 749 4.8 232.7 31.1 41.2 250.9 232.5 Dec 1233 (37) Guangzhou Baiyun International China CAN 742 12.9 169.4 22.8 23.1 119.5 108.1 Dec 1234 (31) Dublin Airport Authority Ireland DUB 741 -5.0 77.1 10.4 10.3 25.1 42.2 Dec 1235 (27) Aeroporti di Roma Italy FCO 740 -16.2 181.7 24.6 24.3 334.4 55.5 Dec 1236 (34) Swedavia Sweden ARN 738 1.1 123.6 16.7 16.6 66.5 68.1 Dec 1237 (36) Metro Washington Airports Authority USA IAD 695 4.7 17.8 2.6 12.8 -171.3 -207.4 Dec 1238 (39) San Francisco International USA SFD 669 10.2 125.6 18.8 18.5 19.1 9.0 Jun 1239 (42) Manchester Airports Group UK MAN 650 8.5 68.7 10.6 6.2 34.4 -14.8 Mar 1340 (41) Denver Department of Aviation USA DEN 625 3.6 57.9 9.3 5.1 14.3 -44.7 Dec 1241 (46) Korea Airports South Korea CJU 612 14.4 154.4 25.2 22.3 130.0 97.0 Dec 1242 (44) Australia Pacific Airports Australia MEL 611 9.3 452.5 74.1 75.3 176.1 202.8 Jun 1243 (38) Copenhagen Airports Denmark CPH 609 -3.0 365.5 60.0 37.8 279.8 141.8 Dec 1244 (40) Aeroportos de Portugal Portugal LIS 587 -2.8 105.1 17.9 27.8 68.4 107.0 Dec 1245 (43) Flughafen Düsseldorf Germany DUS 549 -6.2 70.2 12.8 15.1 52.0 59.4 Dec 1246 (44) Brussels Airport Company Belgium BRU 540 -3.4 212.9 39.4 38.6 87.3 100.6 Dec 1246 (48) Dallas/Fort Worth International USA DFW 540 4.9 -109.5 -20.3 -18.8 -171.4 -168.3 Sep 1248 (47) Central Japan International Airport Japan NGO 514 -3.2 – – 8.8 17.2 7.6 Mar 1349 (49) Aeropuertos Argentina 2000 Argentina EZE 511 8.7 – – – 0.5 -0.6 Dec 1250 (52) Brisbane Airport Australia BNE 506 11.0 368.7 72.9 71.6 -56.0 154.0 Jun 12
Our Airline Business top 100 airport group rankings, based on revenues, provides a financial snapshot for the leading global operators. It shows total revenues across the leading players grew only 2% last year
November 2013

flightglobal.com/ab | Airline Business | 39
TOP 100 AIRPORT GROUPS BY REVENUE: 2012
Ranking Airports operator Country Main Revenue Op result ($m) Op margin (%) Net result ($m) Period 2012 (2011) airport(s) $ million Change (%) 2012 2012 2011 2012 2011 to end
51 (50) Massport USA BOS 488 4.7 223.1 45.7 42.7 – – Jun 1252 (55) Taoyuan International Airport Corp Taiwan TPE 458 7.8 – – – – – Dec 1253 (54) Aeroports de Montreal Canada YUL 436 0.7 5.7 1.3 1.3 – – Dec 1254 (60) PT (Persero) Angkasa Pura II Indonesia GCK 426 7.0 156.4 36.7 37.5 129.9 124.0 Dec 1255 (53) Finavia Finland HEL 418 -7.3 24.7 5.9 7.0 3.9 -14.2 Dec 1255 (57) Houston Airport System USA IAH 418 2.0 -37.2 -8.9 -9.0 -51.0 -50.6 Jun 1257 (58) Abertis Airports Spain LTN 412 0.7 120.0 29.1 29.3 Dec 1258 (65) Vancouver Airport Authority Canada YVR 404 7.7 123.4 30.5 25.4 85.0 60.3 Dec 1259 (56) City of Atlanta Department of Aviation USA ATL 394 -4.1 9.5 2.4 13.5 106.1 179.6 Jun 1260 (68) Shenzhen Airport China SZX 393 8.6 121.7 31.0 36.4 93.1 103.5 Dec 1261 (67) ASUR Aeropuertos Del Sureste Mexico CUN 390 6.3 192.6 49.4 45.7 158.0 127.6 Dec 1261 (64) Geneva International Switzerland GVA 390 -0.5 77.4 19.8 20.4 71.3 73.4 Dec 1263 (71) Port of Seattle USA SEA 386 10.0 46.9 12.2 12.0 31.1 43.3 Dec 1264 (51) Athens International Greece ATH 381 -18.1 225.6 59.2 60.9 125.9 181.1 Dec 1265 (61) Grupo Aeroportuario del Pacífico Mexico GDL 377 -4.8 139.8 37.1 33.3 134.9 129.3 Dec 1266 (78) PT (Persero) Angkasa Pura I Indonesia DPS 373 23.1 93.5 25.1 24.7 70.7 61.9 Dec 1267 (69) Greater Orlando Aviation Authority USA MCO 367 2.5 39.2 10.7 10.6 61.6 58.0 Sep 1268 (79) Perth Airport Australia PER 357 19.0 450.2 126.1 26.8 321.4 55.5 Jun 1269 (63) Clark County Department of Aviation USA LAS 355 -9.7 -4.0 -1.1 9.9 -169.6 13.5 Jun 1270 (62) Flughafen Koln-Bonn Germany CGN 350 -11.2 12.3 3.5 7.5 5.2 14.0 Dec 1270 (72) Office National des Aéroports Est Morocco CMN 350 0.9 – – – – – Dec 1272 (66) Flughafen Berlin Brandenburg Germany SXF 348 -5.4 -233.2 -67.0 -28.3 -238.9 -104.2 Dec 1273 (77) Auckland International Airport New Zealand AKL 345 13.5 – – – 115.1 77.0 Jun 1274 (74) Czech Airports Authority Est Czech Republic PRG 325 4.2 – – – – – Dec 1275 (70) Flughafen Hamburg Germany HAM 324 -8.5 – – – 50.3 68.8 Dec 1276 (76) Wayne County Airport Authority USA DTW 319 2.6 -33.4 -10.5 -16.3 -58.1 -77.3 Sep 1277 (74) State of Hawaii DOT - Airports Division USA HNL 312 0.0 -6.3 -2.0 0.6 -4.4 59.2 Jun 1278 (80) Calgary Airport Authority Canada YYC 308 4.8 62.1 20.2 22.0 30.5 -242.9 Dec 1279 (59) Airport Holding Tanácsadó Hungary BUD 305 -25.2 101.9 33.4 28.5 -45.7 -70.5 Dec 1280 (81) City of Phoenix Aviation Dept USA PHX 300 3.8 -60.0 -20.0 -27.9 -133.1 -140.8 Jun 1281 (73) Flughafen Stuttgart Germany STR 297 -6.3 48.6 16.4 16.4 39.0 42.7 Dec 1282 (82) Maryland Aviation Administration USA BWI 289 0.7 122.3 42.3 40.8 – – Jun 1283 (84) Metropolitan Airports Commission USA MSP 266 3.5 9.6 3.6 0.5 14.7 6.8 Dec 1284 (83) Aeroports de la Cote d’Azur France NCE 264 -0.4 106.8 40.5 39.7 16.6 12.7 Dec 1285 (86) Northern Capital Gateway Russia LED 237 11.8 35.2 14.9 – – – Dec 1286 (88) Operadora Mexicana de Aeropuertos Mexico MTY 215 9.1 88.3 41.1 37.4 62.4 49.4 Dec 1287 (85) Polish Airports State Enterprise Poland WAW 207 -7.6 22.5 10.9 15.5 18.0 21.0 Dec 1288 (87) Aeroports de Lyon France LYS 197 -3.9 24.1 12.2 13.1 11.7 16.1 Dec 1289 (90) Broward County Aviation Department USA FLL 182 1.7 6.5 3.6 6.4 21.4 25.0 Sep 1290 (92) Port of Portland USA PDX 181 4.6 13.6 7.5 11.3 9.0 12.9 Jun 1291 (95) Xiamen International Airport Group China XMN 178 15.6 84.3 47.4 46.0 60.0 50.6 Dec 1291 (89) Hannover-Langenhagen Germany HAJ 178 -7.3 -3.0 -1.7 3.0 -3.2 3.9 Dec 1293 (93) Hillsborough County Aviation Authority USA TPA 175 2.9 -13.4 -7.7 -6.5 -49.1 -37.8 Sep 1294 (91) SAVE Aeroporto Marco Polo Italy VCE 172 -2.8 50.3 29.2 28.5 38.5 47.7 Dec 1295 (99) Edmonton Airports Canada YEG 171 17.1 -10.3 -6.0 9.9 -10.9 15.2 Dec 1296 (94) Birmingham Airport Holdings UK BHX 170 1.8 39.0 22.9 22.3 17.1 12.8 Mar 1397 (97) Charlotte-Douglas International USA CLT 158 4.6 40.7 25.8 24.2 55.0 57.3 Jun 1298 (100) San Diego County Regional Airport USA SAN 154 6.9 -10.2 -6.6 -16.0 37.5 20.4 Jun 1299 (96) Adelaide Airport Australia ADL 152 0.0 6.9 4.5 13.8 4.8 16.2 Jun 12100 (98) Toulouse-Blagnac International France TLS 148 0.7 11.0 7.4 6.1 – 7.1 Dec 12TOTALS 77,119 1.6 16,352 21.2 19.8 8,203 6,366 NOTE: EstAirline Business estimate calculated using six months published data.
FREE SPECIAL REPORTSFlightglobal Insight produces FREE special reports covering various aerospace topics with market analysis, technical information and graphics. Find out more and download our reports at
Insigghtht
–
November 2013

flightglobal.com/ab
PRIVATE LIVESAirport management, which is typically a public utility, has turned into a lucrative business opportunity for companies looking for low-risk investments, but it remains to be seen if this shift will do more good than harm in the long run
40 | Airline Business | November 2013
AIRPORTS OWNERSHIP
REPORTGÜNTER ENDRESLONDON
cargo, netted almost five times the minimum value set by the government of R5.47 billion ($2.5 billion), the choice of concessionaires has raised considerable concerns.
Airlines, in particular, fear that the high price paid and the fact that the public sector is still heavily involved, with Infraero retaining a 49% stake and regulatory surveillance still with Agência Nacional de Aviação Civil, will result in substantial increases in fees.
The government itself, rather belatedly, has realised that its choice of winning bidders showed a serious lack of managerial experi-ence – Fraport, Aena and Zurich were among the heavyweight global airport operators that were passed over – and has redrafted its rules for the next round of part privatisations. These will involve Rio de Janeiro/Galeão and Belo Horizonte/Confins later this year or early 2014.
FISCAL CONCERNSBidders will have to include an airport opera-tor with a portfolio of more than 35 million passengers a year, and also have to provide at least 25% of the equity. This is although the government is already understood to be con-sidering relaxing these terms to enable it to cast its net wider. In the long term, only the privatisation of Infraero, over which the gov-ernment has prevaricated far too long, will satisfy doubters.
The concern over raised fees is nowhere more clearly shown than in India, where charges to airlines have increased dramatical-ly since the government concluded public-
private partnership deals for the airports at Delhi, Mumbai, Bengaluru and Hyderabad.
The difference with Brazil is that the public sector stake has been limited to 26%, giving private operators greater control. This is fur-ther boosted by the government allowing pri-vate consortia to earn revenue at the two major airports from passenger levies, parking and landing charges paid by airlines. They were also permitted to make commercial non-aeronautical use of airport land.
GMR Group, one of India’s largest infra-structure enterprises, has majority interests in Delhi and Hyderabad, while GVK Industries – another conglomerate with diversified inter-ests – controlling Mumbai. All are partnered by global airports operators.
Both GMR and GVK have made initial for-ays into the international airport market, with
Increasingly, governments have been viewing airports as short-term profit-mak-ing enterprises, rather than part of a long-term vision and acceptance that invest-ment in new capacity and more efficient
use of existing airports is essential if future growth and demand for air travel is to be met. And therein lurks the danger.
In their eagerness to top up the treasury cof-fers, some have replaced inefficient public utilities with private operators. With the same profit motive but a lack of managerial experi-ence in the industry, the latter has failed to instigate the much needed efficiencies and commercial operation.
Nowhere is this more evident than in Brazil and India. Investors have been lining up to get a foothold in the so-called BRIC nations (Bra-zil, Russia, India and China), all of which have experienced exceptional economic growth and above average increases in pas-senger traffic. The Brazilian government and its airport operating arm, Infraero, were final-ly wrenched from their inertia, which had al-lowed the country’s airport infrastructure to deteriorate alarmingly. With the country stag-ing the World Cup in 2014 and the Olympic Games two years later, however, it has led to a frantic dash to improve and expand the ven-ues used for these major sporting occasions.
However, while the concession agreements for the three airports of São Paulo Guarulhos International, Brasília and Campinas- Viracopos, which together account for 30% of the country’s passenger traffic and 57% of

flightglobal.com/ab November 2013 | Airline Business | 41
concessions respectively at Istanbul, Turkey and Yogyakarta, Indonesia. Political shenani-gans have led to GMR being thrown out of Male airport in the Maldives.
Airports Authority of India (AAI), which – like its counterpart in Brazil – has failed to provide adequate infrastructure expansion in the face of growing air traffic with the pro-liferation of low-fare airlines, lost considera-ble income from these privatisations. As such, it is reluctant to extend the process, es-pecially the planned handover of Kolkata and Chennai airports, its highest earners, to the private sector.
Still on the agenda is a possible initial public offering (IPO) of the authority, but discrepancies between what it considers its own worth and that of independent valua-tions, and the need to enact an amendment
to the AAI Act by parliament, present seem-ingly insurmountable hurdles.
With the acquisition of Portugal’s airport operator ANA Aeroportos de Portugal and its 10 airports on the mainland and on Madeira and the Azores, Vinci Airports has become a major international player now with 23 air-ports in France, Portugal and Cambodia. The operator handles more than 40 million pas-sengers a year.
The contract for the 50-year concession, worth €3.1 billion ($4.2 billion), which was way above expectations and the nearest bids by Fraport and the Corporación América SA consortium, was a direct consequence of Portugal’s financial bailout by the European Commission, the European Central Bank and the International Monetary Fund.
The deal, which was signed in February 2013, was given the green light by the Euro-pean Commission in June, as “the transac-tion did not raise any competition prob-lems”. Vinci will hold a 95% stake in ANA, with the remainder given to employees. The Lisbon hub, in particular, represents an im-portant strategic asset for high growth desti-nations such as Brazil and Portuguese-speaking Angola and Mozambique in southern Africa.
Fraport views airport operations in emerging markets, as a viable
expansion opportunity
Share of total passengers taken by concession agreements at
three airports in Brazil
30%

flightglobal.com/ab
AIRPORTS OWNERSHIP
42 | Airline Business | November 2013
Neighbouring Spain, which finds itself in a similarly precarious economic position, has been prevaricating over the partial privatisa-tion of Aena Aeropuertos. However, this may now be forced into swift action to ease the government’s own finances, or to pay off the authority’s massive debt, said to be around €12 billion, incurred largely for the Madrid and Barcelona airport expansions.
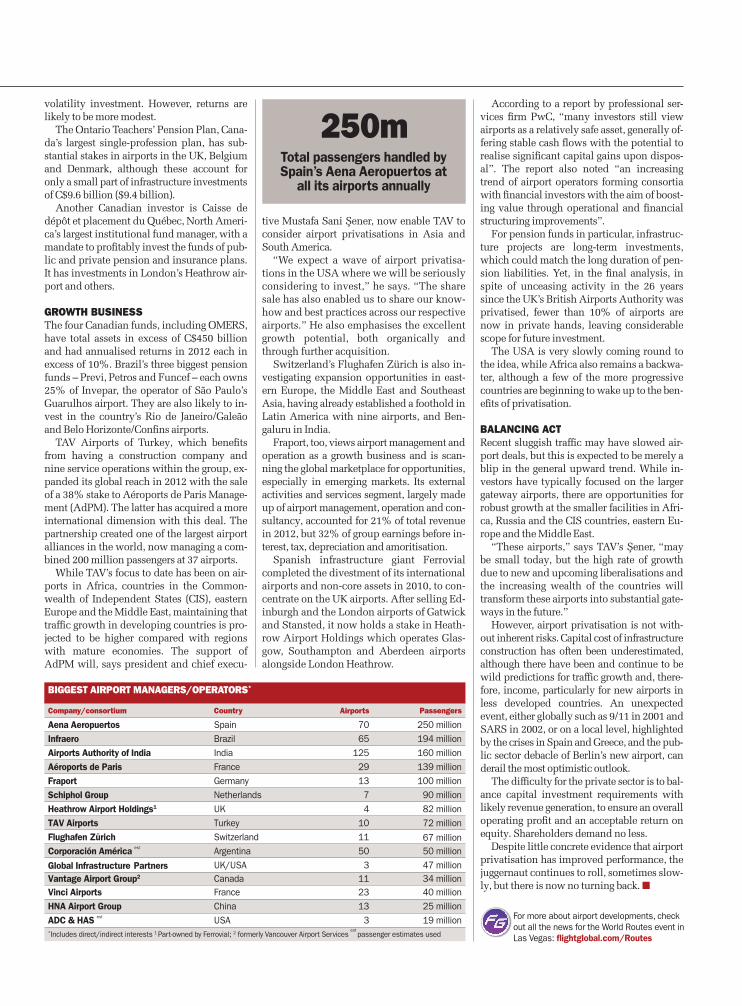
State-owned Aena runs 46 airports in Spain and has interests in another 26 in Latin America, handling around 250 million pas-sengers a year. The Spanish government has not announced what form the partial privati-sation will take, nor has it set a firm timetable, although it is likely to take place by the end of 2013 or early 2014.
Spain’s status as Europe’s premier holiday destination and its close links with Latin Amer-ica through the Madrid hub, make this an at-tractive asset. The purchase is estimated to cost the successful bidder anywhere between €6 bil-lion and €15 billion, depending on the size of what is expected to be a minority stake only.
MERGERS AND ACQUISITIONSSpanish infrastructure group Abertis has made a major adjustment to its assets base in the past few months with the sale of most of its airports. In July, the company agreed to dispose of the concession of Luton airport to a consortium of Aena Internacional (51%) and AXA Private Equity (49%) for €502 million.
It also reached agreement to offload Belfast International, Stockholm Skavsta, the termi-nal concessions at Orlando Sanford Interna-tional, and TBI’s airport management busi-ness in the USA to operator ADC & HAS Airports Worldwide for €284 million.
Both deals are subject to regulatory and local authority approval. Cardiff airport was sold last March to the Welsh government for €61 mil-lion. Abertis’s airport business is now limited to a stake in Grupo Aeroportuario del Pacifico in Mexico, and the concession of Montego Bay in Jamaica. Both are likely to be sold.
According to the company, the move is part of a strategy to optimise its asset base. In contrast, ADC & HAS Airports Worldwide is expanding. These most recent additions will increase its portfolio, which also includes Quito, the major airport in Ecuador, and the Costa Rican airports of San José and Liberia.
ADC & HAS brings together the technical resources of Houston Airport System, the air-
port privatisation experience of Airport De-velopment Cor, and the financial strength of the Ontario Municipal Employees Retire-ment System (OMERS), one of Canada’s larg-est pension plans, which – through OMERS Strategic Investments – is the majority owner of ADC & HAS.
Corporación América SA, whose portfolio comprises 50 airports in Argentina, Brazil, Uruguay, Peru, Ecuador, Italy and Armenia, has acquired the executive flights terminal at Milan’s Linate airport. It will invest €20 mil-lion over the next five years. The company has stated that it will bid for the Brazilian air-ports of Rio de Janeiro and Belo Horizonte.
Germany’s largest construction company, Hochtief AG, has taken a less bullish view of the airport business, although the €1.1 billion sale in May of its airport division had more to do with reducing debt at majority owner Ac-tividades de Construccion y Serviciós (ACS) of Spain, than on a loss of confidence in the viability of its airports in Germany, Greece, Hungary, Albania and Australia.
The buyer was the Public Sector Investment Board (PSP Investments) of Montreal, Canada, the latest in a growing line of international pen-sion funds to have invested directly in airports.
PSP Investments expects net positive in-flows until at least 2030, which, it says, “ena-bles us to act on opportunities that may arise and maintain our investments for the long-term, even in difficult market conditions without the burden of liquidity constraints”.
Direct investments in infrastructure by pension funds, a relatively new phenomenon, has been driven by a desire to move away from the more risky investments in stocks and bonds to a more stable, long-term and low
Given the upcoming sporting events, Brazil’s government scrambled for investors to help improve São Paulo’s Guarulhos International airport
“We expect a wave of airport privatisations in
the USA where we will be considering to invest”
MUSTAFA SANI SENERPresident, TAV Airports of Turkey
Max
Kin
gsle
y-Jo
nes/
Flig
htgl
obal
flightglobal.com/ab November 2013 | Airline Business | 43
For more about airport developments, check out all the news for the World Routes event in Las Vegas: flightglobal.com/Routes
volatility investment. However, returns are likely to be more modest.
The Ontario Teachers’ Pension Plan, Cana-da’s largest single-profession plan, has sub-stantial stakes in airports in the UK, Belgium and Denmark, although these account for only a small part of infrastructure investments of C$9.6 billion ($9.4 billion).
Another Canadian investor is Caisse de dépôt et placement du Québec, North Ameri-ca’s largest institutional fund manager, with a mandate to profitably invest the funds of pub-lic and private pension and insurance plans. It has investments in London’s Heathrow air-port and others.
GROWTH BUSINESSThe four Canadian funds, including OMERS, have total assets in excess of C$450 billion and had annualised returns in 2012 each in excess of 10%. Brazil’s three biggest pension funds – Previ, Petros and Funcef – each owns 25% of Invepar, the operator of São Paulo’s Guarulhos airport. They are also likely to in-vest in the country’s Rio de Janeiro/Galeão and Belo Horizonte/Confins airports.
TAV Airports of Turkey, which benefits from having a construction company and nine service operations within the group, ex-panded its global reach in 2012 with the sale of a 38% stake to Aéroports de Paris Manage-ment (AdPM). The latter has acquired a more international dimension with this deal. The partnership created one of the largest airport alliances in the world, now managing a com-bined 200 million passengers at 37 airports.
While TAV’s focus to date has been on air-ports in Africa, countries in the Common-wealth of Independent States (CIS), eastern Europe and the Middle East, maintaining that traffic growth in developing countries is pro-jected to be higher compared with regions with mature economies. The support of AdPM will, says president and chief execu-
tive Mustafa Sani Şener, now enable TAV to consider airport privatisations in Asia and South America.
“We expect a wave of airport privatisa-tions in the USA where we will be seriously considering to invest,” he says. “The share sale has also enabled us to share our know-how and best practices across our respective airports.” He also emphasises the excellent growth potential, both organically and through further acquisition.
Switzerland’s Flughafen Zürich is also in-vestigating expansion opportunities in east-ern Europe, the Middle East and Southeast Asia, having already established a foothold in Latin America with nine airports, and Ben-galuru in India.
Fraport, too, views airport management and operation as a growth business and is scan-ning the global marketplace for opportunities, especially in emerging markets. Its external activities and services segment, largely made up of airport management, operation and con-sultancy, accounted for 21% of total revenue in 2012, but 32% of group earnings before in-terest, tax, depreciation and amoritisation.
Spanish infrastructure giant Ferrovial completed the divestment of its international airports and non-core assets in 2010, to con-centrate on the UK airports. After selling Ed-inburgh and the London airports of Gatwick and Stansted, it now holds a stake in Heath-row Airport Holdings which operates Glas-gow, Southampton and Aberdeen airports alongside London Heathrow.
According to a report by professional ser-vices firm PwC, “many investors still view airports as a relatively safe asset, generally of-fering stable cash flows with the potential to realise significant capital gains upon dispos-al”. The report also noted “an increasing trend of airport operators forming consortia with financial investors with the aim of boost-ing value through operational and financial structuring improvements”.
For pension funds in particular, infrastruc-ture projects are long-term investments, which could match the long duration of pen-sion liabilities. Yet, in the final analysis, in spite of unceasing activity in the 26 years since the UK’s British Airports Authority was privatised, fewer than 10% of airports are now in private hands, leaving considerable scope for future investment.
The USA is very slowly coming round to the idea, while Africa also remains a backwa-ter, although a few of the more progressive countries are beginning to wake up to the ben-efits of privatisation.
BALANCING ACTRecent sluggish traffic may have slowed air-port deals, but this is expected to be merely a blip in the general upward trend. While in-vestors have typically focused on the larger gateway airports, there are opportunities for robust growth at the smaller facilities in Afri-ca, Russia and the CIS countries, eastern Eu-rope and the Middle East.
“These airports,” says TAV’s Şener, “may be small today, but the high rate of growth due to new and upcoming liberalisations and the increasing wealth of the countries will transform these airports into substantial gate-ways in the future.”
However, airport privatisation is not with-out inherent risks. Capital cost of infrastructure construction has often been underestimated, although there have been and continue to be wild predictions for traffic growth and, there-fore, income, particularly for new airports in less developed countries. An unexpected event, either globally such as 9/11 in 2001 and SARS in 2002, or on a local level, highlighted by the crises in Spain and Greece, and the pub-lic sector debacle of Berlin’s new airport, can derail the most optimistic outlook.
The difficulty for the private sector is to bal-ance capital investment requirements with likely revenue generation, to ensure an overall operating profit and an acceptable return on equity. Shareholders demand no less.
Despite little concrete evidence that airport privatisation has improved performance, the juggernaut continues to roll, sometimes slow-ly, but there is now no turning back. ■
BIGGEST AIRPORT MANAGERS/OPERATORS*
Company/consortium Country Airports Passengers
Aena Aeropuertos Spain 70 250 millionInfraero Brazil 65 194 millionAirports Authority of India India 125 160 millionAéroports de Paris France 29 139 millionFraport Germany 13 100 millionSchiphol Group Netherlands 7 90 millionHeathrow Airport Holdings1 UK 4 82 millionTAV Airports Turkey 10 72 millionFlughafen Zürich Switzerland 11 67 million Corporación América est Argentina 50 50 million
Global Infrastructure Partners UK/USA 3 47 millionVantage Airport Group2 Canada 11 34 millionVinci Airports France 23 40 millionHNA Airport Group China 13 25 millionADC & HAS est USA 3 19 million*Includes direct/indirect interests 1 Part-owned by Ferrovial; 2 formerly Vancouver Airport Services
est passenger estimates used
Total passengers handled by Spain’s Aena Aeropuertos at
all its airports annually
250m

flightglobal.com/ab44 | Airline Business |
From their Asian origins, budget terminals quickly spread to other regions, but will they revolutionise air travel in the manner of no-frills airlines, or are they going out of fashion?
AIRPORTS LOW-COST TERMINALS
CHEAP AND CHEERFUL
REPORTALEX THOMASBORDEAUX
MAVIS TOHSINGAPORE
In theory, low-cost airline terminals should be the perfect complement to the budget airlines for which they cater. Terminals with only the most essential facilities charging lower rates mean low-cost carriers
can avoid “gold-plated Taj Mahals” – a term Ryanair’s epigrammatic chief, Michael O’Leary, has used to attack what he deems extravagant expenditure on airport infrastructure.
Yet in the same manner as their no-frills carrier counterparts divided opinion over in-creasing the commodification of air travel, so low-cost terminals elicit strong opinions, both positive and negative, from passengers.
When Singapore named its dedicated low-cost terminal the Budget Terminal in 2006, it could have been to manage expectations. After all, the city-state’s Changi airport is known for being one of the world’s best, winning numer-ous awards as proof. The experience at the one-storey terminal was, however, quite different.
November 2013
With limited food and shops, the terminal would at best be described as functional. Al-though efficient, passengers complained about venturing out in hot and humid local weather to board flights as there were no airbridges.
The terminal survived only six years before it was torn down in 2012 to make way for the new Terminal 4, which Changi said will be more “upscale”, and offer a wider range of medium- to high-end retail and food options.
One of the more recent attempts to develop the genre is Bordeaux’s Billi terminal. But given the five years it had to learn lessons from earlier low-cost terminal examples in Kuala Lumpur, Singapore and closer to home in Mar-seilles, has it moved the model to maturity?
MAKING THEM PAYCompleted in May 2010, Billi’s 43,000ft² (4,000m²) terminal was built for a total cost of €5 million ($7 million), according to the air-
port’s commercial development director, Jean-Luc Poiroux. Inside a minimalist interior, its six check-in desks have no electronic signs and no conveyor belts, with passengers carrying hold luggage to the bag drop area themselves.
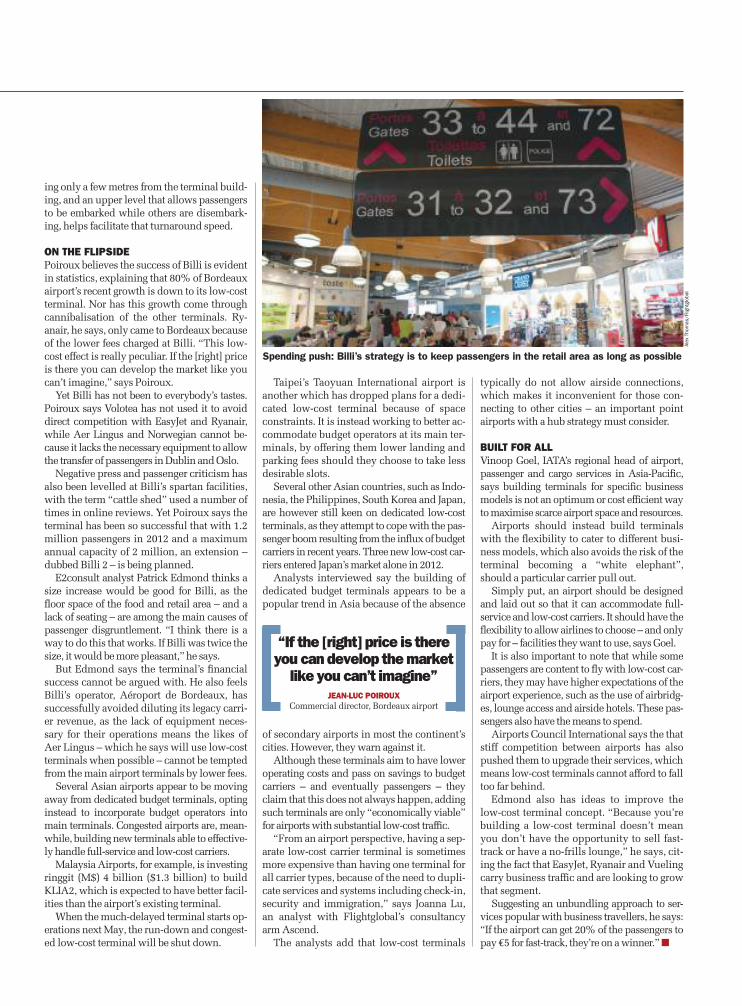
To make the terminal pay for itself, 20% of its floor space is dedicated to retail. A process in which gates to the embarkation halls are only opened when triggered by an electronic signal issued when the aircraft to be boarded is approaching Bordeaux ensures passengers stay in the retail area for the longest time pos-sible, surrounded by opportunities to spend.
“The equation works if the passengers spend, but the main point is the flight should take off on time,” says Poiroux.
In addition to low fees, quick turnaround times are another big attraction to Billi’s budg-et airline customers. “We’ve seen Ryanair planes turnaround in 15min, but most take 25-30min,” says Poiroux. With aircraft park-
Failed attempt: the low-cost terminal at Changi closed after six years to make way for Terminal 4, which promises better facilities
flightglobal.com/ab | Airline Business | 45
ing only a few metres from the terminal build-ing, and an upper level that allows passengers to be embarked while others are disembark-ing, helps facilitate that turnaround speed.
ON THE FLIPSIDEPoiroux believes the success of Billi is evident in statistics, explaining that 80% of Bordeaux airport’s recent growth is down to its low-cost terminal. Nor has this growth come through cannibalisation of the other terminals. Ry-anair, he says, only came to Bordeaux because of the lower fees charged at Billi. “This low-cost effect is really peculiar. If the [right] price is there you can develop the market like you can’t imagine,” says Poiroux.
Yet Billi has not been to everybody’s tastes. Poiroux says Volotea has not used it to avoid direct competition with EasyJet and Ryanair, while Aer Lingus and Norwegian cannot be-cause it lacks the necessary equipment to allow the transfer of passengers in Dublin and Oslo.
Negative press and passenger criticism has also been levelled at Billi’s spartan facilities, with the term “cattle shed” used a number of times in online reviews. Yet Poiroux says the terminal has been so successful that with 1.2 million passengers in 2012 and a maximum annual capacity of 2 million, an extension – dubbed Billi 2 – is being planned.
E2consult analyst Patrick Edmond thinks a size increase would be good for Billi, as the floor space of the food and retail area – and a lack of seating – are among the main causes of passenger disgruntlement. “I think there is a way to do this that works. If Billi was twice the size, it would be more pleasant,” he says.
But Edmond says the terminal’s financial success cannot be argued with. He also feels Billi’s operator, Aéroport de Bordeaux, has successfully avoided diluting its legacy carri-er revenue, as the lack of equipment neces-sary for their operations means the likes of Aer Lingus – which he says will use low-cost terminals when possible – cannot be tempted from the main airport terminals by lower fees.
Several Asian airports appear to be moving away from dedicated budget terminals, opting instead to incorporate budget operators into main terminals. Congested airports are, mean-while, building new terminals able to effective-ly handle full-service and low-cost carriers.
Malaysia Airports, for example, is investing ringgit (M$) 4 billion ($1.3 billion) to build KLIA2, which is expected to have better facil-ities than the airport’s existing terminal.
When the much-delayed terminal starts op-erations next May, the run-down and congest-ed low-cost terminal will be shut down.
Alex
Tho
mas
/Flig
htgl
obal
November 2013
Taipei’s Taoyuan International airport is another which has dropped plans for a dedi-cated low-cost terminal because of space constraints. It is instead working to better ac-commodate budget operators at its main ter-minals, by offering them lower landing and parking fees should they choose to take less desirable slots.
Several other Asian countries, such as Indo-nesia, the Philippines, South Korea and Japan, are however still keen on dedicated low-cost terminals, as they attempt to cope with the pas-senger boom resulting from the influx of budget carriers in recent years. Three new low-cost car-riers entered Japan’s market alone in 2012.
Analysts interviewed say the building of dedicated budget terminals appears to be a popular trend in Asia because of the absence
of secondary airports in most the continent’s cities. However, they warn against it.
Although these terminals aim to have lower operating costs and pass on savings to budget carriers – and eventually passengers – they claim that this does not always happen, adding such terminals are only “economically viable” for airports with substantial low-cost traffic.
“From an airport perspective, having a sep-arate low-cost carrier terminal is sometimes more expensive than having one terminal for all carrier types, because of the need to dupli-cate services and systems including check-in, security and immigration,” says Joanna Lu, an analyst with Flightglobal’s consultancy arm Ascend.
The analysts add that low-cost terminals
typically do not allow airside connections, which makes it inconvenient for those con-necting to other cities – an important point airports with a hub strategy must consider.
BUILT FOR ALLVinoop Goel, IATA’s regional head of airport, passenger and cargo services in Asia-Pacific, says building terminals for specific business models is not an optimum or cost efficient way to maximise scarce airport space and resources.
Airports should instead build terminals with the flexibility to cater to different busi-ness models, which also avoids the risk of the terminal becoming a “white elephant”, should a particular carrier pull out.
Simply put, an airport should be designed and laid out so that it can accommodate full-service and low-cost carriers. It should have the flexibility to allow airlines to choose – and only pay for – facilities they want to use, says Goel.
It is also important to note that while some passengers are content to fly with low-cost car-riers, they may have higher expectations of the airport experience, such as the use of airbridg-es, lounge access and airside hotels. These pas-sengers also have the means to spend.
Airports Council International says the that stiff competition between airports has also pushed them to upgrade their services, which means low-cost terminals cannot afford to fall too far behind.
Edmond also has ideas to improve the low-cost terminal concept. “Because you’re building a low-cost terminal doesn’t mean you don’t have the opportunity to sell fast-track or have a no-frills lounge,” he says, cit-ing the fact that EasyJet, Ryanair and Vueling carry business traffic and are looking to grow that segment.
Suggesting an unbundling approach to ser-vices popular with business travellers, he says: “If the airport can get 20% of the passengers to pay €5 for fast-track, they’re on a winner.” ■
Spending push: Billi’s strategy is to keep passengers in the retail area as long as possible
“If the [right] price is there you can develop the market
like you can’t imagine”JEAN-LUC POIROUX
Commercial director, Bordeaux airport

Regionals subject
February 2012 | Airline Business | 13flightglobal.com/ab
Flightglobal InsightQuadrant House, The Quadrant, Sutton, Surrey, SM2 5AS, UKTel: +44 20 8652 8724 Email: [email protected] Web: www.flightglobal.com/insight

![UR Financials User-Group 06-17-15.pptx [Read-Only] · PDF fileUR Financials User Group – June 2015 ... Kate Crowley ‐IT X X X X X X X X X X X X ... • Review UR Financials June](https://img.dokumen.tips/doc/110x75/5abe29327f8b9a7e418c8bff/ur-financials-user-group-06-17-15pptx-read-only-financials-user-group-june.jpg)


![UR Financials User-Group 5-18-16 clean - rochester.edu · • No UR Financials classes for the Summer [June 8th–August] – Work with UR Financials Champions for new user training](https://img.dokumen.tips/doc/110x75/5acf5df37f8b9a8b1e8ca55a/ur-financials-user-group-5-18-16-clean-no-ur-financials-classes-for-the-summer.jpg)


![UR Financials User-Group 06-17-15.pptx [Read-Only]](https://img.dokumen.tips/doc/110x75/61c0ccf8261f4c35e77dff2a/ur-financials-user-group-06-17-15pptx-read-only.jpg)