Embed Size (px)
Citation preview

Demand side –India will become a net importer of food and
grains
1
1
3
0
6
8
1
6
0
6
9
12
15
19
21
26
32
45
9
0 5 10 15 20 25 30 35 40 45 50
Bangladesh
Ethiopia & Eritrea
Indonesia
Nigeria
Mexico
Egypt
Pakistan
Iran
India
China
Million tons
20301990
215m
Source: WorldwatchInstitute.

India – Projected Supply/Demand Gap
Source: Surabhi Mittal, ICRIER

The Water Perspective
We must always keep in mind that agriculture is a water based business. Without this scarce resource there is no agriculture at all.
Water availability is key to this business. Projected global water consumption is tightly related to producing grains and food in general.
So, what is the current and projected water situations both in Africa and South America?
See UNEP/GRID Arendal Maps and Graphics Library. 2009. Trends in global water use by sector. http://maps.grida.no/go/graphic/trends-in-global-water-use-by-sector

Source: International Water Management Institute analysis done for the Comprehensive Assessment of Water Management in Agriculture using the Waterism model; chapter 2.
See UNEP/GRID Arendal Maps and Graphics Library, Areas of physical and economic water scarcity,
http://maps.grida.no/go/graphic/areas-of-physical-and-economic-water-scarcity
The Water Perspective
Operational Revenues: Crop Yields
Anatomy of a successful case: Argentina
Taking yields to full internationally competitive standards, require important local R&D efforts.
As seen on the graph to the right (above), about 100 varieties are registered per year (in one decade that means more than 1000 varieties). Each tackle very specific issues not only at country level but at region level (212 of these ‘varieties’ are soybean).
We can also see the importance of local R&D in this process; on average about 60% of registration are originated from local R&D.
Another interesting aspect to note is that the international push really started during the 90’s, when the Argentinean agriculture scenario started growing at impressive rates and so there was an interesting market for international players.
It’s difficult to visualize the top leading international seed and R&D players really committing resources in the amounts required to produce agro leaps in Africa, until the market is really attractive, their sense of security for their patents is strong, etc.
International players will probably do something, as it will look nice in their marketing materials and ‘social responsibility’ claims, but without the local knowledge and scientific capabilities, growth in yields will be very slow.
A typical seed project in South America takes between 7 to 10 years to become commercial, and this is starting with the infrastructure, resources, scientists, long-time experience, extensive knowledge base and germplasm banks, etc. all in place.
In many African countries, this process is starting from scratch. We are probably looking at a 15 to 20 year lag. With international cooperation and cross country agreements, maybe it can be shortened to a 10 - 15 year, not much more than that.
Total Number of Seed Varieties Registered (Cereals & Oil seeds)
0
50
100
150
200
250
80 81 82 83 84 85 86 87 88 89 90 91 92 93 94 95 96 97 98 99 00 01 02 03 04 05 06 07 08 09*
Local Origin Foreign Origin
Total Seed Varieties Registered (Cereals & Oil seeds)
0%
10%
20%
30%
40%
50%
60%
70%
80%
90%
100%
80
81
82
83
84
85
86
87
88
89
90
91
92
93
94
95
96
97
98
99
00
01
02
03
04
05
06
07
08
09*

Conclusions on Crop Yields
Large scale agriculture as a business requires much more than just “good land” and “water / rain” availability. These are necessary conditions, but not even close to enough.
Reaching international competitive yields in Africa will take at least 10 to 15 years of serious R&D and important volumes of investments.
Simply importing seeds doesn’t make the cut as we have seen based on successful experiences in South America.
For the purpose of this report and given the above, when we say ‘South America’, we are referring to Argentina, Brazil, Paraguay and Uruguay.
For the purpose of this report and given the considerations above, when we say ‘Africa’ we are referring to Angola, Congo, Ethiopia, Kenya, Madagascar, Mozambique, Sudan, Tanzania, Zambia and Zimbabwe. There are some other countries in Africa promoting this method, but given their land extensions and potential or lack of information, they have not been considered; nevertheless, the conclusions might well apply for all of them.

News Releases from Top Agriculture Seed Providers
Syngenta and Embrapa establish multi-crop partnership to advance solutions for Brazilian growers.
Collaboration between Syngenta and IAC (Sao, Paulo - Brazil) accelerates sugar cane Research and Development activities.
Syngenta receives approval for new corn technologies in Argentina
Syngenta to develop high-sugar-content technology in cane, Sao Paulo - Syngenta Latin America.
Syngenta receives approval for new corn technologies in Brazil
Syngenta to acquire Monsanto’s hybrid sunflower seeds activities - further strengthening its leading sunflower business position in Europe and Latin America.
Syngenta Licenses Chromatin Gene Stacking Technology for Sugar cane (“which will give the a leading position in Brazil”)
Syngenta acquires Argentine seeds company SPS
April 28, 2010
Feb 08, 2010
Dec 22, 2009
Dec 16, 2009
Nov 13, 2009
Syngenta CEO expresses commitment to bringing technology and agronomic knowledge to African farmers.
Aug 25, 2009
Aug 06, 2009
Jun 26, 2009
Nov 10, 2008
Source: Syngenta Global Media Releases: http://www2.syngenta.com/en/media/mediareleases.html
May 31, 2010 10:25 (GMT-3)
• 9 out a total of 50 press releases talk about South America (concrete actions and achievements).
• 1 press release talks about Africa (a forward looking statement).

0 1 2 3 4 5 6 7
Sudan
Congo DR
Angola
Zimbabwe
Madagascar
Ethiopia
Kenya
Mozambique
Tanzania
Zambia
Paraguay
Brazil
Argentina
Uruguay
Civil LibertiesPolitical Freedom
The Social Perspective
Political and Freedom Index 2009
0-2 Free Countries
2-5 Relative Freedom
5-7 No Freedom

The Social Perspective
Political Stability Index (2008) [Range 2,5 to -2,5]
-2,5
-2
-1,5
-1
-0,5
0
0,5
1
Mo
zam
biq
ue
Zam
bia
Tan
zan
ia
Mad
agas
car
An
go
la
Ken
ya
Zim
bab
we
Eth
iop
ia
Co
ng
o D
R
Su
dan
Uru
gu
ay
Arg
enti
na
Bra
zil
Par
agu
ay
Au
stra
lia
Un
ited
Sta
tes

The Social Perspective
Rule of Law - Country Percentile of World (2008)
0 10 20 30 40 50 60 70
Uruguay
India
Tanzania
Brazil
Madagascar
Zambia
Ethiopia
Argentina
Mozambique
Kenya
Paraguay
Angola
Sudan
Congo, DR
Zimbabwe

The Social Perspective
Contract and Title Survival Risk Map
Our company developed this map to asses title and lease contact security based on the following assumptions:
• Very few contracts, especially with governments, survive long periods (20+ years) in emerging markets (statement generally valid both for Africa and South America).
• The chances of survival increase when these contracts are in areas that are not highly sensitive to the general electoral base – vote bank of the country.
• The higher the amount of population that lives in rural areas as farmers, the more sensitive is the ‘land issue’, as it applies to foreigners, and higher are the chances that it will be used by politicians, extremists or power groups to seek political benefits and nullify existing contracts.
• The lower the perceived legitimacy of the government, the higher the threat to titles, contracts and laws that were originated by that government.
Relative good protection by laws and the judicial system
Somewhat protected by laws and the judicial system
Low to very low protection by laws and the judicial system
% of Rural Population
Political Stability Index
And if things go wrong? :
About the Map:

The Land Ownership Risk Map and some Emblematic Cases: Africa vs South America
ZIMBABWE: 70% Rural Population
Low development indexes
High Political instability
= Almost all farms owned by “white” people have been confiscated since 2000.
MADAGASCAR: 75% Rural Population
Medium Political instability
Daewoo announced a big farmland lease agreement at the end of 2008.
= Immediate scandal and popular uprising, the deal was terminated.
PARAGUAY: 40% Rural Population
Low development indexes
Medium Political instability
President Lugo won election, among electoral campaign proposals was an important land reform.
= A law (not very radical) on this topic has been presented but has been stopped in parliament given that his party hasn’t got majority in congress.
ARGENTINA I: 8% Rural Population
Relative good development index
High political instability in 2001 (big economic crisis, government was out-thrown by social up-rise, 5 different presidents in 20 months.)
= Not once throughout the turmoil the topic of big farms or foreign investors in land appeared.
ARGENTINA II: The government needing additional funds, planned to increase taxes on some crops to farmers, the strategy to sell its project was talking about large land tenants, big groups in farming, etc.
= Not only the bill was stopped in parliament, but there were public demonstrations in urban areas supporting the farmers.
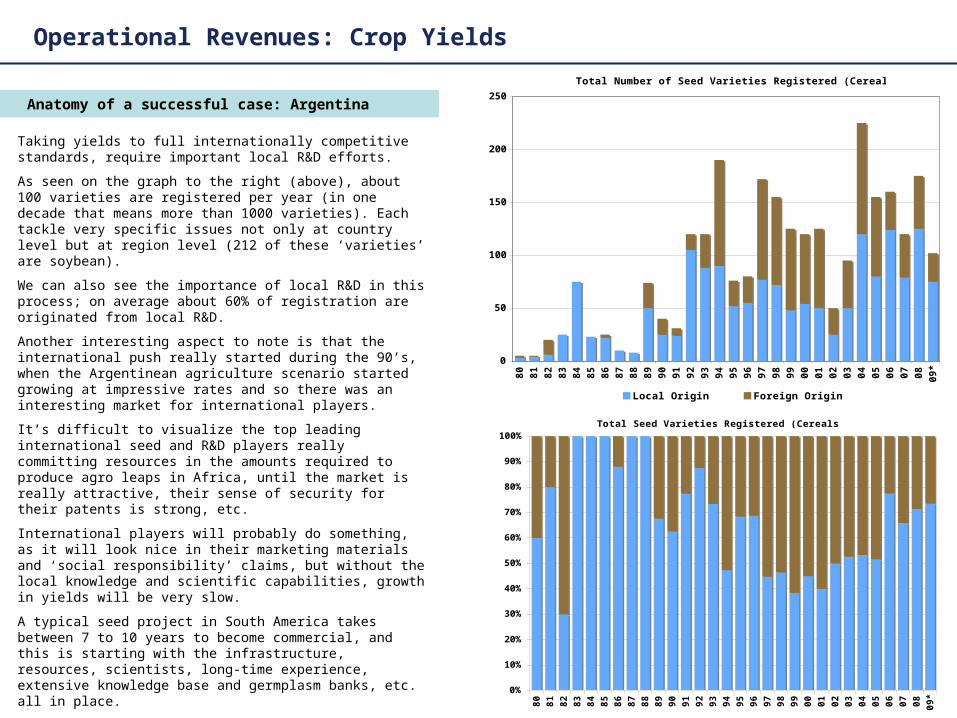
Risk of ‘African Singurs’ – from rural population displaced from large-scale agriculture
Rural Population as % of Total (2005)
0% 10% 20% 30% 40% 50% 60% 70% 80% 90%
Congo
Kenya
Sudan
Mozambique
Tanzania
Angola
Zambia
Zimbabwe
Madagascar
Ethiopia
Uruguay
Argentina
Brazil
Paraguay

In Africa, risk of ‘Singurs’ from population growth; favorable/cheap land leases are usually granted by governments with little political legitimacy; so risk of being overturned later
Source: UN Population Database
2005 2025 2050 2005 2025 2050Argentina 39 46 51 Ethiopia 75 120 174Brazil 186 214 218 Kenya 36 58 85Uruguay 3 4 4 Tanzania 39 67 109Paraguay 6 8 10 Madagascar 18 28 43
Mozambique 21 32 44Senegal 57 91 133Sudan 39 57 76
Population growth (in millions)

Population density (population per sq. km)
Source: UN Population Database
Year2005 2025 2050
Argentina 14 17 18Brazil 22 27 30Uruguay 19 20 21Paraguay 15 20 24India 345 440 504
Ethiopia 68 109 157Kenya 62 99 147Tanzania 41 71 116MadagascarMozambique 26 39 55Sudan 15 23 30

Population % with Access to Clean Water
0% 20% 40% 60% 80% 100%
Ethiopia
Angola
Madagascar
Congo
Mozambique
Kenya
Zambia
Tanzania
Sudan
Zimbabwe
Paraguay
Brazil
Argentina
Uruguay
Some other Indicators that might affect the initial ‘equilibrium’ in the future

Projected Annual Population Growth Rates (2015)
0,00% 0,50% 1,00% 1,50% 2,00% 2,50% 3,00% 3,50%
Congo
Angola
Kenya
Madagascar
Ethiopia
Sudan
Zambia
Tanzania
Mozambique
Zimbabwe
Paraguay
Brazil
Argentina
Uruguay
Some other Indicators that might affect the initial ‘equilibrium’ in the future

South America vs Africa
Brazil
Ethiopia

Also less water per capita in Africa compared to South America
TARWR/ m3/percapita/year
Argentina 20,940 Ethiopia 1,680
Brazil 45,470 Kenya 930
Uruguay 40,420 Tanzania 2,420
Paraguay 55,830 Madagascar 18,830
India 1,750 Mozambique 11,320
Sudan 1,880
Source: UN Aquastat

South America is an immediate opportunity
Buy/Lease Land Yes No (lease only)
Service Providers(planting/spraying etc.)
Yes No
Qualified Manpower Yes No
Political Risk(low populations, democracies, corruption etc.)
Low High
Tested high yield crop/seed varieties
Yes No
South America Africa

Regarding Almost “Free land” in Africa:Maintaing a gift elephant is not free
Note: Numbers based on median Latin American land conversion rates to convert raw land to agriculture ready land. Africa figures could be higher/
Making improvements on leased land is like putting in new brakes, clutch and tyres on a rental car

Other South American advantages for Indian
investors