Embed Size (px)
Citation preview

00
0
0
FY2011 Financial Results ended March 31, 2012
TSE:9531
April 27, 2012
Thank you for coming to today’s earnings presentation.Today I would like to explain our financial results for FY2011 and plan for FY2012, as well as the current status of progress of our 2020 Vision and initiatives.First I will present our FY2011 results and fiscal 2012 plan, and then I will move on to the progress being made under the 2020 Vision.

1
1
1
Consolidated Financial Results ended March 31, 2012 and FY2012 Forecast

2
2
2
FY2011 FY2010 Change %
Gas sales volume (mil. m3 , 45MJ) 15,190 14,745 445 +3.0Net sales 1,754.2 1,535.2 219.0 +14.3Operating expenses 1,677.1 1,412.7 264.4 +18.7
Operating income 77.0 122.4 ‐45.4 ‐37.1
Ordinary income 75.6 121.5 ‐45.9 ‐37.8
Net income 46.0 95.4 ‐49.4 ‐51.8
Sliding time lag effect (non‐consolidated basis) ‐47.3 ‐29.2 ‐18.1 ‐Amortization of actuarial differences (non‐consolidated basis) ‐2.7 +19.9 ‐22.7 ‐
Economic conditions
JCC ($/bbl) Ex. Rate (¥/$)Avg.
temperature(℃)
FY2011 114.16 79.08 16.4FY2010 84.15 85.74 16.7
FY2011 Full Year Financial Results
Financial Highlights (vs. FY10) sales growth, profit decline (+/‐ indicates profit impact, billion yen)
From tax code revision (‐4.4) (Unit: billion yen)
Gas sales grew (+169.2; higher resources costs led to increase in unit price, gas sales volume, etc.)+Net sales :
Personal expenses increased on amortization of actuarial differences in pension accounting grew (non‐consolidated) (‐22.7)
City Gas resources costs increased (‐189.3)‐Operating expenses :
Foreign exchange gains and losses at overseas subsidiaries, etc. (‐1.0)‐Non‐operating Income and expenses
:
Increase in profit from equity‐method investments (+1.3)+Absence of extraordinary income from sale of land in Toyosu in FY2010 (‐39.7)Extraordinary loss : ‐
LNG sales grew (+40.3)+
‐
Electricity sales grew (+31.6)+
Decrease of gains from weather derivatives(‐0.9)‐
*pretax basis ‐
Pension Investment yield(costs deducted)
Discount rate
Year‐end assets
(billion yen)
FY2010 2.70 % 2.0 % 235FY2009 7.16 % 2.1 % 222
Net sales rose ¥219.0 billion, or 14.3%, to ¥1,754.2 billion. This reflected a ¥169.2 billion increase in gas sales on growth in gas sales volume and higher sales unit prices tied to higher resource costs, combined with growth in LNG and electricity sales.At the same time, operating expenses grew ¥264.4 billion, or 18.7%, to ¥1,677.1 billion, on a ¥189.3 billion increase in city gas resource costs from a rise in crude oil prices, and a ¥22.7 billion increase in personnel expenses from increased amortization of actuarial differences in pension accounting.As a result, operating income declined ¥45.4 billion, or 37.1%, to ¥77.0 billion, and ordinary income was ¥45.9 billion, or 37.8%, lower at ¥75.6 billion.With the absence of the previous year’s ¥39.7 billion extraordinary gain from the sale of land in Toyosu to the Tokyo metropolitan government, net income after the payment of income taxes declined ¥49.4 billion, or 51.8%, to ¥46.0 billion. In addition, the sliding time lag affect at Tokyo Gas on a non-consolidated basis grew to a ¥47.3 billion shortfall, compared with the previous year’s ¥29.2 billion shortfall, for an ¥18.1 billion negative impact on operating income.Amortization of actuarial differences in pension accounting had a ¥22.7 billion negative impact on operating income as well, increasing personnel expenses by ¥2.7 billion in fiscal 2011 after having reduced personnel expenses by ¥19.9 billion in fiscal 2010.
3
3
3
1,947
6,237
3,042
3,520
1,970
6,856
2,827
3,538
0
5,000
10,000
15,000
FY2010 FY2011
Consolidated Gas Sales Volume (Apr.1, 2011 – Mar.31, 2012)
mil. m3, 45MJ(rounded at mil. m3)
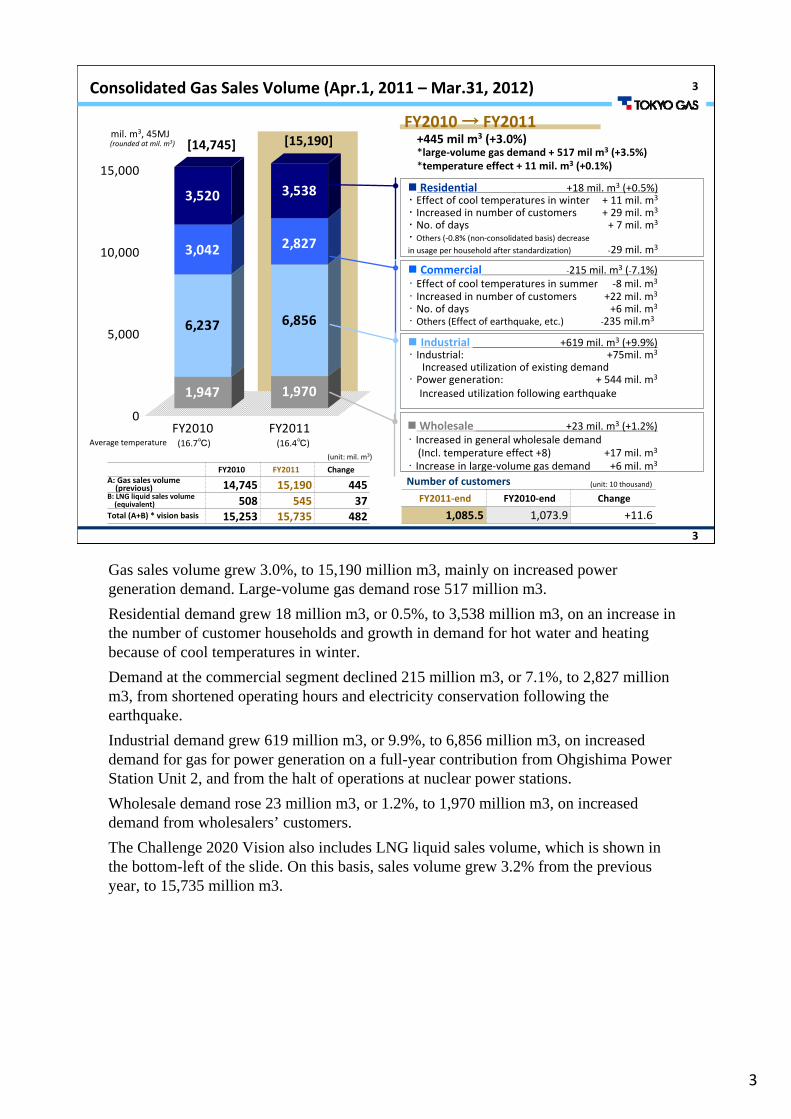
FY2010 → FY2011+445 mil m3 (+3.0%)*large‐volume gas demand + 517 mil m3 (+3.5%)*temperature effect + 11 mil. m3 (+0.1%)
Commercial ‐215 mil. m3 (‐7.1%)・ Effect of cool temperatures in summer ‐8 mil. m3
・ Increased in number of customers +22 mil. m3
・ No. of days +6 mil. m3
・ Others (Effect of earthquake, etc.) ‐235 mil.m3
Industrial +619 mil. m3 (+9.9%)・ Industrial: +75mil. m3
Increased utilization of existing demand・ Power generation: + 544 mil. m3
Increased utilization following earthquake
Residential +18 mil. m3 (+0.5%)・ Effect of cool temperatures in winter + 11 mil. m3
・ Increased in number of customers + 29 mil. m3
・ No. of days + 7 mil. m3
・ Others (‐0.8% (non‐consolidated basis) decrease in usage per household after standardization) ‐29 mil. m3
Wholesale +23 mil. m3 (+1.2%)・ Increased in general wholesale demand(Incl. temperature effect +8) +17 mil. m3
・ Increase in large‐volume gas demand +6 mil. m3FY2010 FY2011 Change
A: Gas sales volume (previous) 14,745 15,190 445
B: LNG liquid sales volume (equivalent) 508 545 37
Total (A+B) * vision basis 15,253 15,735 482
Number of customers
FY2011‐end FY2010‐end Change
1,085.5 1,073.9 +11.6
(unit: 10 thousand)
[14,745] [15,190]
(16.7℃) (16.4℃)Average temperature
(unit: mil. m3)
Gas sales volume grew 3.0%, to 15,190 million m3, mainly on increased power generation demand. Large-volume gas demand rose 517 million m3.Residential demand grew 18 million m3, or 0.5%, to 3,538 million m3, on an increase in the number of customer households and growth in demand for hot water and heating because of cool temperatures in winter.Demand at the commercial segment declined 215 million m3, or 7.1%, to 2,827 million m3, from shortened operating hours and electricity conservation following the earthquake.Industrial demand grew 619 million m3, or 9.9%, to 6,856 million m3, on increased demand for gas for power generation on a full-year contribution from Ohgishima Power Station Unit 2, and from the halt of operations at nuclear power stations.Wholesale demand rose 23 million m3, or 1.2%, to 1,970 million m3, on increased demand from wholesalers’ customers.The Challenge 2020 Vision also includes LNG liquid sales volume, which is shown in the bottom-left of the slide. On this basis, sales volume grew 3.2% from the previous year, to 15,735 million m3.
4
4Changes in Composition of Gas Sales Volume (Apr.1, 2011 – Mar.31, 2012)
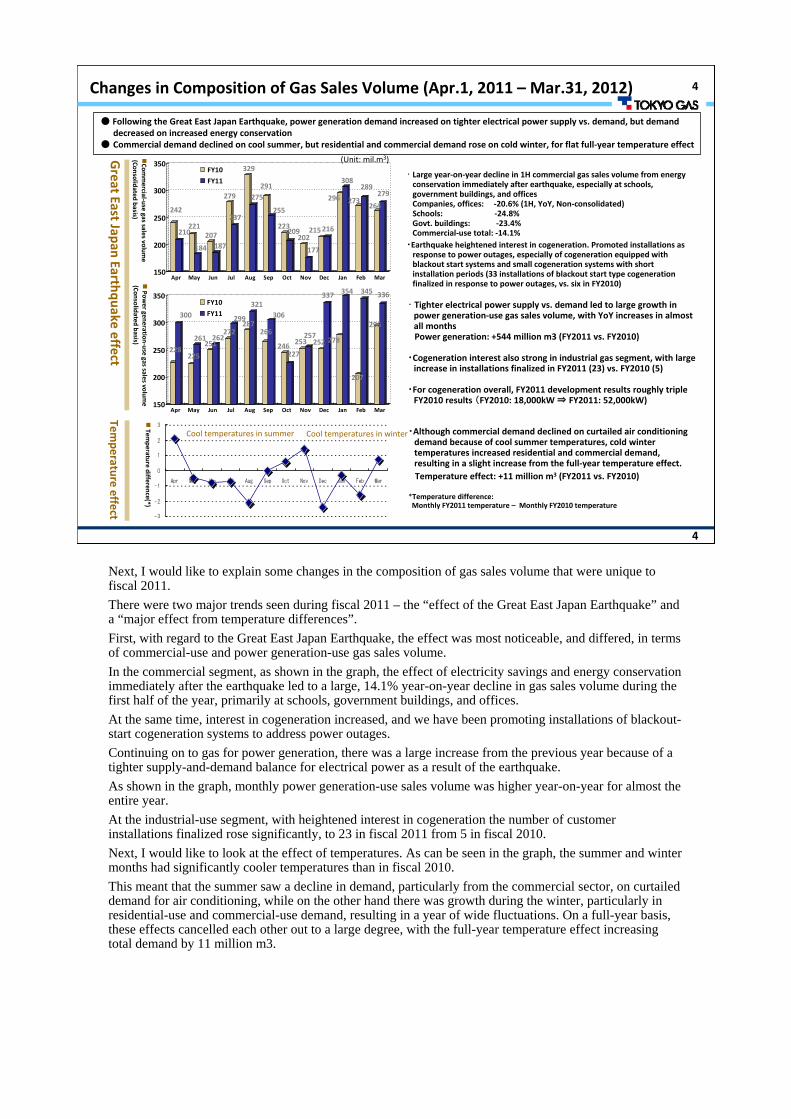
● Following the Great East Japan Earthquake, power generation demand increased on tighter electrical power supply vs. demand, but demand decreased on increased energy conservation
● Commercial demand declined on cool summer, but residential and commercial demand rose on cold winter, for flat full‐year temperature effect
242
210221
184
207187
279
237
329
275291
255
223209
202
177
215216
296
308
273
289
264
279
150
200
250
300
350
Apr May Jun Jul Aug Sep Oct Nov Dec Jan Feb Mar
FY10
FY11
228
300
225
261251262
272
299287
321
266
306
246227
253257
252
337
278
354
207
345
296
336
150
200
250
300
350
Apr May Jun Jul Aug Sep Oct Nov Dec Jan Feb Mar
FY10
FY11
Great East Japan Earthquake effect
・ Large year‐on‐year decline in 1H commercial gas sales volume from energy conservation immediately after earthquake, especially at schools, government buildings, and officesCompanies, offices: ‐20.6% (1H, YoY, Non‐consolidated)Schools: ‐24.8%Govt. buildings: ‐23.4%Commercial‐use total: ‐14.1%
・Earthquake heightened interest in cogeneration. Promoted installations as response to power outages, especially of cogeneration equipped with blackout start systems and small cogeneration systems with shortinstallation periods (33 installations of blackout start type cogeneration finalized in response to power outages, vs. six in FY2010)
Temperature effect
・ Tighter electrical power supply vs. demand led to large growth in power generation‐use gas sales volume, with YoY increases in almost all months Power generation: +544 million m3 (FY2011 vs. FY2010)
・Cogeneration interest also strong in industrial gas segment, with large increase in installations finalized in FY2011 (23) vs. FY2010 (5)
・For cogeneration overall, FY2011 development results roughly triple FY2010 results (FY2010: 18,000kW ⇒ FY2011: 52,000kW)
Commercial‐use gas sales volum
e(Consolidated basis)
Power generation‐use gas sales volum
e(Consolidated basis)
-3
-2
-1
0
1
2
3
Apr May Jun Jul Aug Sep Oct Nov Dec Jan Feb Mar
Temperature difference(*)
(Unit: mil.m3)
・Although commercial demand declined on curtailed air conditioning demand because of cool summer temperatures, cold winter temperatures increased residential and commercial demand, resulting in a slight increase from the full‐year temperature effect.Temperature effect: +11 million m3 (FY2011 vs. FY2010)
*Temperature difference: Monthly FY2011 temperature – Monthly FY2010 temperature
Cool temperatures in summer Cool temperatures in winter
Next, I would like to explain some changes in the composition of gas sales volume that were unique to fiscal 2011.There were two major trends seen during fiscal 2011 – the “effect of the Great East Japan Earthquake” and a “major effect from temperature differences”.First, with regard to the Great East Japan Earthquake, the effect was most noticeable, and differed, in terms of commercial-use and power generation-use gas sales volume.In the commercial segment, as shown in the graph, the effect of electricity savings and energy conservation immediately after the earthquake led to a large, 14.1% year-on-year decline in gas sales volume during the first half of the year, primarily at schools, government buildings, and offices.At the same time, interest in cogeneration increased, and we have been promoting installations of blackout-start cogeneration systems to address power outages.Continuing on to gas for power generation, there was a large increase from the previous year because of a tighter supply-and-demand balance for electrical power as a result of the earthquake.As shown in the graph, monthly power generation-use sales volume was higher year-on-year for almost the entire year.At the industrial-use segment, with heightened interest in cogeneration the number of customer installations finalized rose significantly, to 23 in fiscal 2011 from 5 in fiscal 2010.Next, I would like to look at the effect of temperatures. As can be seen in the graph, the summer and winter months had significantly cooler temperatures than in fiscal 2010.This meant that the summer saw a decline in demand, particularly from the commercial sector, on curtailed demand for air conditioning, while on the other hand there was growth during the winter, particularly in residential-use and commercial-use demand, resulting in a year of wide fluctuations. On a full-year basis, these effects cancelled each other out to a large degree, with the full-year temperature effect increasing total demand by 11 million m3.

5
5
5Returns to Shareholders
Returns to shareholders meet 60% total payout ratio policy
FY2010:¥58.1 billion → FY2011:¥28.3 billion
Maintaining 60% total payout ratio
Calculation
Total payout ratio61.4%
=
FY2011Dividend
¥23.3 billion
FY2012Purchase of
treasury stock¥5.0 billion
FY2011Consolidated net income
¥46.0 billion
+
*Number of shares outstanding:2,590,715,295 (as of March 31, 2012)
(73.5%)(63.3%) (60.9%)(60.1%)Total payout ratio (60.1%) (61.4%)
21.6
39.0
21.3
10.0
21.4
5.0
24.3
7.9
24.1
34.0
23.3
5.0
0
10
20
30
40
50
60
70
FY06 FY07 FY08 FY09 FY10 FY11
Dividend Purchase of treasury stock
Dividend increase8 yen → 9 yen
(billion yen)
【60.6】
【31.2】【26.4】
【32.2】
【58.1】
【28.3】
Change in total payout amount
Dividend increase7 yen → 8 yen
Next, I would like to explain our policy for returns to shareholders, based on fiscal 2011 results.In terms of dividends, we intend to maintain the level of ¥9 per share again this year. Based on our fundamental policy of a total consolidated payout ratio of 60%, in addition to the dividend amount of ¥23.3 billion, we intend to purchase ¥5.0 billion of treasury stock and to cancel these shares soon after acquiring them during fiscal 2012.This would bring the total return to shareholders to ¥28.3 billion, for a planned total payout ratio of 61.4%..

6
6
6
City gas sales increased (+104.5) on higher sales unit prices under the gas rate adjustment system
FY2012 Forecast (Apr. 1, 2012 – Mar. 31, 2013)
:
Highlights Sales growth, profit increase (+/‐ indicates profit impact, billion yen)
(Unit: billion yen)
“Other energy” sales rose on increased LNG sales (+12.0)+Net Sales
City gas expenses rose on higher gas costs (‐89.0)‐Operating Expenses :
“Other energy” expenses rose on increased LNG sales (‐10.2)‐:
Profit and loss from equity method (‐1.5)Non‐operating incomeand expenses
:
(unit: mil. m3・45MJ、billion yen)
FY2012 FY2011 Change %
Gas sales volume 14,886 15,190 ‐304 ‐2.0
Including gas used at electric power business 15,383 15,288 +95 +0.6
Net sales 1,914.0 1,754.2 +159.8 +9.1
Operating expenses 1,815.0 1,677.1 +137.9 +8.2
Operating income 99.0 77.0 +22.0 +28.4
Ordinary income 96.0 75.6 +20.4 +26.9
Net income 63.0 46.0 +17.0 +36.8
Sliding time lag effect (non‐consolidated basis) ‐16.0 ‐47.3 +31.3 ‐Amortization of actuarial differences (non‐consolidated basis) ‐4.0 ‐2.7 ‐1.3 ‐
+:
Reduction in asset impairment losses (+1.1)Extraordinary loss :‐+
Economic
conditions
(Full Year)
JCC($/bbl)
Ex. rate(¥/$)
Avg. temp(℃)
FY12 120.00 85.0 16.7
FY11 114.16 79.1 16.4
Gross margin sensitivity to change in oil price and EX rate
(yearly and quarterly) 1Q 2Q 3Q 4QFull year
$1/bbl Impact on rising JCC 0.1 0.0 ‐0.9 ‐0.3 ‐1.1¥1/$ Impact on yen depreciation ‐0.1 0.2 ‐0.2 ‐1.5 ‐1.6
PensionInvestment yield(costs deducted)
Discount rate
Year‐end assets (billion yen)
FY11 5.13% 1.7% 254FY10 2.70% 2.0% 235
Based on current levels, we have set our crude oil price and exchange rate assumptions for the full year at $120/barrel and ¥85/US dollar.On a financial accounting basis, we are forecasting a 304 million m3, or 2.0%, decline in gas sales volume to 14,886 million m3, because of a planned change in the arrangement under which a portion of the gas sold by Nijio as fuel to electric power producers will be transferred to in-house use for subcontracted electrical power production (a tolling arrangement).With the addition of this gas volume to be used for electric power generation, on a fiscal 2011 basis, our forecast is for an actual increase of 95 million m3, or 0.6%, to 15,383 million m3.With an increase in net sales under the gas rate adjustment system, we are forecasting a ¥159.8 billion, or 9.1%, increase in net sales, to ¥1,914.0 billion.At the same time, we expect resource costs to rise in line with higher crude oil prices, and are forecasting a ¥137.9 billion, or 8.2%, increase in operating expenses, to ¥1,815.0 billion.As a result, we are forecasting a ¥22.0 billion, or 28.4%, increase in operating income to ¥99.0 billion, and a ¥20.4 billion, or 26.9%, increase in ordinary income to ¥96.0 billion. After subtracting corporate income taxes, we are forecasting a ¥17.0 billion, or 36.8%, increase in net income, to ¥63.0 billion.Therefore, out of a ¥22.0 billion increase in operating income, ¥16.0 billion comes from the improvement of gas gross margin, derived from a ¥31.3 billion improvement in slide time lag effect, though gas rate revision has a negative impact of ¥10.2 billion.Please refer to the table at the bottom-left of Slide 6 for operating income sensitivity to changes in our framework assumption for crude oil prices.The investment yield on pension fund assets for fiscal 2011 was 5.13%, which was 3.13 percentage points higher than the anticipated yield of 2.0%, but the discount rate used to calculate the present value of future pension liabilities was 0.3 percentage points lower than in the previous fiscal year, at 1.7%. We therefore calculate that the amortization burden from actuarial differences in pension accounting, as reflected in fiscal 2012 personnel expenses, will be ¥4.0 billion, for a ¥1.3 billion increase from fiscal 2011.
7
7
7
1,970
6,856
2,827
3,538
98
1,965
6,694
2,763
3,464
497
0
3,000
6,000
9,000
12,000
15,000
FY2011 FY2012
Consolidated Gas Sales Volume Forecast Full Year <vs. FY2011>
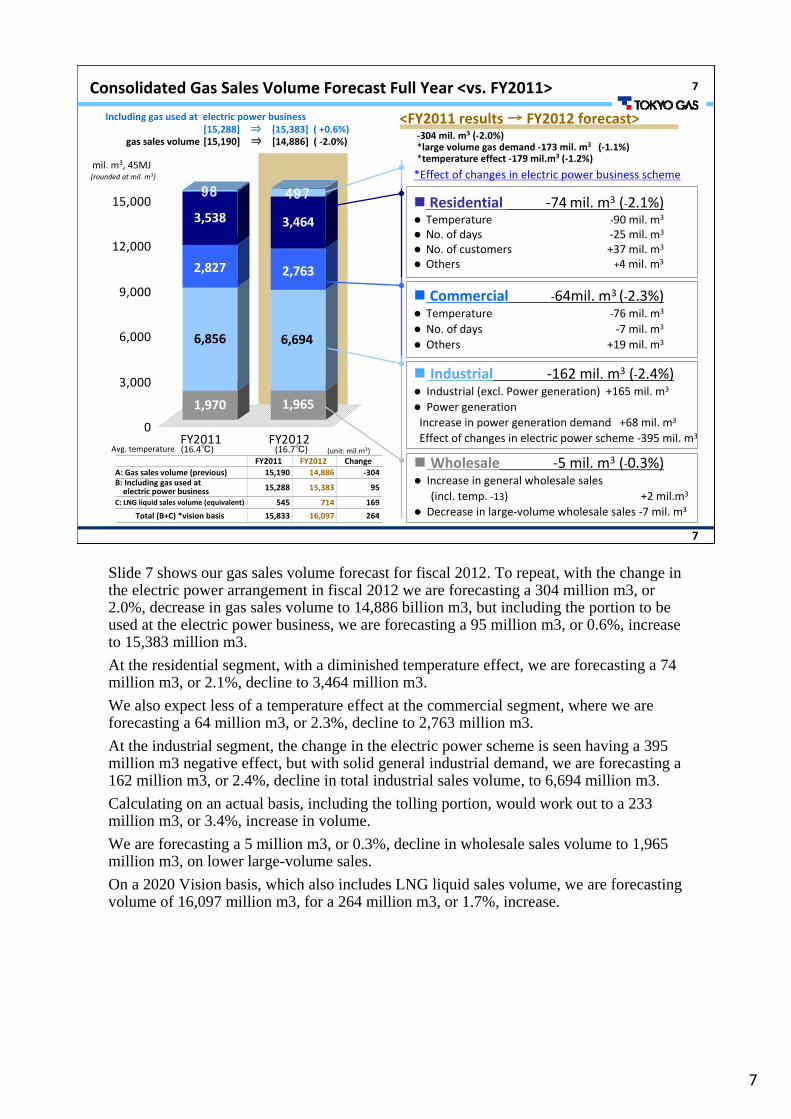
Commercial ‐64mil. m3 (‐2.3%)Temperature ‐76 mil. m3
No. of days ‐7 mil. m3
Others +19 mil. m3
Industrial ‐162 mil. m3 (‐2.4%)Industrial (excl. Power generation) +165 mil. m3
Power generationIncrease in power generation demand +68 mil. m3
Effect of changes in electric power scheme ‐395 mil. m3
Residential ‐74mil. m3 (‐2.1%)Temperature ‐90 mil. m3
No. of days ‐25 mil. m3
No. of customers +37 mil. m3
Others +4 mil. m3
(16.4℃)Avg. temperature (16.7℃)
<FY2011 results → FY2012 forecast>‐304 mil. m3 (‐2.0%)*large volume gas demand ‐173 mil. m3 (‐1.1%)*temperature effect ‐179 mil.m3 (‐1.2%)
Wholesale ‐5 mil. m3 (‐0.3%)Increase in general wholesale sales (incl. temp. ‐13) +2 mil.m3
Decrease in large‐volume wholesale sales ‐7 mil. m3
mil. m3, 45MJ(rounded at mil. m3)
Including gas used at electric power business [15,288] ⇒ [15,383] ( +0.6%)
gas sales volume [15,190] ⇒ [14,886] ( ‐2.0%)
*Effect of changes in electric power business scheme
FY2011 FY2012 ChangeA: Gas sales volume (previous) 15,190 14,886 ‐304B: Including gas used atelectric power business 15,288 15,383 95
C: LNG liquid sales volume (equivalent) 545 714 169
Total (B+C) *vision basis 15,833 16,097 264
(unit: mil.m3)
Slide 7 shows our gas sales volume forecast for fiscal 2012. To repeat, with the change in the electric power arrangement in fiscal 2012 we are forecasting a 304 million m3, or 2.0%, decrease in gas sales volume to 14,886 billion m3, but including the portion to be used at the electric power business, we are forecasting a 95 million m3, or 0.6%, increase to 15,383 million m3.At the residential segment, with a diminished temperature effect, we are forecasting a 74 million m3, or 2.1%, decline to 3,464 million m3.We also expect less of a temperature effect at the commercial segment, where we are forecasting a 64 million m3, or 2.3%, decline to 2,763 million m3.At the industrial segment, the change in the electric power scheme is seen having a 395 million m3 negative effect, but with solid general industrial demand, we are forecasting a 162 million m3, or 2.4%, decline in total industrial sales volume, to 6,694 million m3.Calculating on an actual basis, including the tolling portion, would work out to a 233 million m3, or 3.4%, increase in volume.We are forecasting a 5 million m3, or 0.3%, decline in wholesale sales volume to 1,965 million m3, on lower large-volume sales.On a 2020 Vision basis, which also includes LNG liquid sales volume, we are forecasting volume of 16,097 million m3, for a 264 million m3, or 1.7%, increase.

8
8
8FY2012 Uses of Cash Flow
Capital expenditure
Capex Main items
Tokyo Gas: 139.0(+25.1 , +22.0%)
Production facilities:28.6 (+9.9)Hitachi LNG terminal construction, etc.
Distribution facilities:86.4 (+12.0)Ibaraki‐Tochigi Line installation, New demand‐side pipes and pipelines, etc.
Service and maintenance facilities, etc.:24.0 (+3.3)Systems‐related investment, Tamachi development‐related, etc.
Total of Consolidated Subsidiaries: 52.0
(+19.5 , +60.0%)
Overseas business (Total of Australian subsidiaries 22.9)Renovation of district heating and cooling system, etc. 14.0 (ENAC)
Total 191.0 (+44.6, +30.5% after internal eliminations)
*Numbers in parentheses refer to comparisons with FY2011.
Investments and loans
Returns to shareholders
27.9 (overseas businesses, etc. 33.1, recoveries of loans ‐5.2) (vs. FY11 +21.1)
28.3 ( Maintaining 60% total payout ratio ) (vs. FY11 ‐29.8)(Total of FY11 year‐end dividends, FY12 interim dividends, and FY12 treasury stock purchases)
(Unit: billion yen)
Next, I would like to explain our plan for the use of cash flow in fiscal 2012.Our plan for capital expenditure at Tokyo Gas, on a non-consolidated basis, is for ¥139.0 billion. This represents a ¥25.1 billion, or 22.0%, increase from fiscal 2011.This breaks down as ¥28.6 billion for manufacturing facilities, including the HitachiLNG terminal construction, etc, ¥86.4 billion for supply facilities, including installation of the Ibaraki-Tochigi Line, and ¥24.0 billion service and maintenance facilities, including systems-related investment.We also plan to invest ¥52.0 billion at consolidated subsidiaries, with the largest overseas portion going to gas field development.This brings the consolidated plan for capital expenditure to ¥191.0 billion, for a ¥44.6 billion, or 30.5%, increase from fiscal 2011.Next, our plan for investments and loans is for ¥27.9 billion, primarily at overseas businesses.In terms of returns to shareholders, as I have already mentioned, our plan is to maintain a total payout ratio of 60%, with ¥28.3 billion of dividend payments and treasury stock purchases.

9
9
9FY2012 Funding Plan (Consolidated)
Required Funds and Source of Funds
Required Funds
Capex 191.0
Other investment & financing * 27.9
Dividends & tax 48.7
Share buybacks 5.0
Repayment(Non‐consolidated)
47.0(33.0)
Total 319.6
Source of Funds
Internal funding
Depreciation 140.0
Ordinary income 96.0
Others ‐24.6
Total 211.4
Outside funding(Non‐consolidated)
108.2(110.0)
Total 319.6
Interest‐bearing Debt
End of FY11: 625.8 billion yen End of FY12: 687.0 billion yen
*Other investment & financing is the net amount of investment outlays and loan repayments.The above does not include CP to be issued and redeemed within FY2012 as seasonal working capital.
(Unit: billion yen)
Next, I would like to discuss our funding plan on a consolidated basis.In terms of required funds, we are planning for ¥319.6 billion. In addition to the previously mentioned ¥191.0 billion of capital expenditures, ¥27.9 billion of investments and loans, ¥48.7 billion of dividends and taxes, and ¥5.0 billion for share buybacks, this includes ¥47.0 billion for redemptions of corporate bonds and repayments of borrowings.We plan to procure these funds using ¥211.4 billion of internal funding and ¥108.2 billion of outside funding.Our internal funding is to include ¥140.0 billion from depreciation and ¥96.0 billion of ordinary income.For outside funding, we are planning to procure ¥108.2 billion, and net of the ¥47.0 billion in redemptions and repayments, this will increase our interest-bearing debt outstanding by ¥61.2 billion from the end of fiscal 2011, to a projected ¥687.0 billion at the end of fiscal 2012.

10
10
10
Progress Under 2020 Vision
To this point I have discussed our financial results and outlook for income and expenses, and now I would like to turn to the progress being made under our 2020 Vision announced last year.Today I will discuss the progress made toward LNG value chain enhancement over the past half-year in the three areas of “Overseas business and gas resource procurement,”“Production and Distribution,” and “Energy Solution.”

11
11
11(1) Overseas business and gas resource procurement
1. Overseas business
2.Gas resource procurement
(1) Comprehensive Memorandum of Understanding for cooperation concluded with Petrovietnam Gas (cooperation in establishing LNG value chain in Vietnam)
・ TGE received order for FEED (Front‐End Engineering and Design) of LNG receiving terminal in Vietnam【 Terminal capacity: One 100,000 kl LNG tank; scheduled completion in 2015 】
(2) ENAC to conduct feasibility study for installation of electric power and heating supply system in redevelopment zone in Thailand
*In addition, we are beginning negotiations for LNG procurement from the Cove Point LNG Project in the United States, with the aim of importing LNG sourced from natural gas produced in the United States, including shale gas, to Japan.
LNG project Contracted volume, scheduled port entry
Pluto 1.50‐1.75 million tons p.a., 2012
Gorgon 1.10 million tons p.a., 2014
Queensland Curtis 1.20 million tons p.a., 2015
LNG sale and purchase contract concluded for participation in Ichthys LNG Project
1.05 million tons p.a., 2017
Heads of agreement concluded for extension of LNG sale and purchase contract for Brunei LNG project
1.00 million tons p.a., April, 2013 ~
First, I will discuss the concrete progress made in the area of reducing raw material prices and expanding overseas business.In terms of overseas business, we have concluded a Comprehensive Memorandum of Understanding for cooperation with Petrovietnam Gas, and our consolidated subsidiary ENAC has reached an agreement to conduct a feasibility study for the installation of an electric power and heating supply system in a redevelopment zone in Thailand.In terms of gas resource procurement, steady progress is being made in the Pluto, Gorgon, and Queensland Curtis projects for new LNG procurement. In addition, we have concluded an LNG sale and purchase contract for participation in the Ichthys LNG Project, as well as a heads of agreement for the extension of our LNG sale and purchase contract for an LNG project in Brunei.We are also beginning negotiations for LNG procurement from the Cove Point LNG Project in the United States, with the aim of importing LNG sourced from natural gas produced in the United States, including shale gas, to Japan.
12
12
12(2) Production ・Distribution
1. Production
2. Distribution
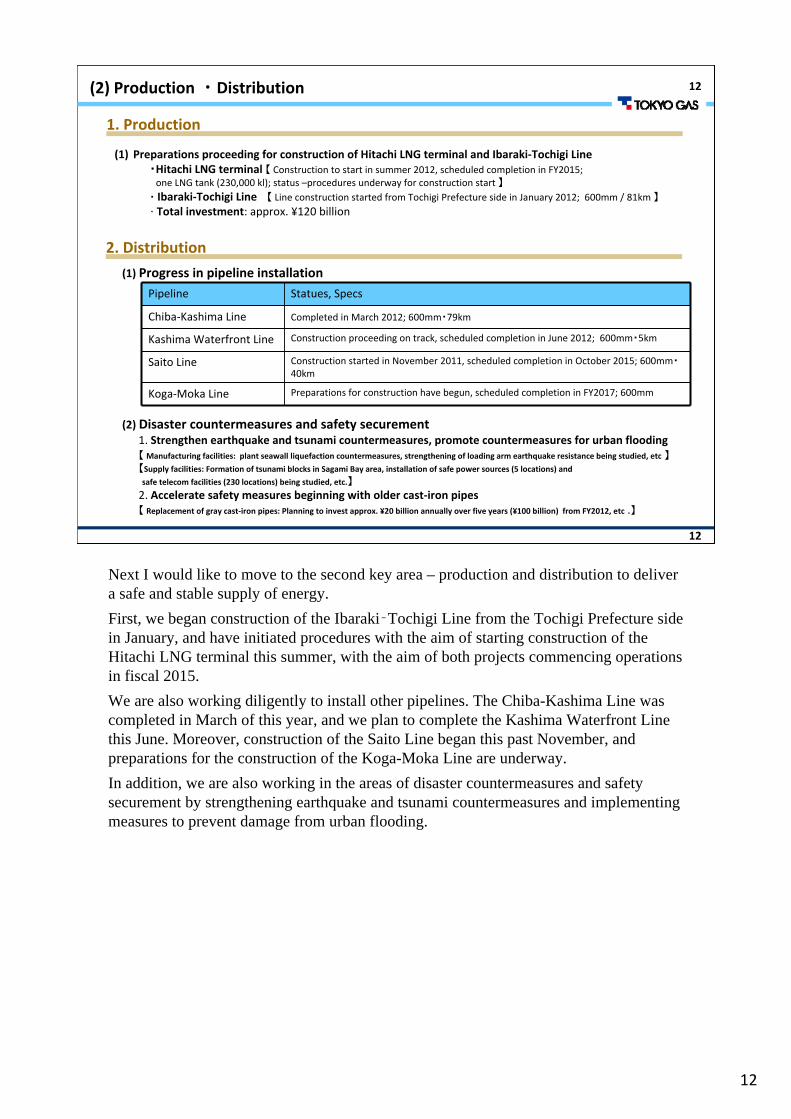
(1) Preparations proceeding for construction of Hitachi LNG terminal and Ibaraki‐Tochigi Line・Hitachi LNG terminal 【 Construction to start in summer 2012, scheduled completion in FY2015; one LNG tank (230,000 kl); status –procedures underway for construction start 】
・ Ibaraki‐Tochigi Line 【 Line construction started from Tochigi Prefecture side in January 2012; 600mm / 81km 】・ Total investment: approx. ¥120 billion
(1) Progress in pipeline installation
(2) Disaster countermeasures and safety securement1. Strengthen earthquake and tsunami countermeasures, promote countermeasures for urban flooding【 Manufacturing facilities: plant seawall liquefaction countermeasures, strengthening of loading arm earthquake resistance being studied, etc 】【Supply facilities: Formation of tsunami blocks in Sagami Bay area, installation of safe power sources (5 locations) and
safe telecom facilities (230 locations) being studied, etc.】
2. Accelerate safety measures beginning with older cast‐iron pipes【 Replacement of gray cast‐iron pipes: Planning to invest approx. ¥20 billion annually over five years (¥100 billion) from FY2012, etc .】
Pipeline Statues, Specs
Chiba‐Kashima Line Completed in March 2012; 600mm・79km
Kashima Waterfront Line Construction proceeding on track, scheduled completion in June 2012; 600mm・5km
Saito Line Construction started in November 2011, scheduled completion in October 2015; 600mm・40km
Koga‐Moka Line Preparations for construction have begun, scheduled completion in FY2017; 600mm
Next I would like to move to the second key area – production and distribution to deliver a safe and stable supply of energy.First, we began construction of the Ibaraki‐Tochigi Line from the Tochigi Prefecture side in January, and have initiated procedures with the aim of starting construction of the Hitachi LNG terminal this summer, with the aim of both projects commencing operations in fiscal 2015.We are also working diligently to install other pipelines. The Chiba-Kashima Line was completed in March of this year, and we plan to complete the Kashima Waterfront Line this June. Moreover, construction of the Saito Line began this past November, and preparations for the construction of the Koga-Moka Line are underway. In addition, we are also working in the areas of disaster countermeasures and safety securement by strengthening earthquake and tsunami countermeasures and implementing measures to prevent damage from urban flooding.

13
13
13(3) Energy solution
1.Electric power
2.Spread and expand use of distributed energy systems and gas air conditioning
(1) Considering Ohgishima Power Station Unit 3
Have already completed environmental assessment procedures and begun to consider Ohgishima Power Station Unit 3, which would be able to make fastest contribution to stable and efficient supply of electricity. Anticipated schedule is to decide on construction around fall 2012, with operations to commence in FY2015.
・Spread and expand use of distributed energy systems and gas air conditioning, which contribute to peak saving, energy conservation, and CO2 emissions reduction.
3.Conclusion of LNG sale and purchase contract with Saibu Gas
・Estimating approximately 300,000 tons p.a. for 16 years from FY2014・To be delivered to Hibiki LNG terminal currently being built by Saibu Gas (two 180,000 kl LNG tanks; Kitakyushu City)
Contents
ENE‐FARM 5,700 units in FY2011 ⇒ plan for 7,100 units in FY2012
Cogeneration FY2012: plan for 10% increase from end‐FY2011 total
Gas air conditioning In addition to addressing need for electricity conservation, introduce GHP (Excel Plus) equipped with blackout start system in FY2012 as power outage countermeasure
Now I will move on to the third area – providing energy solutions adapted to a variety of customer needs.We have begun studying the expansion of the electric power business with an OhgishimaPower Station Unit 3. The anticipated schedule is to make a decision regarding construction sometime this fall, with the aim of commencing operations during fiscal 2015.With regard to spreading and expanding the use of distributed energy systems and gas air conditioning, we are aiming to sell 7,100 ENE-FARM units during fiscal 2012. We also plan to increase the total number of gas cogeneration systems by 10% from the end of fiscal 2011.As a specific example of how we are working to spread and expand the use of natural gas nationwide, we have concluded an LNG sale and purchase agreement with Saibu Gas, under which we will deliver approximately 300,000 tons annually for 16 years from fiscal 2014.

14
14
14(3) Energy solution
4. Developing demand in line with the commencement of Chiba‐Kashima Line
5. Promoting Smart Energy
・Estimated FY2012 sales volume: approx. 300 million m3 p. a.
・Estimating future sales volume of up to approximately 2 billion m3 p.a.
6. LIFEVAL
(2)Starting some construction of Smart Energy network in north block of Tamachi Station, East Exit(Japan’s first Smart Energy network in urban redevelopment area)
・Strengthening individual support to (43) LIFEVAL companies⇒ Accelerate building of locally focused marketing structure to strengthen ties with
customers through all business opportunities
(1)Beginning demonstration testing of multiple‐dwelling version of Smart House at company housing in Isogo
In terms of promoting the advanced utilization of natural gas and fuel conversion, the Chiba-Kashima Line that I just mentioned is seen developing approximately 300 million m3 of demand in fiscal 2012, and in the future we expect this line to develop up to 2 billion m3 of demand.In the area of promoting Smart Energy, we have begun demonstration testing of a multiple-dwelling version of Smart House at a company housing in Isogo, Yokohama, and started some construction of a Smart Energy network in the north block of TamachiStation, east exit.These are some of the specific measures and projects being implemented in various areas toward the realization of the Challenge 2020 Vision.This concludes my presentation. Thank you for paying kind attention to my presentation.

15
15
15
Business Overview (Detailed Analysis)

16
16
16FY2011 Net sales and Operating income/loss by Business Segment
Net Sales Operating IncomeFY2011 FY2010 FY2011 FY2010
Results Change % Results Results Change % Results
City gas 1,306.2 169.2 14.9 1,137.0 97.4 ‐38.7 ‐28.5 136.1
Gas appliances and
installation work187.6 10.2 5.7 177.4 3.1 1.3 67.2 1.8
Other energy 302.5 81.3 36.7 221.2 10.9 ‐0.2 ‐2.2 11.1
(electric power) 101.8 31.6 45.0 70.2 7.9 1.9 30.7 6.0
Real estate rental 29.6 ‐3.1 ‐9.5 32.7 3.3 ‐2.4 ‐42.2 5.7
Others 181.8 19.5 12.1 162.3 7.0 ‐2.9 ‐28.7 9.9
Adjustments ‐253.7 ‐58.1 ‐ ‐195.6 ‐44.7 ‐2.4 ‐ ‐42.3
Consolidated 1,754.2 219.0 14.3 1,535.2 77.0 ‐45.4 ‐37.1 122.4
• Net sales by business segment include internal transactions.• Other Energy includes Energy‐service, Electric Power, LPG, Industrial gas, etc.• Other includes Construction & Engineering, System Engineering, Shipping, Credit & Lease, etc.• Adjustments under operating income are primarily companywide expenses that cannot be allocated to individual segments.
Notes:
<year on year>(Unit: billion yen)

17
17
17Gross Margin Sensitivity to Changes in Oil Price and Exchange Rate
Impact of rising JCC by $1/bbl
Impact on earnings
1Q 2Q 3Q 4Q Full Year
Period
1Q ‐0.3 ‐0.4 0.5 0.3 0.1
2Q ‐0.2 ‐0.5 0.7 0.0
3Q ‐0.3 ‐0.6 ‐0.9
4Q ‐0.3 ‐0.3
Total ‐0.3 ‐0.6 ‐0.3 0.1 ‐1.1
Impact of yen depreciation by ¥1/$
Impact on earnings
1Q 2Q 3Q 4Q Full Year
Period
1Q ‐1.1 0.8 0.2 0.0 ‐0.1
2Q ‐1.1 0.9 0.4 0.2
3Q ‐1.2 1.0 ‐0.2
4Q ‐1.5 ‐1.5
Total ‐1.1 ‐0.3 ‐0.1 ‐0.1 ‐1.6
(Non‐consolidated basis)
(Unit: billion yen)
(Unit: billion yen)

18
18
18Transition of Industrial‐use Gas Sales Volume (quarterly)
Consolidated
mil. m3, 45MJ/m3
624
865
601
905
596
823
482
727
518
677
589
774
550
826
626
886
704
775
824
783
752
793
781
825
823
778
924
833
823
779
1035
861
0
300
600
900
1,200
1,500
1,800
FY081Q
FY082Q
FY083Q
FY084Q
FY091Q
FY092Q
FY093Q
FY094Q
FY101Q
FY102Q
FY103Q
FY104Q
FY111Q
FY112Q
FY113Q
FY114Q
Industrial
Power generation
[1,489] [1,506][1,419]
[1,209][1,195]
[1,364] [1,377]
[1,511][1,480]
[1,606][1,601]
FY2008FY2008 FY2009FY2009 FY2010FY2010 FY2011FY2011
[1,601][1,607]
[1,896][1, 757]
[1,544]

19
19
19FY2011 Ordinary Income Analysis <vs. FY2010>
TG‐39.2
Decrease in gas gross margin (sliding time lag effect ‐18.1) ‐20.8Net Sales: +144.9(Gas sales volume & composition +17.0 , Sliding time lag +131.4 , Others ‐3.5)
Gas resource costs: ‐165.7(Amount & composition ‐15.4 , Foreign exchange+54.7 , JCC‐161.6 , Others ‐43.4)
Change‐45.9
FY2010
121.5
FY2010
121.5
Note: ( + ) & ( ‐ ) refer to contributions to income.
FY2011
75.6
FY2011
75.6
Subsidiaries‐8.8
Consolidatedadjustments
+2.1
Increase in fixed costs ‐20.6General expenses decreased: +0.9
(Decrease in advertising and other costs to develop demand +4.3・ Consignment costs ‐2.1 ,etc)
Personal expenses increased on pension actuarial difference : ‐22.0(Actuarial differences +19.9 →‐2.7)
Depreciation and amortization : ±0
Increase in other operation/ supplementary income +4.0Appliance sales +1 , Installation work +3 , Electric power +37 and others
non‐operating income decreased ‐1.7( + ) Advanced repayments and settlements +2.4 ,
Foreign exchange gain and loss +1.6(‐1.3 →+0.3)
( ‐ ) Financial balance ‐3.4(+4.8 → + 1.3 ) ,Decreased gain on weather derivatives ‐0.9(+1.0→ +0.1)
( ‐ ) Australian subsidiaries ‐4.7〔foreign exchange effect ‐2.8 (+2.2 → ‐0.6)〕Tokyo Gas Urban Development ‐1.2 〔Profit decline from rent revisions〕Energy advance ‐0.6 (Regional energy services profit decline)Vessel ‐0.6 (Profit decline from freight rate revisions)
Eliminations of dividends income +1.0
Economic conditions FY2011 JCC 114.16 $/bbl Ex. rate ¥79.08 /$FY2010FY2010 原油 84.15 $/bbl 為替 ¥85.74 /$
(Unit: billion yen)

20
20
1,988
6,221
2,931
3,486
1,970
6,856
2,827
3,538
0
5,000
10,000
15,000
FY2011 plan FY2011
Consolidated Gas Sales Volume (Apr.1, 2011 – Mar.31, 2012)(vs. FY2011 initial plan)
[14,624] [15,190]
FY2011: initial plan → FY2011566 mil. m3 (+3.9%)[incl. large-volume gas demand + 581 mil. m3 (+4.0%)][incl. temperature effect + 172 mil. m3 (+1.2%)]
Commercial ‐104 mil. m3 (‐3.5%)・ Cool temperatures in winter +72 mil. m3
・ No. of days +15 mil. m3
・ Others ‐191 mil. m3
Industrial +635mil. m3 (+10.2%)・ Industrial: ‐8 mil. m3
decreased utilization of existing demand, etc.・ Power generation: + 643 mil. m3
Increased utilization following earthquake
Residential +52 mil. m3 (+1.5%)・ Cool temperatures in winter + 89 mil. m3
・ Temporary decreased in no. of customers households ‐10 mil. m3
・ No. of days ‐5 mil. m3
・ Others (‐0.6% (non‐consolidated basis) decrease in usage per household after standardization) ‐22 mil. m3
Wholesale ‐18mil. m3 (‐0.9%)・ Increased in general wholesale demand (incl. temperature effect +11) ‐33 mil. m3
・ Increase in large‐volume gas demand +15 mil. m3
Number of customers
FY2012‐end FY2011‐end plan Change
1,055.7 1,055.2 +0.5
(16.7℃) (16.4℃)Average temperature
mil. m3, 45MJ(rounded at mil. m3)
(unit: 10 thousand)

21
21
21FY2011 Ordinary Income Analysis<vs. FY2011 Plan> (Apr. 28 release)
TG+21.9
Increase in gas gross margin (Sliding time lag effect +8.6) +6.7Net sales: ‐23.5(Gas sales volume & composition +21.6 , Sliding time lag ‐46.0 , Others +0.9)
Gas resource costs: +30.2(Amount & composition -21.8 , Foreign exchange +50.7 , JCC +5.7 , Others -4.4)
Change+23.6
FY2011(plan)
52.0
FY2011(plan)
52.0
FY2011
75.6
FY2011
75.6
Subsidiaries+3.3
Consolidated adjustments
‐1.6
Increase in fixed costs ‐0.5General expenses increased: ‐1.8
(increase in repairment cost ‐3.1 , decrease in demand development‐related +1.1 , etc.)
Personal expense increased: ‐0.6(Difference from second employees, etc.)
Depreciation and amortization decreased: +1.3 and others
Increase in other operation/supplementary income +12.3Appliance sales +1.3 , Installation work +0.4 , Electric Power +9.6 and others
Increase in non‐operating income +3.5( + ) Increase in advance repayments and settlements +2.4 ,
( + ) Tanker +2.5(Expense decreased), engineering +1.5 (Sales increased)( ‐ ) Nijio ‐2.9 (Cost increased)
Eliminations of dividends income ‐1.0Economic conditions FY2011 JCC 114.16 $/bbl Ex. rate ¥79.08 /$
FY2011 plan 原 116.25 $/bbl 為替 ¥85.00 /$Note: ( + ) & ( ‐ ) refer to contributions to income.
(Unit: billion yen)
22
22
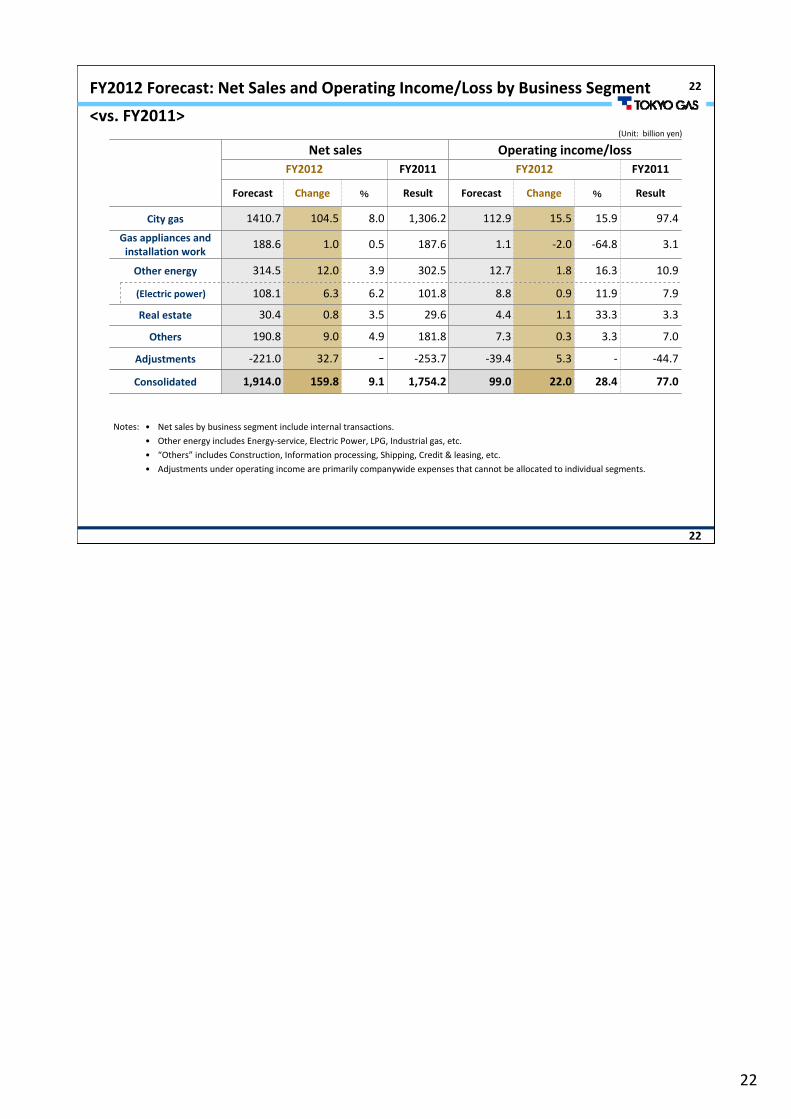
22FY2012 Forecast: Net Sales and Operating Income/Loss by Business Segment
Net sales Operating income/lossFY2012 FY2011 FY2012 FY2011
Forecast Change % Result Forecast Change % Result
City gas 1410.7 104.5 8.0 1,306.2 112.9 15.5 15.9 97.4
Gas appliances and installation work
188.6 1.0 0.5 187.6 1.1 ‐2.0 ‐64.8 3.1
Other energy 314.5 12.0 3.9 302.5 12.7 1.8 16.3 10.9
(Electric power) 108.1 6.3 6.2 101.8 8.8 0.9 11.9 7.9
Real estate 30.4 0.8 3.5 29.6 4.4 1.1 33.3 3.3
Others 190.8 9.0 4.9 181.8 7.3 0.3 3.3 7.0
Adjustments ‐221.0 32.7 ー ‐253.7 ‐39.4 5.3 ‐ ‐44.7
Consolidated 1,914.0 159.8 9.1 1,754.2 99.0 22.0 28.4 77.0
Notes: • Net sales by business segment include internal transactions.
• Other energy includes Energy‐service, Electric Power, LPG, Industrial gas, etc.
• “Others” includes Construction, Information processing, Shipping, Credit & leasing, etc.
• Adjustments under operating income are primarily companywide expenses that cannot be allocated to individual segments.
<vs. FY2011>(Unit: billion yen)

23
23
23FY2012 Forecast: Ordinary Income Analysis <vs. FY2011>
TG+15.1
Increase in gas gross margin (sliding time lag effect 31.3) +18.0Net sales: +119.5(Gas sales volume & composition +3.4 , Sliding time lag +129.0 ,Gas tariff revisions, etc ‐12.9)
Gas resource costs: ‐101.5(Amount & composition ‐3.1 , Foreign exchange ‐51.5 , JCC ‐51.3 , Others +4.4)
Change+20.4
FY2011
75.6
FY2011
75.6
Note: ( + ) & ( ‐ ) refer to contributions to income.
FY2012(forecast)
96.0
FY2012(forecast)
96.0
Subsidiaries+0.1
Consolidated adjustments
+5.2
Decrease in fixed costs +4.7General expenses increased: ‐0.6
(Repairment cost +2.4 , taxes increased ‐1.8 , Consignment costs ‐1.0, etc.)
Personal expenses decreased on pension actuarial difference: +0.2
Depreciation and amortization decreased: +5.0 and others
(effect of tax code revisions +11.8 , Increased depreciation from acquisition ‐6.8 )
Decrease in other operation/supplementary income ‐2.2Appliance sales ‐1.4 , Electric power ‐1.2 and others
Decrease in non‐operating income ‐5.5( ‐ ) Decreased in advance repayments and settlements ‐2.4 , decrease in affiliated
company dividends received ‐2.1 and others
( + ) Nijio +0.9 (Sales increased)
( ‐ ) Tanker ‐0.7 (Cost increased)
Elimination of dividends received +5.1
Economic conditions FY2012 forecast JCC 120.00 $/bbl Ex. rate ¥85.00 /$経済フレーム FY2011 6 114.16 $/bbl 為替 ¥79.08 /$
(Unit: billion yen)
24
24
24
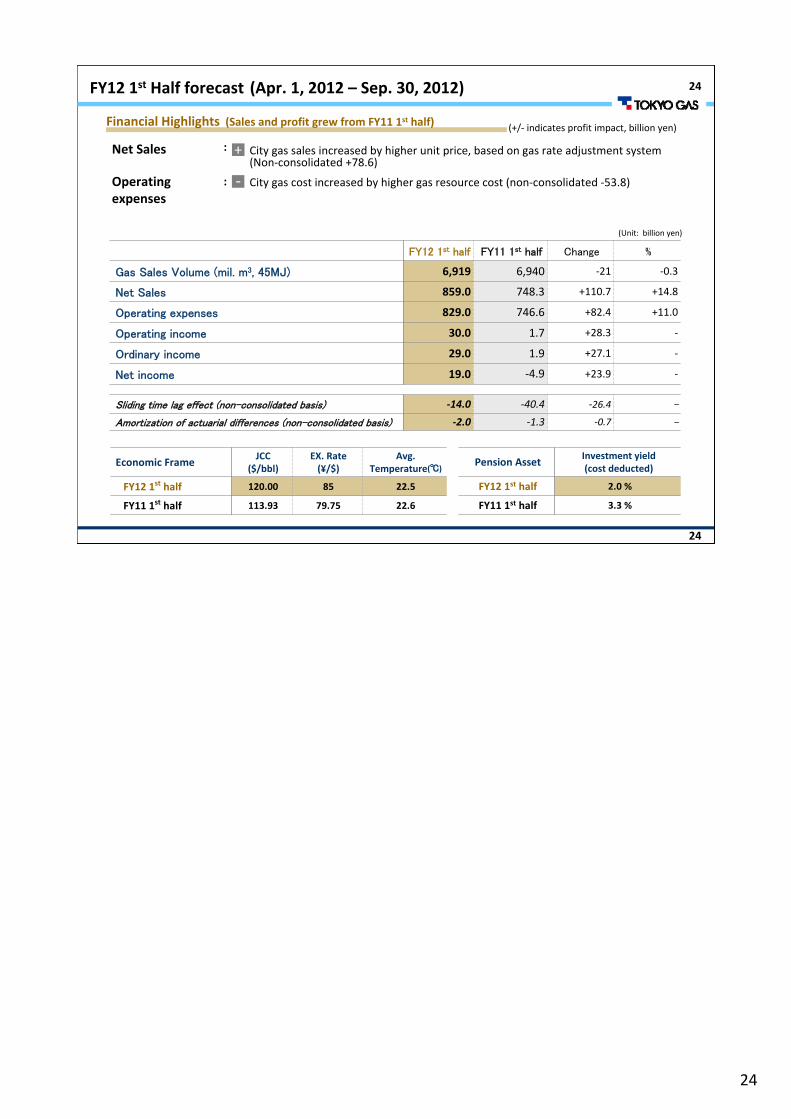
FY12 1st half FY11 1st half Change %
Gas Sales Volume (mil. m3, 45MJ) 6,919 6,940 ‐21 ‐0.3
Net Sales 859.0 748.3 +110.7 +14.8
Operating expenses 829.0 746.6 +82.4 +11.0
Operating income 30.0 1.7 +28.3 ‐
Ordinary income 29.0 1.9 +27.1 ‐
Net income 19.0 ‐4.9 +23.9 ‐
Sliding time lag effect (non-consolidated basis) ‐14.0 ‐40.4 ‐26.4 -
Amortization of actuarial differences (non-consolidated basis) ‐2.0 ‐1.3 ‐0.7 -
Economic FrameJCC
($/bbl)EX. Rate (¥/$)
Avg. Temperature(℃)
FY12 1st half 120.00 85 22.5
FY11 1st half 113.93 79.75 22.6
Pension AssetInvestment yield(cost deducted)
FY12 1st half 2.0 %
FY11 1st half 3.3 %
FY12 1st Half forecast (Apr. 1, 2012 – Sep. 30, 2012)
City gas sales increased by higher unit price, based on gas rate adjustment system+Net Sales :
Financial Highlights (Sales and profit grew from FY11 1st half) (+/‐ indicates profit impact, billion yen)
City gas cost increased by higher gas resource cost (non‐consolidated ‐53.8)Operating expenses
: ‐
(Unit: billion yen)
(Non‐consolidated +78.6)

25
25
25Key Indices
Notes: Shareholders’ equity = Net assets – Minority interestsROA = Net income / Total assets ( average of the amounts as of the end of the previous term and end of the current term)ROE = Net income / Shareholders’ equity (average of the amounts as of the end of the previous term and end of the current term)Balance sheet figures are as of the corresponding term‐endOperating cash flow = Net income + Depreciation and amortization (including amortization of long‐term prepaid expenses)Total payout ratio = (FYn dividends + (FYn+1) treasury stock purchased) / FYn consolidated net income*Total number of shares issued: 2,590,715,295 (As of March 31, 2012)※To be maintained at approximately 60% each year to FY2020
FY2010 FY2011FY2012
Full year forecast
Total assets (a) 1,829.6 1,863.8 1,948.0Shareholders’ equity (b) 858.9 839.1 874.0Shareholders’ equity ratio (b)/(a) 46.9% 45.0 % 44.9%Interest‐bearing debt (c) 584.1 625.8 687.0D/E Ratio (c)/(b) 0.68 0.75 0.79Net income (d) 95.4 46.0 63.0Depreciation and amortization (e) 149.3 148.5 140.0Operating cash flow (d) + (e) 244.8 194.5 203.0Capex 150.2 146.4 191.0ROA: (d) / (a) 5.2% 2.5% 3.3%ROE: (d) / (b) 11.4% 5.4% 7.4%TEP 64.0 9.1 21.8WACC 3.2% 3.1% 3.1%Total Payout Ratio 60.9% 61.4% ー(※)
(Unit: billion yen)

26
26
26
26
26
TSE:9531
< Cautionary Statement regarding Forward‐looking Statements >Statements made in this presentation with respect to Tokyo Gas’s present plans, forecasts, strategies and beliefs, and other statements herein that are not expressions of historical fact are forward‐looking statements about the future performance of the Company. As such, they are based on management‘s assumptions and opinions stemming from currently available information and therefore involve risks and uncertainties. The Company’s actual performance may greatly differ from these projections, due to these risks and uncertainties which include without limitation general economic conditions in Japan, crude oil prices, the weather, changes in the foreign exchange rate of the yen, rapid technological innovations and the Company’s responses to the progress of deregulation.