Embed Size (px)
Citation preview

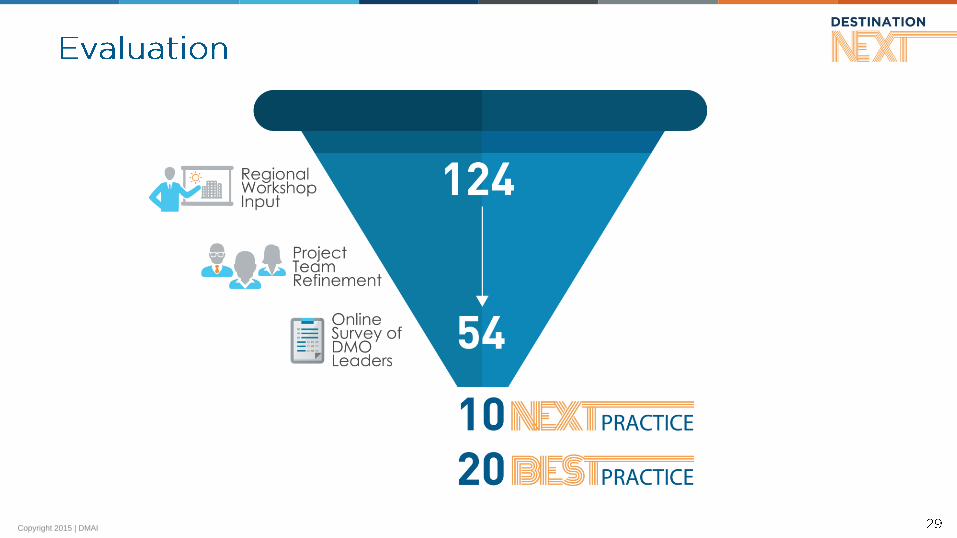
Phase 1
Futures Study

Copyright 2015 | DMAI

Copyright 2015 | DMAI

Copyright 2015 | DMAI
Copyright 2015 | DMAI

Copyright 2015 | DMAI
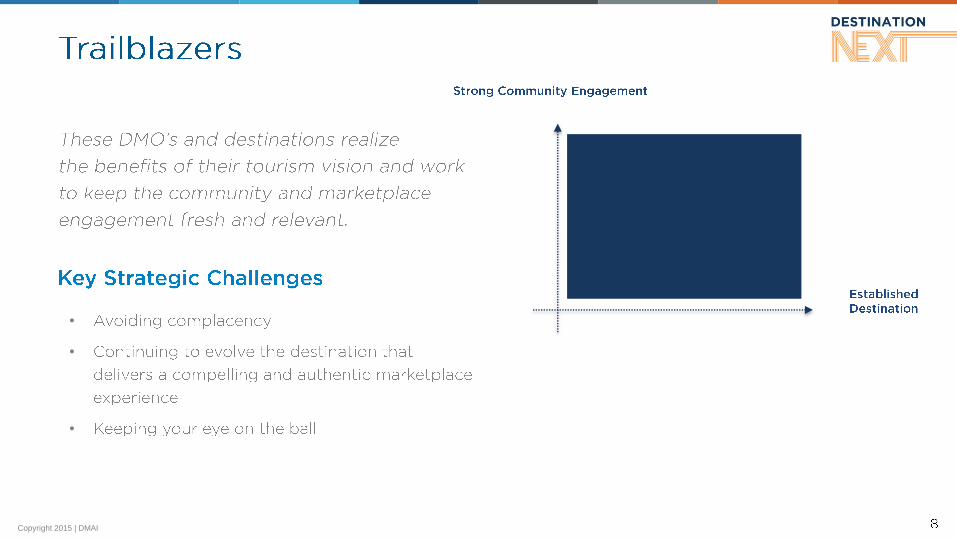
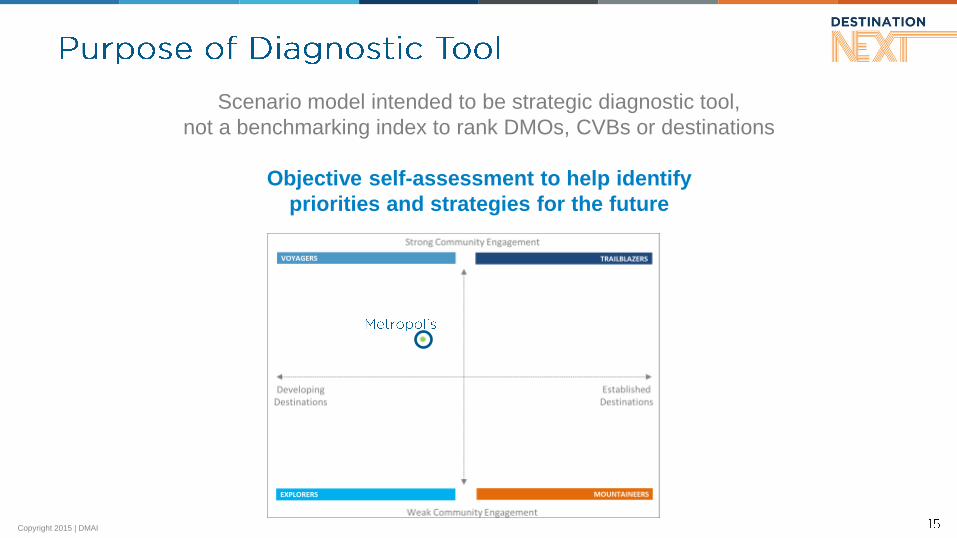
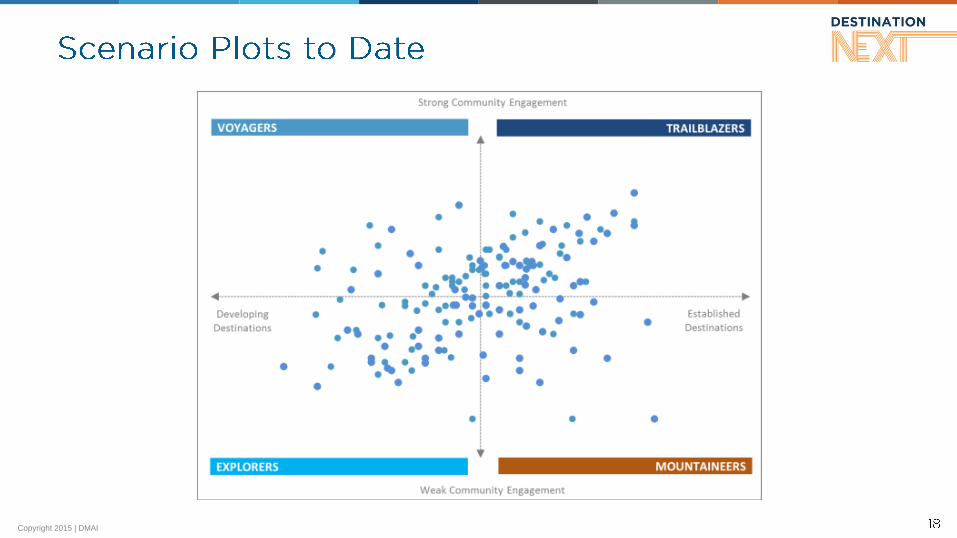
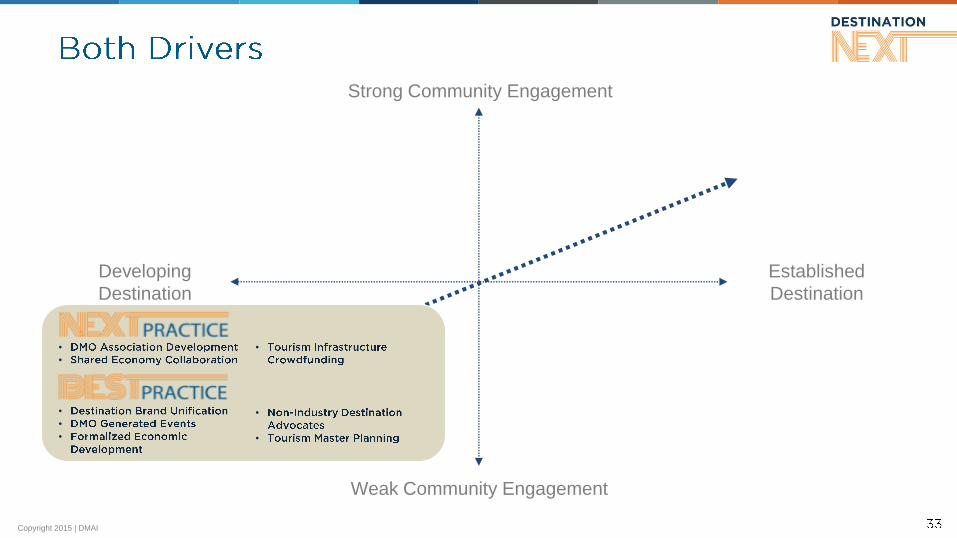
Strong Community Engagement
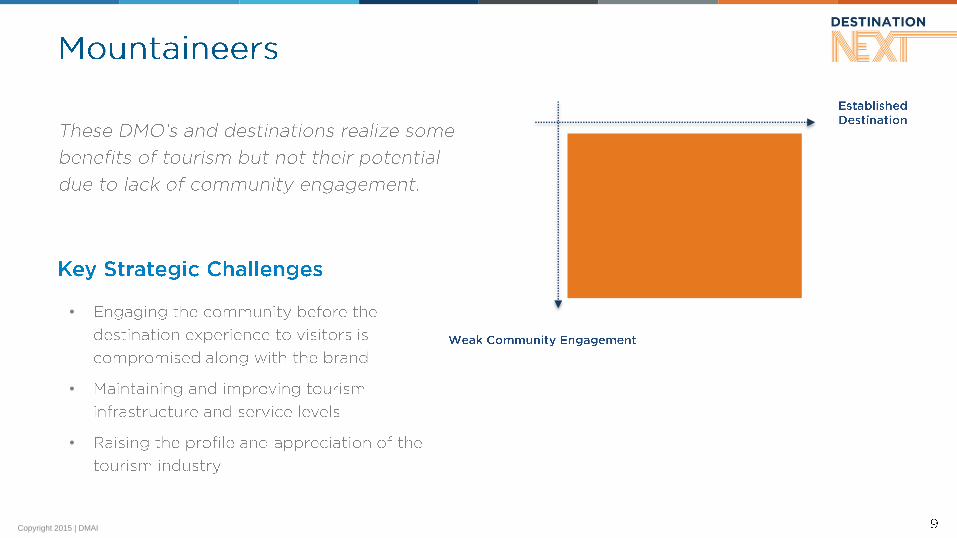
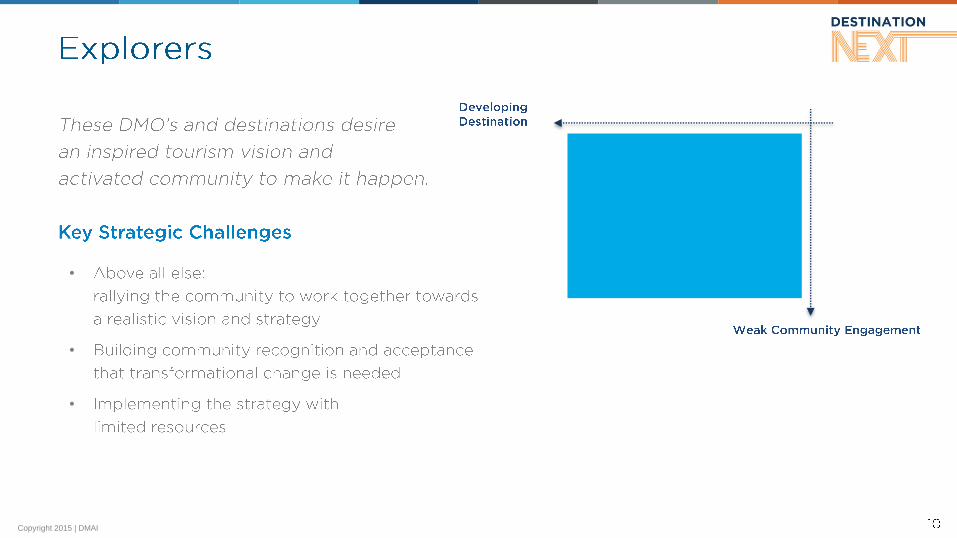
Weak Community Engagement
Established
Destination
Developing
Destination
TRAILBLAZERS VOYAGERS
EXPLORERS MOUNTAINEERS
Copyright 2015 | DMAI
•
•
•
Copyright 2015 | DMAI
•
•
•
Copyright 2015 | DMAI
•
•
•

Copyright 2015 | DMAI
•
•
•
Phase 2

Copyright 2015 | DMAI
o
o
o

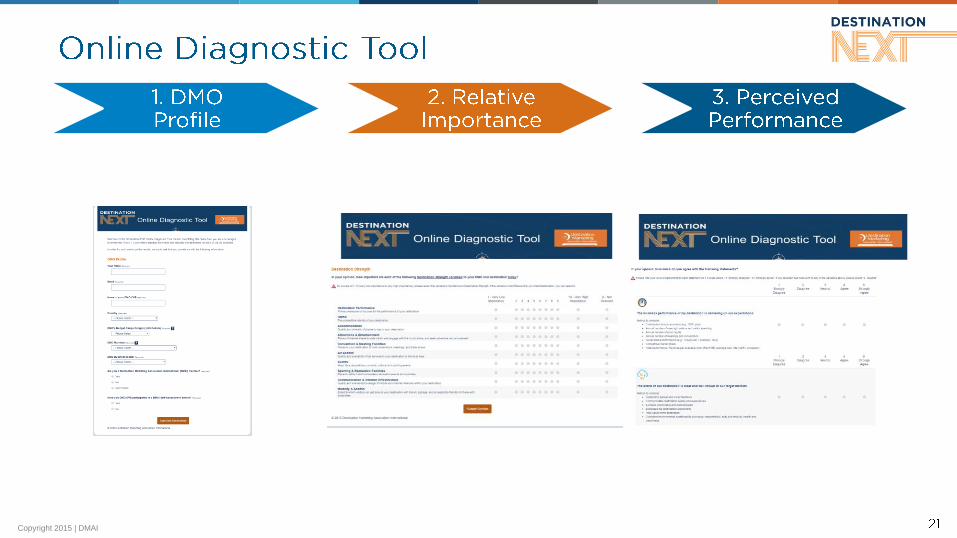
Diagnostic Tool
Copyright 2015 | DMAI
Scenario model intended to be strategic diagnostic tool,
not a benchmarking index to rank DMOs, CVBs or destinations
Objective self-assessment to help identify
priorities and strategies for the future
Copyright 2015 | DMAI
Copyright 2015 | DMAI
•
•
•
•
•
•
•
•
Copyright 2015 | DMAI
Copyright 2015 | DMAI
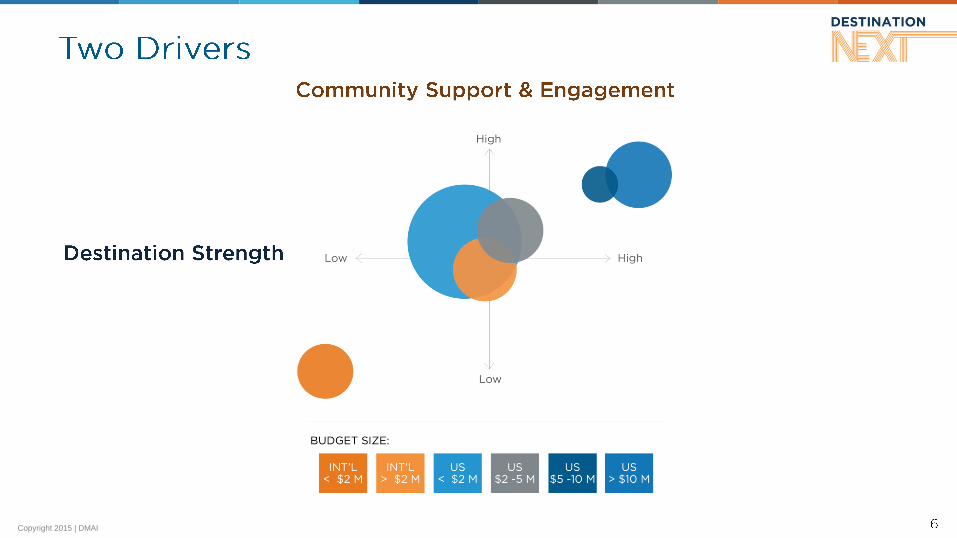
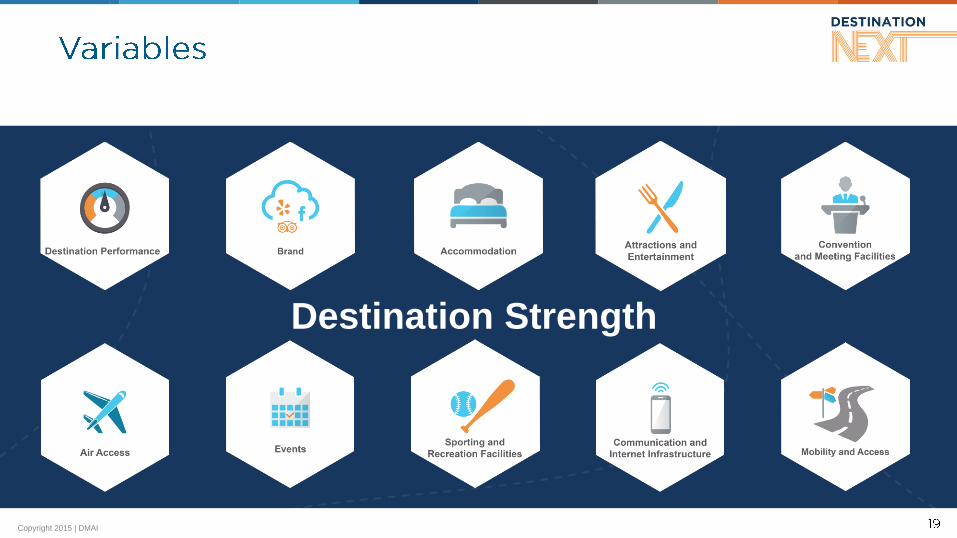
Destination Strength
Copyright 2015 | DMAI
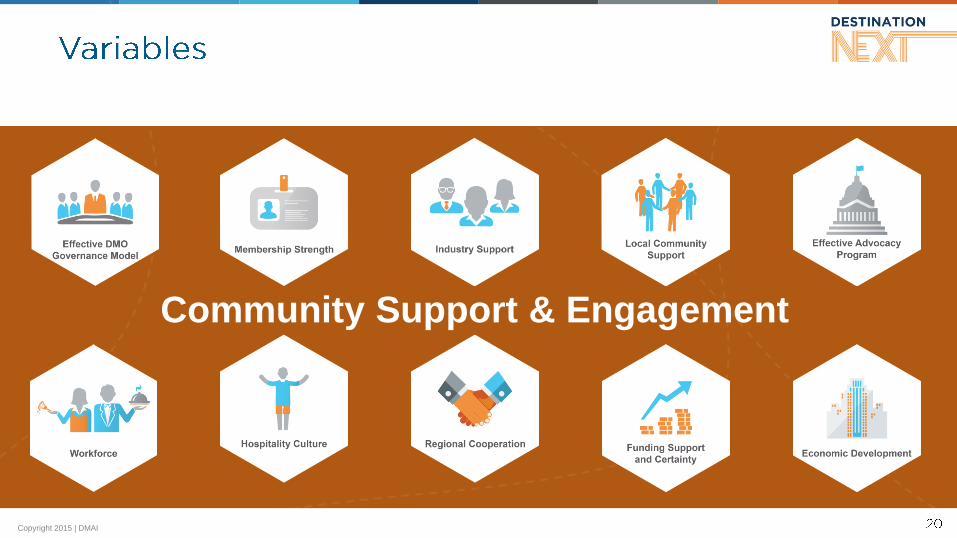
Community Support & Engagement
Copyright 2015 | DMAI

Copyright 2015 | DMAI

Copyright 2015 | DMAI
Diagnostic Report for: Metropolis
1
Community Support & Engagement
MetropolisIndustry
Average
Standard
DeviationMetropolis
Industry
Average
Standard
DeviationEffective DMO Governance Model 15% 10% 7% 5.00 3.60 0.91
Membership Strength & Support 10% 15% 7% 3.00 3.70 1.06
Industry Support 8% 5% 5% 4.00 3.65 1.02
Local Community Support 13% 12% 5% 4.00 2.80 1.00
Effective Advocacy Program 7% 10% 5% 5.00 3.00 1.22
Workforce 15% 15% 5% 2.00 3.10 1.23
Hospitality Culture 16% 5% 4% 4.00 3.30 1.03
Regional Cooperation 1% 8% 5% 5.00 3.20 1.09
Funding Support & Certainty 10% 10% 4% 3.00 2.90 1.06
Economic Development 5% 10% 4% 5.00 2.80 0.99
COMMUNITY SUPPORT & ENGAGEMENT (Metropolis) 3.78
AVERAGE DESTINATION STRENGTH 3.55
Relative Importance
(0-100%)
Perceived Performance
(1-5 scale)
Diagnostic Report for: Metropolis
Destination Strength
MetropolisIndustry
Average
Standard
DeviationMetropolis
Industry
Average
Standard
DeviationDestination Performance 10% 10% 7% 4.00 3.60 0.91
Brand 15% 15% 7% 3.00 3.70 1.06
Accommodation 12% 5% 5% 3.00 3.65 1.02
Attractions & Entertainment 8% 12% 5% 3.00 2.80 1.00
Convention & Meeting Facilities 5% 10% 5% 4.00 3.00 1.22
Air Access 15% 15% 5% 2.00 3.10 1.23
Events 10% 5% 4% 5.00 3.30 1.03
Sporting & Recreation Facilities 11% 8% 5% 4.00 3.20 1.09
Communication & Internet Infrastructure 9% 10% 4% 3.00 2.90 1.06
Mobility & Access 5% 10% 4% 5.00 2.80 0.99
DESTINATION STRENGTH (Metropolis) 3.41
AVERAGE DESTINATION STRENGTH 3.77
Relative Importance
(0-100%)
Perceived Performance
(1-5 scale)
Copyright 2015 | DMAI
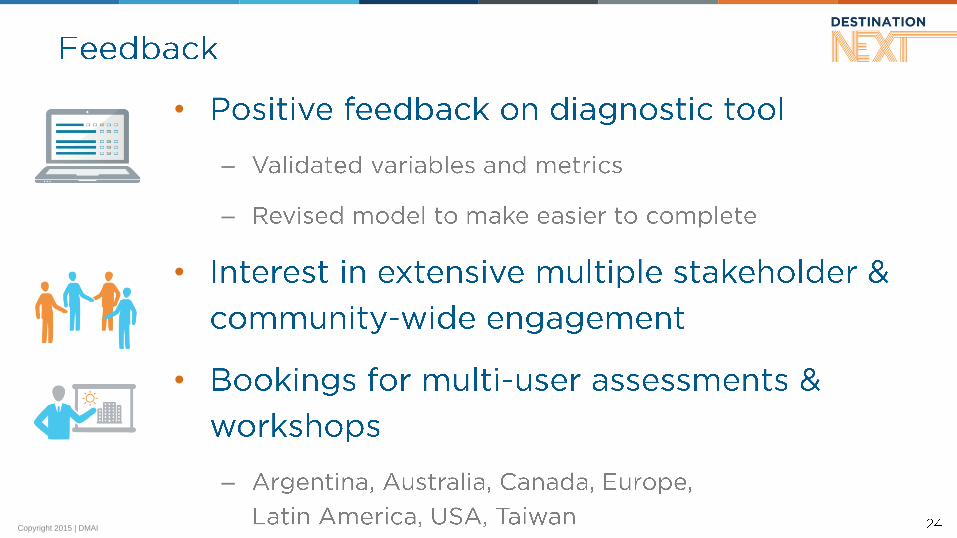
•
–
–
•
•
–

Copyright 2015 | DMAI

Copyright 2015 | DMAI
Relative Importance
Perceived Performance
1st
2nd
3rd
4th
10th
3rd
2nd
4th

Copyright 2015 | DMAI
Copyright 2015 | DMAI
Copyright 2015 | DMAI

Copyright 2015 | DMAI
Strong Community Engagement
Weak Community Engagement
Established
Destination
Developing
Destination
•
•
•
•
•
•
•
•
•
•
•
•
•

Copyright 2015 | DMAI
Strong Community Engagement
Weak Community Engagement
Established
Destination
Developing
Destination
•
•
•
•
•
•
•
•
•
Copyright 2015 | DMAI
Strong Community Engagement
Weak Community Engagement
Established
Destination
Developing
Destination
•
•
•
•
•
•
•
•

Copyright 2015 | DMAI
Launch

Copyright 2015 | DMAI

Copyright 2015 | DMAI
Guide & Practice
Handbook
Basic Scenario
Model Plot
Scenario Model
Assessment Workshop
Users Public Single User Multiple User DMO / Destination Client
Services • Guide
• Practice Handbook
• Access to Online
Diagnostic tool
• Scenario model plot of
Individual DMO
• Access to Online Diagnostic
tool
• Detailed scenario model plot &
analysis
• Full diagnostic report card
• Workshop Including:
• DestinationNEXT presentation
• Online self-assessment
• Analysis and review of results
• Group discussion and strategy
session
Fee Free Free $25 USD per Participant
Workshop Fee Based on DMO Budget Size
(USD)
• >250k - $4,000
• <1M - $5,000
• <3M - $6,000
• <10M - $7,500
• >10M - $8,500

Copyright 2015 | DMAI

Copyright 2015 | DMAI

Copyright 2015 | DMAI