Embed Size (px)
Citation preview

Software eNabling One Web
Responsive Design Survey
Do Responsive News Sites Deliver a Good Customer Experience OnMobile Devices?
March 2015

2
Contents§ Goal§ Methodology§ Analysis§ Optimization Results§ Detailed Case Studies§ Conclusion

Goal
Prefaceß Most responsive sites deliver the same images to all
devices.ß In the majority of cases, the images are too heavy for fast
access by mobile devices.
Goalß Analyze how images affect the performance of responsive
sites, and to what extent optimizing these images can improve website performance for all devices.
3

4
Methodology
§ The Trilibis research team considered websites in the following categories: top technology blogs, IT/enterprise media, gadget/gaming media, and technology-‐specific blogs of the larger national news websites.
§ From these, we developed a shortlist of 100 prominent websites that use responsive design techniques to optimize content for mobile devices.
§ We then examined the total page and image weights of the home page of each of these responsive sites, and then measured the load time of each page on a mobile device.

MethodologyStep 1: Initial Analysis
ß Examined page and image weights of the home page of 100 responsive sites, using Y!Slow tool.
ß Examined load times using Chrome Network Analysis tool using LTE network.
ß Generated optimization target list of 26 sites using criteria:Top 10 images weight > 1 MB
Step 2: Image Optimization & Results Analysisß Optimized JPEG & PNG images of the targeted sites using image
compression and resizing for desktop, tablet, and phonesß Analyzed improvements
Step 3: Case Studiesß Replicated 2 sites using optimized imagesß Performed detail analysis of page & image weights and load
times, before and after optimization.
5

6
Analysis
1. Page Weight and Image Weight2. Image Weight as % of Page Weight3. Load time vs Page Weight

Page Weight vs. Image Weight
7
Min Max Median Industry Average
Image Weight 3 KB 22 MB 794 KB 1.7 MB
Page Weight 161 KB 23MB 1.6 MB 2.5 MB
0
5
10
15
20
25
1 3 5 7 9 11 13 15 17 19 21 23 25 27 29 31 33 35 37 39 41 43 45 47 49 51 53 55 57 59 61 63 65 67 69 71 73 75 77 79 81 83 85 87 89 91 93 95 97 99
MB
Page Weight
Image Weight

8
Image Weight as a Percentage of Page Weight
42
28 25
5
0
10
20
30
40
50
60
70
80
< 50% 50% -‐ 70% 70% -‐ 90% >90 %Image Weight as % of Page Weight
#of sites
Ø Images account for greater than 50% on 58 out of 100 sites (58%).Ø Images account for greater than 90% on 5 out of 100 sites (5%) .
Sites

Mobile Load Times vs. Page Weight (Chrome)
9
Load Times on Mobile
# Sites Average Page Weight
Average Image Weight
Image as % of Page Weight
Average # Images
Average Image Size
Good Under 4 seconds
26 1.6 MB 0.9 MB 56% 38 23 KB
Bad 4 – 8 seconds 47 3.0 MB 2.2MB 73% 41 52 KB
Ugly Over 8 seconds 27 2.5 MB 1.5 MB 60% 49 31KB
v Many responsive sites load slowly on mobile phones:§ 26 out of 100 responsive sites (26%) responded with acceptable load times.
§ 27 out of 100 responsive sites (27%) took anywhere from 8 – 35 seconds to load
v Load time becomes unacceptable when page weight exceeds 1.6 MB.
v On average, images make up 56%–73% of page weight.

Page-‐Load Times on Mobile Devices
10
26%
47%
27%
Good (< 4 secs)
Bad (4-‐8 secs)
Ugly (> 8 secs)

Optimization Result – All Devices
11
Original (MB) Optimized (MB) Savings (MB) Avg Saving(%)
Desktop 81 43 38 47
Tablet 81 18 63 78
Phone 81 17 64 79
0
10
20
30
40
50
60
70
80
90
Desktop Tablet Phone
Original
Optimized
MB
79% average reduction
47%
78%
Average reduction after optimizing 26 sites

Optimization Results -‐ Desktop
12
Original After Optimization Improvement
Average Weight 3.2 MB 1.7MB 47%
Biggest Loser 17.9 MB 5.1 MB 72%
# of Heavy Sites (> 1 MB) 25 15 60%
Heaviest Site 17.9MB 5.1 MB 72%
Biggest Loser: 5MB saving
Average Image Weight After Optimization: 2.0 MB
Image Weight Before and After Image Optimization
Average Image Weight Original: 3.7 MB
0
2
4
6
8
10
12
14
16
18
20
1 2 3 4 5 6 7 8 9 10 11 12 13 14 15 16 17 18 19 20 21 22 23 24 25 26
MB
Savings
Post Optimization Desktop
Optimization Results -‐ Desktop
13
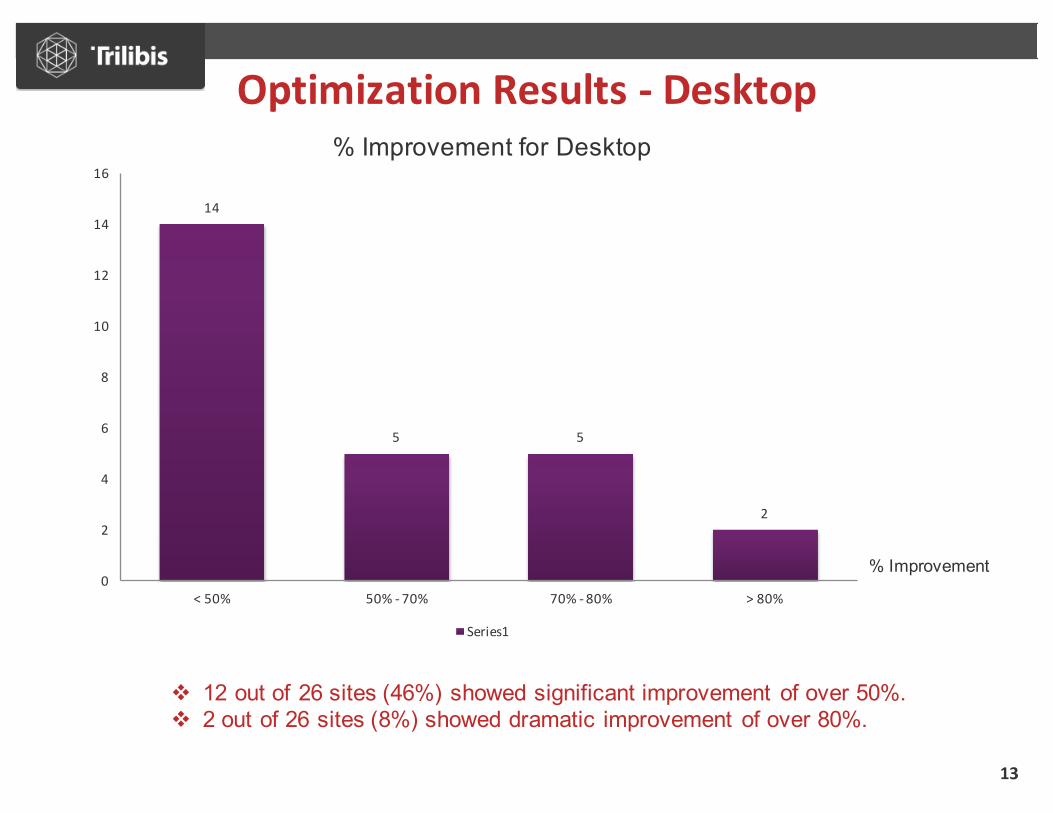
v 12 out of 26 sites (46%) showed significant improvement of over 50%.v 2 out of 26 sites (8%) showed dramatic improvement of over 80%.
% Improvement
% Improvement for Desktop
14
5 5
2
0
2
4
6
8
10
12
14
16
< 50% 50% -‐ 70% 70% -‐ 80% > 80%
Series1

Optimization Results -‐ Mobile
14
Original After Optimization Improvement
Average Weight 3.2MB 684 KB 79%
Biggest Loser 17.9 MB 2 MB 89%
# of Heavy Sites (> 1 MB) 25 4 84%
Heaviest Site 17.9MB 2 MB 89%
Biggest Loser: 12.9 MB saving
Average Image Weight After Optimization: 684 KB
Image Weight Before and After Image Optimization
Average Image Weight Original: 3.2 MB
0
2
4
6
8
10
12
14
16
18
20
1 2 3 4 5 6 7 8 9 10 11 12 13 14 15 16 17 18 19 20 21 22 23 24 25 26
MB
Series2
Series1

Optimization Results -‐ Mobile
15
v 24 out of 26 sites (92%) showed significant improvement of over 50%.v 10 out of 26 sites (38%) showed dramatic improvement of over 80%.
% Improvement
% Improvement for Mobile
2
8
6
10
0
2
4
6
8
10
12
< 50% 50% -‐ 70% 70% -‐ 80% > 80%
Series1

Optimization Results – Image Weight (KB)
16
Site Image SizePre-‐optimization
DesktopPost-‐optimization
TabletPost-‐optimization
MobilePost-‐optimization
1 987 506 411 3282 1310 943 587 4813 1470 655 607 5904 1500 1240 482 4825 1510 986 422 6906 1520 608 436 4227 1520 984 837 7838 1530 580 405 3859 1610 320 370 357
10 1650 348 262 26211 1670 1470 465 63612 1750 1450 992 95113 1780 1320 554 51014 2190 1010 567 81115 2260 1240 1240 110016 2430 500 454 45417 3000 2650 813 80418 3600 1080 512 44819 4110 2050 801 68520 4140 4140 378 37821 4150 625 510 56222 4190 3260 1200 116023 4900 1370 642 59624 5260 2730 1003 87525 5690 1270 1030 103026 17880 12780 2530 2000
Total 80607 43465 17697 16976Average 3224 1738 707 679

Sites whose images were optimizedhttp://www.computerweekly.com/http://www.newyorker.comhttp://www.macworld.co.uk/http://www.pocket-‐lint.com/http://www.macworld.com/http://startupchronicle.com/http://www.itworld.com/http://www.infosecurity-‐magazine.com/http://www.fortune.comhttp://www.engadget.com/http://www.ypulse.com/http://pando.com/http://singularityhub.com/
17
http://www.infoworld.com/http://discovermagazine.com/http://motherboard.vice.com/en_ushttp://www.9to5mac.com/http://bgr.com/http://www.boingboing.net/http://hbr.org/http://www.THR.comhttp://www.msnbc.comhttp://www.politico.comhttp://www.polygon.comhttps://www.techinasia.comhttp://thenextweb.com/

Network Analysis/Chrome Developer Tool
18

Case Study: Startupchronicle.com
19

Case Study: Startupchronicle.com
§ Before SNOW IO
§ After SNOW IO
20
§ Page Weight: 5.3 MB§ Image Weight: 4.7 MB§ Load Time: 7.2 s
§ Page Weight: 1.4 MB (74%)§ Image Weight: 834 KB (82%)§ Load Time: 3.7 s (48%)

Case Study: Singularityhub.com
21

Case Study: Singularityhub.com
22
§ Before
§ After
§ Page Weight: 6.1 MB§ Image Weight: 4.9 MB§ Load Time: 7.7 s
§ Page Weight: 3.1 MB (49%)§ Image Weight: 2.0 MB (59%)§ Load Time: 5.2 s (30%)

Case Study: Discovermagazine.com
23

Case Study: Discovermagazine.com
24
§ Before
§ After
§ Page Weight: 3.1 MB§ Image Weight: 2.6 MB§ Load Time: 6.8 s
§ Page Weight: 1.6 MB (48%)§ Image Weight: 1.1 MB (57%)§ Load Time: 6.2 s (6%)

25
Conclusions1. The page weights of the news media sites we sampled
were high.ß For 58 percent of the sample, images constituted
more than half of overall page weight; 5 percent of the sample served home pages with page weight consisting of more than 90 percent images
2. Many of the responsive sites in this survey performed badly on mobile phonesß Only 26 percent provided acceptable page-‐load timesß 27 percent were very slow (8 – 35 seconds to load)
3. Image optimization can reduce image weight by 47–79 percent.
4. Server-‐side image optimization delivered compelling performance gains on mobile devices:ß Average image weight was reduced by 79 percentß Page-‐load times were reduced by as much as 48
percent