Embed Size (px)
Citation preview
A Forrester Total Economic Impact™ Study Prepared For NetApp
The Total Economic Impact Of NetApp Solutions For Cloud Service Providers A Total Economic Impact Analysis
Project Director: Bob Cormier, Vice President and Principal Consultant
April 2012

Forrester Consulting
The Total Economic Impact Of NetApp Solutions For Cloud Service Providers
Page 1
TABLE OF CONTENTS
Executive Summary ................................................................................................................................................................................. 2
Disclosures ........................................................................................................................................................................................... 4
TEI Framework And Methodology ...................................................................................................................................................... 4
Analysis ...................................................................................................................................................................................................... 6
Interview Highlights .......................................................................................................................................................................... 6
Composite Service Provider Description — The Organization ................................................................................................ 6
Costs: Initial Startup Investments ................................................................................................................................................... 8
Costs: Ongoing Annual Investments ............................................................................................................................................ 11
Taking Advantage Of NetApp Efficiencies ....................................................................................................................................... 12
Revenues, Costs, And Gross Margin .................................................................................................................................................. 16
Flexibility ............................................................................................................................................................................................ 18
Risk ...................................................................................................................................................................................................... 18
Financial Summary ................................................................................................................................................................................ 20
Study Conclusions ................................................................................................................................................................................. 20
Appendix A: About NetApp Solutions For Cloud Service Providers: Overview ...................................................................... 22
Appendix B: Total Economic Impact™ Overview ............................................................................................................................ 23
Appendix C: About The Project Director ......................................................................................................................................... 24
© 2012, Forrester Research, Inc. All rights reserved. Unauthorized reproduction is strictly prohibited. Information is based on best available resources. Opinions reflect judgment at the time and are subject to change. Forrester®, Technographics®, Forrester Wave, RoleView, TechRadar, and Total Economic Impact are trademarks of Forrester Research, Inc. All other trademarks are the property of their respective companies. For additional information, go to www.forrester.com.
About Forrester Consulting Forrester Consulting provides independent and objective research-based consulting to help leaders succeed in their organizations. Ranging in scope from a short strategy session to custom projects, Forrester’s Consulting services connect you directly with research analysts who apply expert insight to your specific business challenges. For more information, visit www.forrester.com/consulting.
Forrester Consulting
The Total Economic Impact Of NetApp Solutions For Cloud Service Providers
Page 2
Executive Summary
In late 2011, NetApp commissioned Forrester Consulting to examine the total economic impact and business case justification for independent service providers to build and deliver storage-as-a-service (StaaS) to their customers using NetApp solutions. The purpose of this study is to give service providers a framework to evaluate the potential financial impact on their businesses if they build their cloud service offering on the NetApp platform.
Forrester found that the service providers successfully and profitably developed and marketed products and services on the NetApp platform and used this as an opportunity to gain access to new customers and incremental revenue opportunities.
For this study, Forrester interviewed six cloud service providers that have developed and sold cloud services built on the NetApp platform. Based on the data gathered from these service providers, we constructed a framework for evaluating the potential revenues, expenses, and gross profits associated with developing and selling a cloud-based StaaS offering.
From the interviews, we learned that the service providers were able to take advantage of and gain economic benefits from the following NetApp features, functionality, and business practices (see Appendix A for NetApp solution descriptions):
Scalability. The NetApp platform could scale easily, allowing the cloud service provider to start small and grow to support large and varied StaaS opportunities.
Satisfaction of data security concerns. NetApp allowed service providers to sell and operate separate instances for multiple customers that had data security concerns.
NetApp technology. A variety of NetApp technologies provide economic benefit to service providers. Storage efficiency capabilities such as deduplication, thin provisioning, Snapshot, and FlexClone minimize storage costs (see Table 7). Unified storage and multitenancy also increase efficiencies. Integrated data protection and data mobility give predictable service across a range of service-level agreements (SLAs). Features like SnapLock, a data permanence capability, can also be monetized. Application programming interfaces (APIs) allow further innovation and reduced management costs.
NetApp partnerships. Working with a variety of leaders such as VMware, Microsoft, and Cisco Systems allows key technologies in a service-oriented infrastructure to function well together.
Business model. NetApp has no proprietary branded cloud services to compete against those of service providers. Rather, NetApp’s focus is on being the storage and data management supplier of choice and helping its service provider partners market and sell their services.
From our interviews, we created a composite service provider Organization, which is based on characteristics of the interviewed service providers (see the Composite Service Provider Description — The Organization section.)
Table 1 represents a three-year summary of risk-adjusted revenues, costs, gross profit margin, and cumulative gross-profit-margin percent that our Organization experienced investing in NetApp solutions for cloud service providers.

Forrester Consulting
The Total Economic Impact Of NetApp Solutions For Cloud Service Providers
Page 3
Table 1 Revenue, Costs, And Gross Profit Over Three Years — The Organization (Risk-Adjusted)
Initial Year 1 Year 2 Year 3 Total
Total StaaS revenue $0 $1,041,120 $3,149,280 $5,602,410 $9,792,810
Total costs $1,782,831 $779,210 $1,030,889 $1,089,769 $4,682,699
Gross profit margin -$1,782,831 $261,910 $2,118,391 $4,512,641 $5,110,111
Cumulative gross profit margin %
N/A -146.1% 14.3% 52.2% 52.2%
Source: Forrester Research, Inc.
The three-year risk-adjusted gross profit (revenues less costs) of $5,110,111 is attributed to the Organization’s investment in NetApp solutions for cloud service providers (see details below in the Costs, Benefits, Flexibility, and Risk sections).
The risk adjustments made for the composite Organization are based on data and characteristics obtained during the customer interview process. Forrester risk-adjusts revenues to take into account the potential uncertainty that exists with an investment including underutilized infrastructure due to customers not renewing StaaS contracts at a predictable rate (Forrester assumes an annual 20% attrition rate in this analysis). The risk-adjusted value is meant to provide a conservative estimate, incorporating the previously mentioned risk factors. For this study, Forrester applied a 10% risk adjustment — i.e., a reduction of 10% — to all revenues to reflect the risks. For a more in-depth explanation of risk and the risk adjustments used in this study, please see the Risk section.
In this study, we will address the following financial topics using the composite Organization, which is representative of the service providers we interviewed:
Initial startup investments required to enter the StaaS services business using NetApp solutions.
Representative StaaS end user contract (revenue, costs, and gross profit margin) reported by interviewed service providers.
Ongoing investments to maintain and grow a StaaS services business using NetApp solutions.
Benefits attributed to utilizing the NetApp storage efficiency portfolio including deduplication, thin provisioning, Snapshot, and FlexClone.
Three-year financial projections — investments, revenues, and gross profit margin (risk-adjusted and non-risk-adjusted).
Forrester Consulting
The Total Economic Impact Of NetApp Solutions For Cloud Service Providers
Page 4
Disclosures The reader should be aware of the following:
The study is commissioned by NetApp and delivered by the Forrester Consulting group.
Forrester makes no assumptions as to the potential return on investment that other service providers will receive. Forrester strongly advises readers to use their own estimates within the framework provided in this study to determine the appropriateness of an investment in NetApp solutions for cloud service providers.
NetApp reviewed and provided feedback to Forrester, but Forrester maintained editorial control over the study and its findings and did not accept changes to the study that contradicted Forrester’s findings or obscured the meaning of the study.
Forrester does not endorse NetApp or its storage solutions.
The study is not a direct or implied market or competitive comparison.
TEI Framework And Methodology
Introduction Based on the information gathered from the service provider interviews, Forrester has constructed a Total Economic Impact™ framework for prospective service providers that wish to develop cloud-based products and services based on the NetApp platform. The objective of the framework is to identify the revenue, expense, flexibility, and risk factors that affect the investment decision over a three-year period.
Approach And Methodology Forrester took a multistep approach to evaluate the business case for NetApp solutions for cloud service providers (see Figure 1). Specifically, we:
Interviewed NetApp marketing personnel as well as Forrester analysts to gather data relative to NetApp solutions for cloud service providers and the marketplace in general.
Interviewed six service providers that have developed and are selling cloud services on the NetApp platform, to obtain data with respect to revenues, costs, and risks.
Designed a composite Organization (service provider) based on common characteristics of the interviewed service providers.
Constructed a financial model representative of the interviews using the TEI methodology. The financial model is populated with average expense and revenue data obtained from the interviews as applied to NetApp solutions for cloud service providers.

Forrester Consulting
The Total Economic Impact Of NetApp Solutions For Cloud Service Providers
Page 5
Figure 1 TEI Approach
Source: Forrester Research, Inc.
Forrester employed four fundamental elements of TEI in modeling the NetApp solutions for cloud service providers:
1. Costs.
2. Revenues.
3. Flexibility.
4. Risk and risk mitigation.
Please see Appendix B for additional information on the TEI methodology.
Framework Assumptions Table 2 provides the framework assumptions that Forrester used in this analysis.
Table 2 Framework Assumptions
General assumptions Value
Length of analysis Three years
Annual fully loaded cost of a storage administrator, project manager, and marketing staff
$110,000
Hourly fully loaded average cost of a storage administrator, project manager, and marketing staff
$53
Source: Forrester Research, Inc.
Construct financial model using TEI framework
Write TEI case study
Perform due diligence
Conduct interviews
Create composite Organization
Forrester Consulting
The Total Economic Impact Of NetApp Solutions For Cloud Service Providers
Page 6
Analysis
Interview Highlights Forrester derived its conclusions in large part from information received in a series of in-depth interviews with executives and personnel at six service providers currently using NetApp-based cloud solutions. The following is a brief description of each of the interviewed service providers, all of which were promised anonymity:
A North American service provider supplying cloud-based infrastructure-as-a-service (IaaS) and software-as-a-service (SaaS). It targets customers in the midmarket-to-enterprise range for the following services: disaster recovery (DR), backup and recovery, archival, test and development, and Exchange-as-a-service. This 50-person company has been using NetApp solutions for cloud service provision since 2008.
A European-based service provider operating eight data centers globally. It provides data protection services to organizations in government, healthcare, financial services, manufacturing, industry, and other sectors. Cloud-based services include: IaaS, DR, backup and recovery, archival, Exchange-as-a-service, business continuity, and failover as a service. This 60-person company has 6 petabytes of data stored on NetApp hardware, and it’s using NetApp storage efficiency tools to optimize utilization and efficiency.
A Japan-based service provider of high-value solution services, including Internet access, outsourcing, and systems integration. Its cloud-based services include SaaS, platform-as-a-service (PaaS), IaaS, StaaS, and application hosting. This 500-person service provider has been delivering cloud services on the NetApp platform for more than 12 months.
A North-American-based service provider offering its customers an advanced cloud infrastructure. Providing managed service offerings that deliver scale, security, and reliability to enterprises and governments around the world. It has 900 employees and a global network of data centers providing cloud-based services including primary IaaS, with StaaS, DR, backup and recovery, archival and eDiscovery, test and development, and cloud storage.
A US-based global service provider with core products such as managed hosting, cloud hosting, and email and application hosting. It has more than 3,000 employees serving about 100,000 cloud computing customers with revenues of almost $1 billion. It has been delivering backup and recovery as well as desktop and infrastructure cloud services on the NetApp platform for more than three years.
A European-based global IT solutions and managed services provider including cloud services. It employs more than 1,500 people worldwide meeting the IaaS and StaaS needs of more than 5,000 corporate and public-sector customers. It specializes in the area of advanced technologies and services with annual revenues exceeding $1 billion. It has been delivering cloud services on the NetApp platform for more than 12 months.
Composite Service Provider Description — The Organization In this TEI study, Forrester has created a composite cloud service provider Organization to illustrate the quantifiable revenues and costs, risks, and flexibility of developing and running capacity-optimized StaaS products and services on

Forrester Consulting
The Total Economic Impact Of NetApp Solutions For Cloud Service Providers
Page 7
the NetApp platform. The composite cloud service provider Organization is representative of the six NetApp cloud service providers interviewed by Forrester for this study.
Background: Pre-NetApp Business Environment The composite Organization is a 10-year-old company. Prior to developing capacity-optimized StaaS cloud services on NetApp, its primary product was system integration and dedicated hosting of applications and infrastructure that were sold using a traditional license-based model. The primary market for these services was mainly medium-sized and large enterprises, and that market will remain the same for its cloud-based products and services.
The Organization’s total annual revenues were $500 million. Its primary revenue source was managed services sales and maintenance fees. Other revenue sources include professional services engagements. Professional services engagements were required to integrate the products with its customers’ broader IT environment.
Reasons For Pursuing A Cloud-Based Product Strategy To grow the Organization’s revenues, management realized that it needed a product that would allow it to reach completely new markets. Its larger competitor had a strong presence outside of the Organization’s local market, making it difficult to break into different geographies with its on-premises product. At the same time, management believed that these same competitors were so large that they had lost some of their nimbleness, particularly when it came to pursuing smaller market segments. Management, noting an increasing interest among its customers and prospects for applications, infrastructure, and services that are delivered from the cloud, decided to pursue a cloud-based StaaS strategy. In particular, management believed that a cloud-based strategy would allow it to do the following:
Reach new market segments and geographies.
Achieve competitive differentiation relative to the Organization’s larger competitors.
Allow the business to scale rapidly without incurring the overhead costs associated with traditional hosted solutions.
Make it easy for prospects to try out its solution.
Make it easier to sell a service by dramatically reducing the upfront costs for the customer.
Create a profitable cloud-based StaaS product and services business.
Reasons For Choosing NetApp The Organization had experience in system integration of hosted infrastructure and applications. It had learned that this approach would not work well for its proposed products because the hosting costs did not scale linearly with the number of customers. The Organization was interested in an infrastructure solution that allows for cost-effectively deploying a portfolio of customer-facing services over time with significant economies of scale. The Organization reviewed other StaaS offerings and decided to use NetApp. Its reasons for choosing NetApp were similar to the six interviewed service providers and included the following:

Forrester Consulting
The Total Economic Impact Of NetApp Solutions For Cloud Service Providers
Page 8
The NetApp platform could scale easily, allowing the cloud service provider to start small and scale to support large use cases.
NetApp solutions allowed the Organization to address the cost challenges associated with hosted solutions.
NetApp allowed the Organization to sell and operate separate instances for those customers that had data security concerns.
NetApp’s technology: Unified storage, storage efficiency, and multitenancy minimize cost. Integrated data protection and data mobility give predictable service across a range of SLAs. Unique capabilities such as Snapshot, FlexClone, and SnapLock can be monetized. APIs allow further innovation.
NetApp partnerships: Working with a variety of leaders such as VMware, Microsoft, and Cisco allows key technologies in a service-oriented infrastructure to function seamlessly together.
Business model: NetApp has no proprietary branded services to compete against service providers. Rather, NetApp’s focus is on being the storage and data management supplier of choice.
The Organization has decided to design workload offerings to meet customer performance requirements at minimal cost by combining SATA drives with FlashCache.
In designing a reference architecture for a storage service, our Organization had two basic goals.
1. To ultimately offer a broad range of services built on a simple and scalable StaaS foundation.
2. To build an infrastructure that is cost-efficient, allowing the service provider to offer its customers reasonable and competitive prices for services while maintaining an acceptable gross profit margin.
The Organization understands that the best way to achieve a cost-efficient cloud-based storage infrastructure is to specifically configure infrastructure components to meet common workloads and drive that infrastructure to the highest possible levels of utilization.
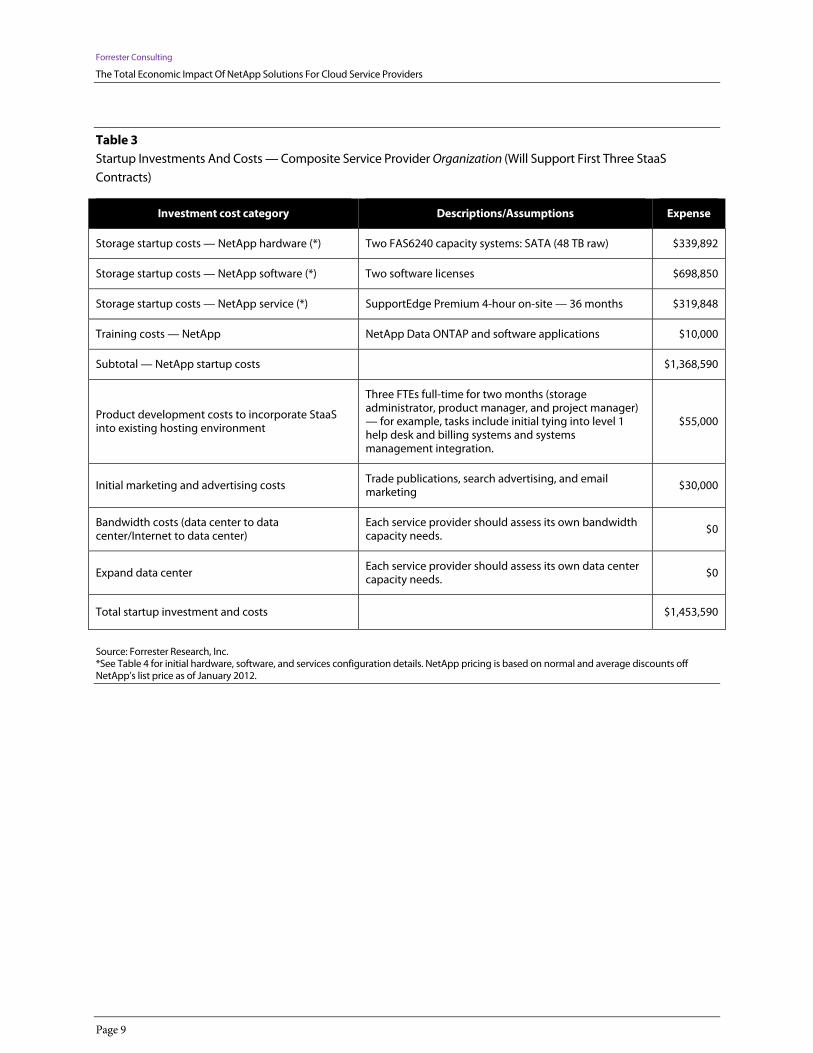
Costs: Initial Startup Investments From our interviews with existing service providers, Forrester has outlined in Table 3 the initial startup costs for the Organization. These costs will also support the first three StaaS contracts sold by the Organization in Year 1.
Forrester Consulting
The Total Economic Impact Of NetApp Solutions For Cloud Service Providers
Page 9
Table 3 Startup Investments And Costs — Composite Service Provider Organization (Will Support First Three StaaS Contracts)
Investment cost category Descriptions/Assumptions Expense
Storage startup costs — NetApp hardware (*) Two FAS6240 capacity systems: SATA (48 TB raw) $339,892
Storage startup costs — NetApp software (*) Two software licenses $698,850
Storage startup costs — NetApp service (*) SupportEdge Premium 4-hour on-site — 36 months $319,848
Training costs — NetApp NetApp Data ONTAP and software applications $10,000
Subtotal — NetApp startup costs $1,368,590
Product development costs to incorporate StaaS into existing hosting environment
Three FTEs full-time for two months (storage administrator, product manager, and project manager) — for example, tasks include initial tying into level 1 help desk and billing systems and systems management integration.
$55,000
Initial marketing and advertising costs Trade publications, search advertising, and email marketing
$30,000
Bandwidth costs (data center to data center/Internet to data center)
Each service provider should assess its own bandwidth capacity needs.
$0
Expand data center Each service provider should assess its own data center capacity needs. $0
Total startup investment and costs $1,453,590
Source: Forrester Research, Inc. *See Table 4 for initial hardware, software, and services configuration details. NetApp pricing is based on normal and average discounts off NetApp’s list price as of January 2012.
Forrester Consulting
The Total Economic Impact Of NetApp Solutions For Cloud Service Providers
Page 10
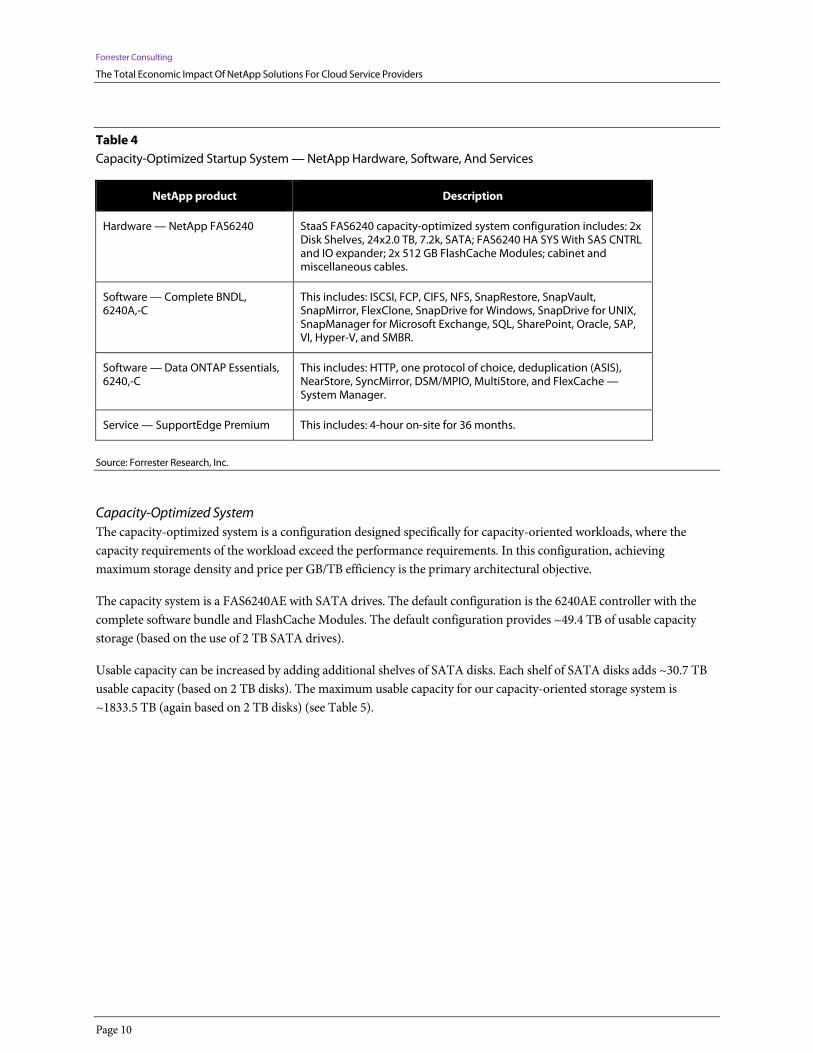
Table 4 Capacity-Optimized Startup System — NetApp Hardware, Software, And Services
NetApp product Description
Hardware — NetApp FAS6240 StaaS FAS6240 capacity-optimized system configuration includes: 2x Disk Shelves, 24x2.0 TB, 7.2k, SATA; FAS6240 HA SYS With SAS CNTRL and IO expander; 2x 512 GB FlashCache Modules; cabinet and miscellaneous cables.
Software — Complete BNDL, 6240A,-C
This includes: ISCSI, FCP, CIFS, NFS, SnapRestore, SnapVault, SnapMirror, FlexClone, SnapDrive for Windows, SnapDrive for UNIX, SnapManager for Microsoft Exchange, SQL, SharePoint, Oracle, SAP, VI, Hyper-V, and SMBR.
Software — Data ONTAP Essentials, 6240,-C
This includes: HTTP, one protocol of choice, deduplication (ASIS), NearStore, SyncMirror, DSM/MPIO, MultiStore, and FlexCache — System Manager.
Service — SupportEdge Premium This includes: 4-hour on-site for 36 months.
Source: Forrester Research, Inc.
Capacity-Optimized System The capacity-optimized system is a configuration designed specifically for capacity-oriented workloads, where the capacity requirements of the workload exceed the performance requirements. In this configuration, achieving maximum storage density and price per GB/TB efficiency is the primary architectural objective.
The capacity system is a FAS6240AE with SATA drives. The default configuration is the 6240AE controller with the complete software bundle and FlashCache Modules. The default configuration provides ~49.4 TB of usable capacity storage (based on the use of 2 TB SATA drives).
Usable capacity can be increased by adding additional shelves of SATA disks. Each shelf of SATA disks adds ~30.7 TB usable capacity (based on 2 TB disks). The maximum usable capacity for our capacity-oriented storage system is ~1833.5 TB (again based on 2 TB disks) (see Table 5).
Forrester Consulting
The Total Economic Impact Of NetApp Solutions For Cloud Service Providers
Page 11
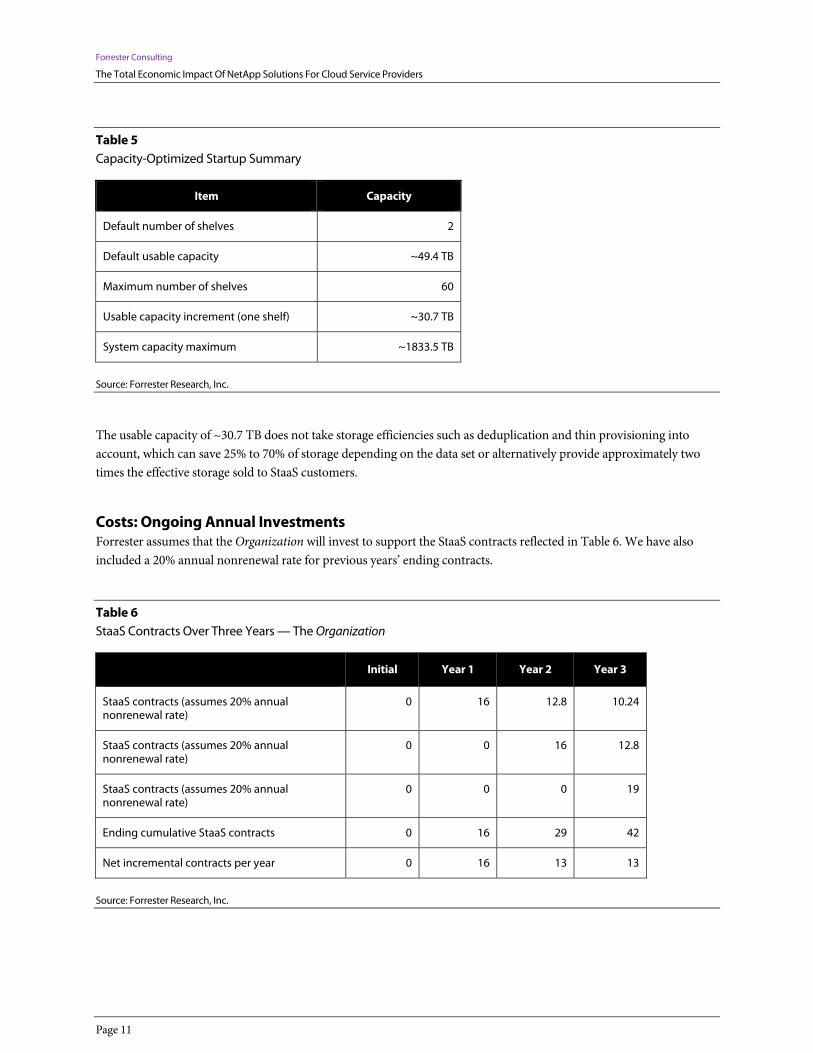
Table 5 Capacity-Optimized Startup Summary
Item Capacity
Default number of shelves 2
Default usable capacity ~49.4 TB
Maximum number of shelves 60
Usable capacity increment (one shelf) ~30.7 TB
System capacity maximum ~1833.5 TB
Source: Forrester Research, Inc.
The usable capacity of ~30.7 TB does not take storage efficiencies such as deduplication and thin provisioning into account, which can save 25% to 70% of storage depending on the data set or alternatively provide approximately two times the effective storage sold to StaaS customers.
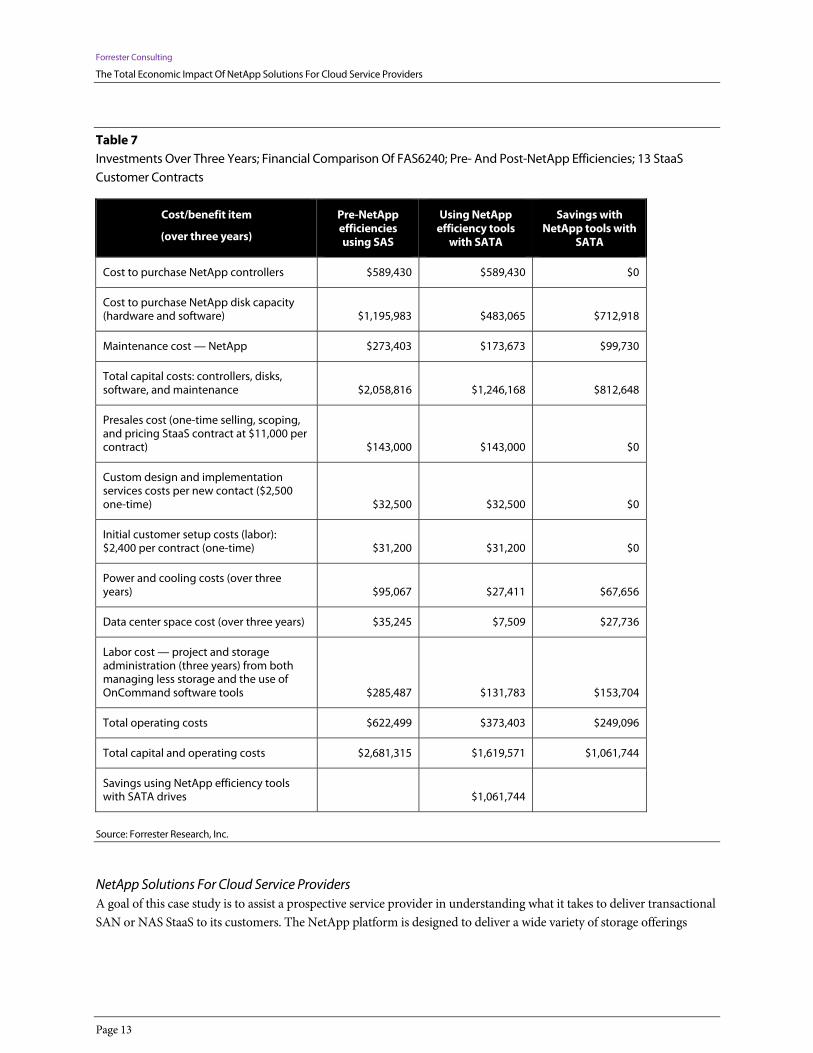
Costs: Ongoing Annual Investments Forrester assumes that the Organization will invest to support the StaaS contracts reflected in Table 6. We have also included a 20% annual nonrenewal rate for previous years’ ending contracts.
Table 6 StaaS Contracts Over Three Years — The Organization
Initial Year 1 Year 2 Year 3
StaaS contracts (assumes 20% annual nonrenewal rate)
0 16 12.8 10.24
StaaS contracts (assumes 20% annual nonrenewal rate)
0 0 16 12.8
StaaS contracts (assumes 20% annual nonrenewal rate)
0 0 0 19
Ending cumulative StaaS contracts 0 16 29 42
Net incremental contracts per year 0 16 13 13
Source: Forrester Research, Inc.

Forrester Consulting
The Total Economic Impact Of NetApp Solutions For Cloud Service Providers
Page 12
The costs represented in Table 10 support the above contract levels.
Taking Advantage Of NetApp Efficiencies
Along with NetApp, we configured and priced the various investments needed to support 13 StaaS contracts using NetApp FAS6240 under two different scenarios (see Table 7):
Using NetApp to deliver services to 13 customer contracts without taking advantage of NetApp efficiencies.
Delivering services to 13 customer contracts and taking advantage of NetApp efficiency features and tools including deduplication, thin provisioning, Snapshot, and FlexClone. Forrester assumes an average annual 50% data growth for StaaS customers, with a corresponding 30% storage growth with NetApp efficiency features and tools.
Over the estimated three-year life of 13 customer contracts, the Organization will save $1,284,234 in disk capacity, software, and maintenance by taking advantage of NetApp efficiency features and tools, and SATA drives as follows:
$150,129 in savings from using deduplication.
$218,700 in savings from using thin provisioning.
$139,980 in savings from using FlexClone.
$54,611 in savings from using Snapshot.
$621,084 in savings from using lower cost SATA drives (vs. SAS drives).
$99,730 in savings from reduced NetApp maintenance.
In addition, there are savings in power and cooling, data center space, and labor also reflected in Table 7 below.
Forrester Consulting
The Total Economic Impact Of NetApp Solutions For Cloud Service Providers
Page 13
Table 7 Investments Over Three Years; Financial Comparison Of FAS6240; Pre- And Post-NetApp Efficiencies; 13 StaaS Customer Contracts
Cost/benefit item
(over three years)
Pre-NetApp efficiencies using SAS
Using NetApp efficiency tools
with SATA
Savings with NetApp tools with
SATA
Cost to purchase NetApp controllers $589,430 $589,430 $0
Cost to purchase NetApp disk capacity (hardware and software) $1,195,983 $483,065 $712,918
Maintenance cost — NetApp $273,403 $173,673 $99,730
Total capital costs: controllers, disks, software, and maintenance $2,058,816 $1,246,168 $812,648
Presales cost (one-time selling, scoping, and pricing StaaS contract at $11,000 per contract) $143,000 $143,000 $0
Custom design and implementation services costs per new contact ($2,500 one-time) $32,500 $32,500 $0
Initial customer setup costs (labor): $2,400 per contract (one-time) $31,200 $31,200 $0
Power and cooling costs (over three years) $95,067 $27,411 $67,656
Data center space cost (over three years) $35,245 $7,509 $27,736
Labor cost — project and storage administration (three years) from both managing less storage and the use of OnCommand software tools $285,487 $131,783 $153,704
Total operating costs $622,499 $373,403 $249,096
Total capital and operating costs $2,681,315 $1,619,571 $1,061,744
Savings using NetApp efficiency tools with SATA drives $1,061,744
Source: Forrester Research, Inc.
NetApp Solutions For Cloud Service Providers A goal of this case study is to assist a prospective service provider in understanding what it takes to deliver transactional SAN or NAS StaaS to its customers. The NetApp platform is designed to deliver a wide variety of storage offerings

Forrester Consulting
The Total Economic Impact Of NetApp Solutions For Cloud Service Providers
Page 14
intended to support an even wider variety of applications and use cases. A full range of both SAN and NAS storage access protocols are covered including NFS, CIFS, FCP, and iSCSI. Multiple data protection offerings are also available, from a simple local snapshot to off-site backup and DR.
It is anticipated that these StaaS contracts will be used in conjunction with a co-location, hosted infrastructure or virtualized infrastructure as a service to provide storage resources to customers using those other services. This storage service could also be used to provide storage resources for other IT-as-a-service solutions (such as a VDI or SaaS offerings).
The solution is built on NetApp Data ONTAP (7-mode) using FAS6240 controllers. All storage equipment is configured using high-availability (HA) pairs. It will be assumed that any application or user utilizing this storage is looking for highly available storage.
The solution is designed with the ability to support multiple customers/tenants from the same physical infrastructure. This allows service providers to provide high-quality, high-value services while keeping infrastructure costs low, ensuring lower prices and higher margins. NetApp MultiStore and other security/networking best practices will be used to securely separate one tenant’s data from another.
NetApp features (such as storage efficiency technologies, integrated data protection, and others) are included in the NetApp platform (and pricing) and should be used within the StaaS service to reduce costs, increase the functionality of the service, or both.
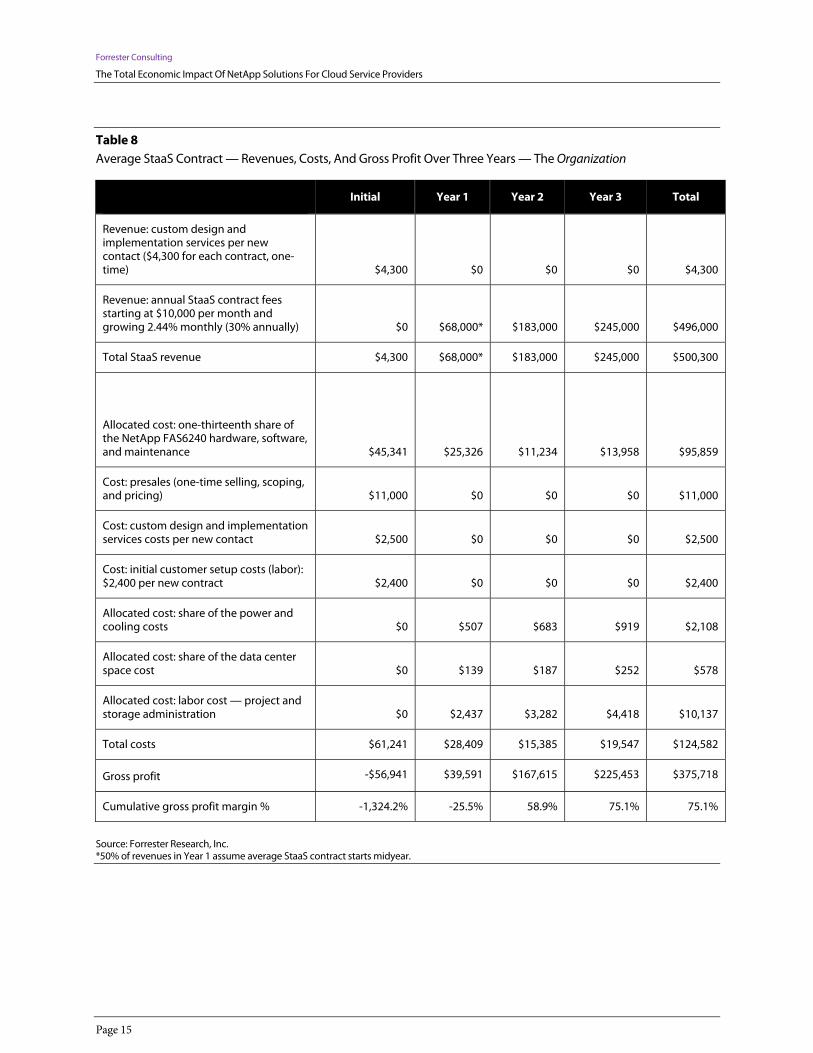
Table 8 represents the revenue, costs, and gross profit associated with the average StaaS contract (as part of its IaaS contract). When we could identify direct costs associated with the contract, we included them. In other cases, we allocated costs — i.e., the costs associated with the NetApp FAS6240, power, cooling, data center, as well as storage and project administration labor.
Forrester Consulting
The Total Economic Impact Of NetApp Solutions For Cloud Service Providers
Page 15
Table 8 Average StaaS Contract — Revenues, Costs, And Gross Profit Over Three Years — The Organization
Initial Year 1 Year 2 Year 3 Total
Revenue: custom design and implementation services per new contact ($4,300 for each contract, one-time) $4,300 $0 $0 $0 $4,300
Revenue: annual StaaS contract fees starting at $10,000 per month and growing 2.44% monthly (30% annually) $0 $68,000* $183,000 $245,000 $496,000
Total StaaS revenue $4,300 $68,000* $183,000 $245,000 $500,300
Allocated cost: one-thirteenth share of the NetApp FAS6240 hardware, software, and maintenance
$45,341
$25,326
$11,234
$13,958 $95,859
Cost: presales (one-time selling, scoping, and pricing) $11,000 $0 $0 $0 $11,000
Cost: custom design and implementation services costs per new contact $2,500 $0 $0 $0 $2,500
Cost: initial customer setup costs (labor): $2,400 per new contract $2,400 $0 $0 $0 $2,400
Allocated cost: share of the power and cooling costs $0 $507 $683 $919 $2,108
Allocated cost: share of the data center space cost $0 $139 $187 $252 $578
Allocated cost: labor cost — project and storage administration $0 $2,437 $3,282 $4,418 $10,137
Total costs $61,241 $28,409 $15,385 $19,547 $124,582
Gross profit -$56,941 $39,591 $167,615 $225,453 $375,718
Cumulative gross profit margin % -1,324.2% -25.5% 58.9% 75.1% 75.1%
Source: Forrester Research, Inc. *50% of revenues in Year 1 assume average StaaS contract starts midyear.

Forrester Consulting
The Total Economic Impact Of NetApp Solutions For Cloud Service Providers
Page 16
Revenues, Costs, And Gross Margin
Table 9 represents a three-year summary of revenues that our Organization experienced investing in NetApp solutions for cloud service providers.
Table 9 Revenues Over Three Years — The Organization (Non-Risk Adjusted)
Initial Year 1 Year 2 Year 3 Total
StaaS contracts (assumes 20% annual
nonrenewal rate)
0 16 12.8 10.24 0
StaaS contracts (assumes 20% annual
nonrenewal rate)
0 0 16 12.8
StaaS contracts (assumes 20% annual
nonrenewal rate)
0 0 0 19
Ending cumulative StaaS contracts 0 16 29 42
Revenue per contract (assumes 50% midyear) $0 $68,000 $183,000 $245,000
Revenue per contract (assumes 50% midyear) $0 $0 $68,000 $183,000
Revenue per contract (assumes 50% midyear) $0 $0 $0 $68,000
Revenue: annual StaaS contract fees start at
$10,000 per month and grow 2.44% monthly
(30% annually).
$0 $1,088,000 $3,430,400 $6,143,200 $10,661,600
Revenue: custom design and implementation
services revenue per new contract ($4,300 for
each contract one-time)
$0 $68,800 $68,800 $81,700 $219,300
Total StaaS revenue $0 $1,156,800 $3,499,200 $6,224,900 $10,880,900
Source: Forrester Research, Inc.
Table 10 represents a three-year summary of costs that our Organization experienced from investing in NetApp solutions for cloud service providers.

Forrester Consulting
The Total Economic Impact Of NetApp Solutions For Cloud Service Providers
Page 17
Table 10 Costs Over Three Years — The Organization
Initial Year 1 Year 2 Year 3 Total
NetApp startup investment (hardware, software, services, training) and product development, marketing, and advertising (from Table 3)
$1,453,590 $0 $0 $0 $1,453,590
Costs to support Year 1 contracts: incremental NetApp investment per 13 contract bundles (hardware, software, and maintenance) assuming use-of-NetApp efficiencies
$329,241 $146,240 $181,457 $225,007 $881,945
Costs to support Year 2 contracts: incremental NetApp investment per 13 contract bundles (hardware, software, and maintenance) assuming use-of-NetApp efficiencies
$0 $329,241 $146,240 $181,457 $656,938
Costs to support Year 3 contracts: incremental NetApp investment per 13 contract bundles (hardware, software, and maintenance) assuming use-of-NetApp efficiencies
$0 $0 $329,241 $146,240 $475,481
Subtotal cost (hardware, software, and maintenance)
$1,782,831 $475,481 $656,938 $552,704 $3,467,954
Presales (one-time selling, scoping, and pricing project at $11,000 per new contract)
$0 $176,000 $176,000 $209,000 $561,000
Design and implementation services costs per new contact ($2,500 one-time)
$0 $40,000 $40,000 $47,500 $127,500
Initial customer setup costs (labor): $2,400 per new contract (one-time)
$0 $38,400 $38,400 $45,600 $122,400
Power and cooling costs $0 $8,111 $19,657 $38,635 $66,403
Data center space cost $0 $2,222 $5,386 $10,584 $18,192
Labor cost — project and storage administration $0 $38,997 $94,508 $185,746 $319,251
Total costs $1,782,831 $779,210 $1,030,889 $1,089,769 $4,682,699
Source: Forrester Research, Inc.
Table 11 represents a three-year summary of revenues, costs, gross profit margin, and gross-profit-margin percent that our Organization experienced from investing in NetApp solutions for cloud service providers.
Forrester Consulting
The Total Economic Impact Of NetApp Solutions For Cloud Service Providers
Page 18
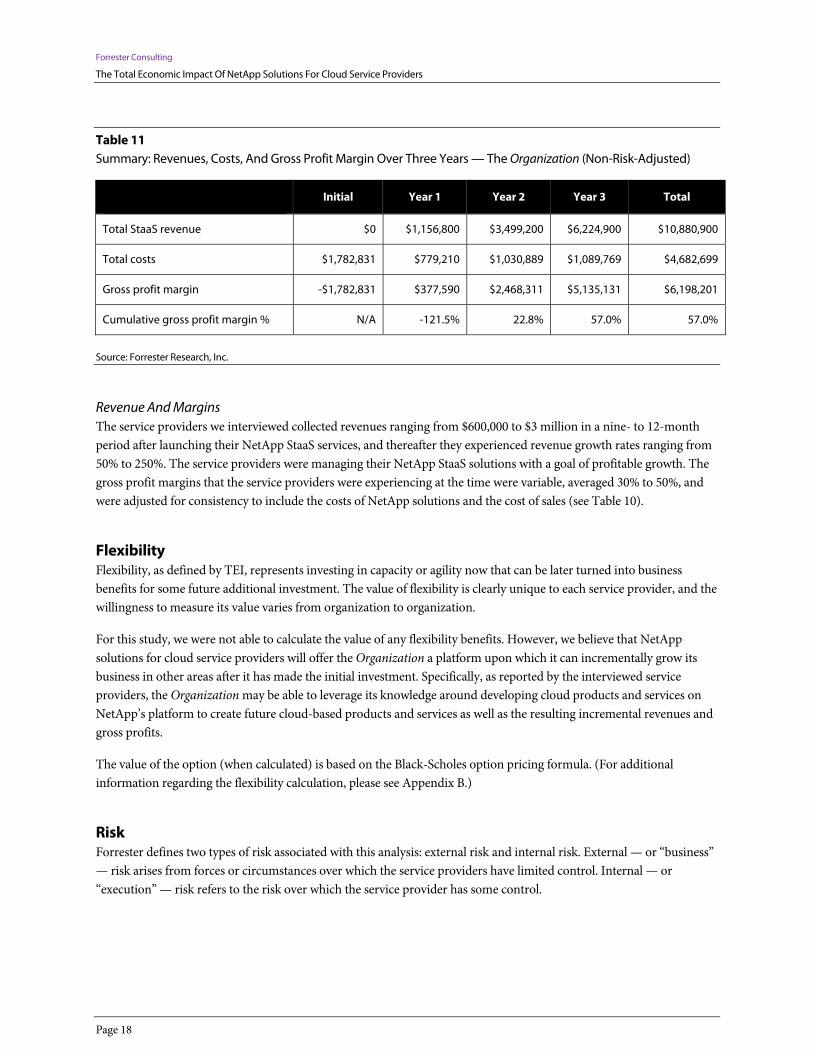
Table 11 Summary: Revenues, Costs, And Gross Profit Margin Over Three Years — The Organization (Non-Risk-Adjusted)
Initial Year 1 Year 2 Year 3 Total
Total StaaS revenue $0 $1,156,800 $3,499,200 $6,224,900 $10,880,900
Total costs $1,782,831 $779,210 $1,030,889 $1,089,769 $4,682,699
Gross profit margin -$1,782,831 $377,590 $2,468,311 $5,135,131 $6,198,201
Cumulative gross profit margin % N/A -121.5% 22.8% 57.0% 57.0%
Source: Forrester Research, Inc.
Revenue And Margins The service providers we interviewed collected revenues ranging from $600,000 to $3 million in a nine- to 12-month period after launching their NetApp StaaS services, and thereafter they experienced revenue growth rates ranging from 50% to 250%. The service providers were managing their NetApp StaaS solutions with a goal of profitable growth. The gross profit margins that the service providers were experiencing at the time were variable, averaged 30% to 50%, and were adjusted for consistency to include the costs of NetApp solutions and the cost of sales (see Table 10).
Flexibility Flexibility, as defined by TEI, represents investing in capacity or agility now that can be later turned into business benefits for some future additional investment. The value of flexibility is clearly unique to each service provider, and the willingness to measure its value varies from organization to organization.
For this study, we were not able to calculate the value of any flexibility benefits. However, we believe that NetApp solutions for cloud service providers will offer the Organization a platform upon which it can incrementally grow its business in other areas after it has made the initial investment. Specifically, as reported by the interviewed service providers, the Organization may be able to leverage its knowledge around developing cloud products and services on NetApp’s platform to create future cloud-based products and services as well as the resulting incremental revenues and gross profits.
The value of the option (when calculated) is based on the Black-Scholes option pricing formula. (For additional information regarding the flexibility calculation, please see Appendix B.)
Risk Forrester defines two types of risk associated with this analysis: external risk and internal risk. External — or “business” — risk arises from forces or circumstances over which the service providers have limited control. Internal — or “execution” — risk refers to the risk over which the service provider has some control.
Forrester Consulting
The Total Economic Impact Of NetApp Solutions For Cloud Service Providers
Page 19
Both business and execution risk can affect the potential expenses and revenues a service provider may experience. Risk also accounts for the variance or uncertainty in data that we gather during the interview process. The greater the variance or uncertainty is, the wider the potential range of outcomes is for expense and revenue estimates.
Quantitatively capturing business risk and execution risk and directly adjusting the financial estimates results in a more meaningful and accurate projection of the financial results. In general, risks affect expenses by raising the original estimates, and they affect revenues by reducing the original estimates. The risk-adjusted numbers should be taken as “realistic” expectations, as they represent the expected values considering risk.
The following internal or execution risks were considered in this study:
Lack of organizational discipline in creating processes and procedures to best take advantage of the benefits of building on the NetApp platform.
The initial investment needed to develop, market, and deliver StaaS cloud services will be variable from one service provider to another. A readiness assessment should be completed to determine the spare capacity of the existing computing infrastructure. Also, assess the experience and bandwidth of IT, development, marketing, and sales resources to deliver a launch-ready StaaS product. Most of the interviewed service providers reported adequate infrastructure and labor capacities prior to entering the StaaS marketplace. We encourage service providers to examine their existing capacities before deciding to invest in NetApp solutions for cloud service providers.
Operations expense may be variable. IaaS and StaaS operating expenses are driven by resource consumption, including compute time, storage needs, database needs, bandwidth, and the number of users. Service providers can control this expense by optimizing their products and services for resource usage by taking advantage of the following features or functionality:
o RAID-DP versus RAID 10.
o Deduplication.
o Thin provisioning.
o Snapshot backups versus traditional/tape backups.
o Storage — integrated replication versus software replication.
o Array-based cloning used for provisioning.
o Use of SATA for primary and secondary.
We identified the following business or external risks:
The inability of an organization to find, train, and retain administrators of the NetApp Data ONTAP operating system as well as other related NetApp products and solutions.
Revenues are variable, subject to sales and marketing effectiveness and external competition.
Forrester Consulting
The Total Economic Impact Of NetApp Solutions For Cloud Service Providers
Page 20
Customer renewal rates will be variable so we have risk-adjusted annual revenues to reflect a 20% annual attrition rate (80% renewal rate).
We identified risk mitigation benefits as follows:
The scalability of NetApp’s solutions means that the incremental storage hardware required to support each new contract can be purchased “just in time,” reducing the risk of overinvesting in hardware.
The interviewed service providers reported average favorable annual renewal rates of 70% to 90%.
For this study, Forrester has risk-adjusted revenues by 10% (downward) to take into account the potential uncertainty of StaaS customers not renewing at a predictable rate.
Financial Summary
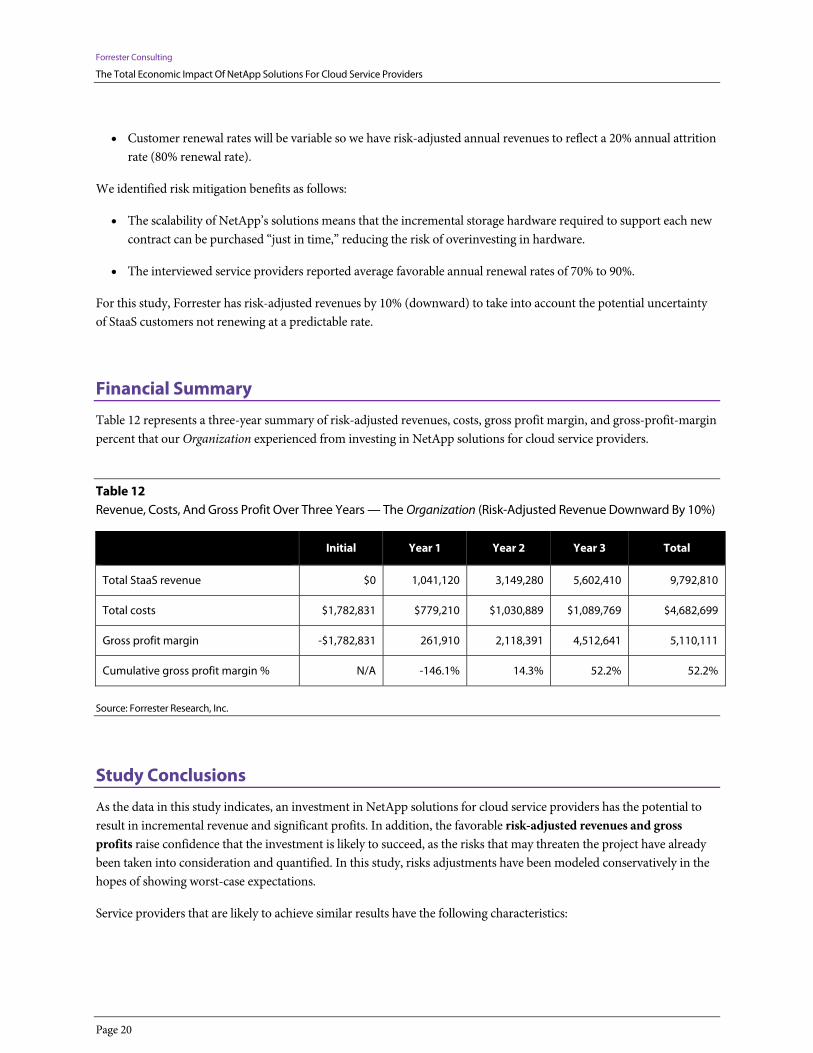
Table 12 represents a three-year summary of risk-adjusted revenues, costs, gross profit margin, and gross-profit-margin percent that our Organization experienced from investing in NetApp solutions for cloud service providers.
Table 12 Revenue, Costs, And Gross Profit Over Three Years — The Organization (Risk-Adjusted Revenue Downward By 10%)
Initial Year 1 Year 2 Year 3 Total
Total StaaS revenue $0 1,041,120 3,149,280 5,602,410 9,792,810
Total costs $1,782,831 $779,210 $1,030,889 $1,089,769 $4,682,699
Gross profit margin -$1,782,831 261,910 2,118,391 4,512,641 5,110,111
Cumulative gross profit margin % N/A -146.1% 14.3% 52.2% 52.2%
Source: Forrester Research, Inc.
Study Conclusions
As the data in this study indicates, an investment in NetApp solutions for cloud service providers has the potential to result in incremental revenue and significant profits. In addition, the favorable risk-adjusted revenues and gross profits raise confidence that the investment is likely to succeed, as the risks that may threaten the project have already been taken into consideration and quantified. In this study, risks adjustments have been modeled conservatively in the hopes of showing worst-case expectations.
Service providers that are likely to achieve similar results have the following characteristics:
Forrester Consulting
The Total Economic Impact Of NetApp Solutions For Cloud Service Providers
Page 21
Have an appreciation for both the technical and business benefits of NetApp’s unified architecture.
Seek to market StaaS as a solution (not a technology).
Are willing to use storage efficiency technologies such as deduplication and thin provisioning.
Will design StaaS products that take advantage of multitenancy — the ability to host multiple customers on a shared infrastructure.
Appreciate the benefits of not having to compete with NetApp for the same business, given that NetApp is not a cloud service provider.
Will take advantage of NetApp’s co-marketing and co-selling programs including the fact that NetApp account managers earn commission by referring business to cloud service provider partners.
For our service provider Organization, investing in NetApp solutions for cloud service providers carried a low to moderate level of risk and has the potential to incrementally grow revenues with resulting significant profits.
We make no assumptions regarding the effects of investing in NetApp solution at other service providers. This study examines the potential impact attributable to the six customers that participated in our examination and applies the common costs and benefits to a representative Organization. The underlying objective of this document is to provide guidance to decision-makers seeking to identify areas where value can potentially be created based on investing in NetApp’s solutions for cloud service providers.

Forrester Consulting
The Total Economic Impact Of NetApp Solutions For Cloud Service Providers
Page 22
Appendix A: About NetApp Solutions For Cloud Service Providers: Overview
According to NetApp, its solutions for cloud service providers help capture new markets and revenue streams and accelerate the development and delivery of differentiated and profitable cloud services. To that end, NetApp believes the following nine areas constitute its core value and should be considered to be key buying criteria for service providers when evaluating any storage vendor solution in their cloud requests for proposals (RFPs).
Unified Architecture A flexible architecture that supports many applications, diverse workloads, and changing requirements is highly advantageous for a service provider seeking to offer a portfolio of services with minimal cost. An architecture that supports multiple protocols, including NFS, CIFS, iSCSI, Fibre Channel, and FCoE, ensures a flexible foundation to meet any need. But multiprotocol is just one aspect of a standardized architecture. A unified set of tools and processes greatly reduces complexity and drives down costs. One architecture allows you to leverage your current infrastructure for future services to efficiently grow your business.
Scale Up And Scale Out A storage infrastructure has to be able to scale on the fly as your business grows and your data increases. A storage architecture should deliver extreme efficiency that increases with scale and remains flexible no matter how big you get. The ability to scale instantly in multiple dimensions — performance, capacity, and operations — is essential to meeting service levels and minimizing cost for end users.
Storage Efficiency Storage efficiency isn’t just a single feature. It’s an approach to building and managing a storage architecture, and it requires solutions with a combination of capabilities that maximize your operational, organizational, and business efficiency. Highly efficient solutions enable you to store the most data for the lowest cost; significantly reduce data center space requirements and power and cooling costs; and complete tasks in less time with fewer people. All of this, of course, has a positive impact on your bottom line.
Secure Multitenancy Solutions that provide secure end-to-end multitenancy across applications and data help service providers realize the full financial benefit of scale, while offering end users the cost benefits of a shared infrastructure with the security of a dedicated environment.
Integrated Data Protection Enterprise data protection is a key concern for end users contemplating cloud services. High availability, enterprise-strength security, disk-based backup and recovery, archive, compliance, and disaster recovery are important options that can all be monetized by a service provider. Your storage should integrate all of these capabilities for you. It’s important not only how a solution delivers data protection but also how it automates this key capability. True integrated data protection enables administrators to “set it and forget it” so that critical business information is safeguarded no matter what happens or how large you scale.

Forrester Consulting
The Total Economic Impact Of NetApp Solutions For Cloud Service Providers
Page 23
Nonstop Operations Keeping your business running 24x7 without disruption is essential. Behind the scenes, teams that can perform necessary functions with speed and ease can respond faster to business demands. Capacity and performance expansion, load balancing, testing, upgrades, and all other IT tasks should be quick, seamless, and completely transparent to end users.
Service Automation And Analytics As you move from supporting terabytes to petabytes, automation becomes more and more critical. You need to reduce the time it takes to perform routine administrative tasks — even as your infrastructure grows — and you need to manage more terabytes without adding more staff. Policy-based automation and analytics are required to speed deployment and provide near-real-time monitoring and alerts to safeguard availability and performance guarantees.
Intelligent Caching Buying lots of fast solid-state storage isn’t always the best way to increase performance. Storage systems that utilize sophisticated intelligent caching can give you faster performance at a lower cost. A highly optimized approach to caching helps eliminate the need for separate HDD and SSD storage tiers. Smart solutions with built-in intelligent caching will help your business reduce both capital and operating expenses while enhancing performance for end users.
Tested Integrations Storage is just one component within your cloud service. However, choosing a storage platform that has tested integrations with the leading vendors that comprise other pieces of your cloud service can lower risk and save you time in deploying your service, while ensuring that you leverage best-of-breed components. Look for a storage vendor that can show you partnership and integrations with leading cloud vendors like Cisco, VMware, Microsoft, and others.
Appendix B: Total Economic Impact™ Overview
Total Economic Impact is a methodology developed by Forrester Research that enhances a company’s technology decision-making processes and assists vendors in communicating the value proposition of their products and services to clients. The TEI methodology helps companies demonstrate, justify, and realize the tangible value of IT initiatives to both senior management and other key business stakeholders.
The TEI methodology consists of four components to evaluate investment value: benefits, costs, risks, and flexibility.
Benefits Benefits represent the value delivered to the user organization — IT and/or business units — by the proposed product or project. Often, product or project justification exercises focus just on IT cost and cost reduction, leaving little room to analyze the effect of the technology on the entire organization. The TEI methodology and the resulting financial model place equal weight on the measure of benefits and the measure of costs, allowing for a full examination of the effect of the technology on the entire organization. Calculation of benefit estimates involves a clear dialogue with the user organization to understand the specific value that is created. In addition, Forrester also requires that there be a

Forrester Consulting
The Total Economic Impact Of NetApp Solutions For Cloud Service Providers
Page 24
clear line of accountability established between the measurement and justification of benefit estimates after the project has been completed. This ensures that benefit estimates tie back directly to the bottom line.
Costs Costs represent the investment necessary to capture the value, or benefits, of the proposed project. IT or the business units may incur costs in the form of fully burdened labor, subcontractors, or materials. Costs consider all of the investments and expenses necessary to deliver the proposed value. In addition, the cost category within TEI captures any incremental costs over the existing environment for ongoing costs associated with the solution. All costs must be tied to the benefits that are created.
Risk Risk measures the uncertainty of benefit and cost estimates contained within the investment. Uncertainty is measured in two ways: 1) the likelihood that the cost and benefit estimates will meet the original projections, and 2) the likelihood that the estimates will be measured and tracked over time. TEI applies a probability density function known as “triangular distribution” to the values entered. At minimum, three values are calculated to estimate the underlying range around each cost and benefit.
Flexibility Within the TEI methodology, direct benefits represent one part of the investment value. While direct benefits can typically be the primary way to justify a project, Forrester believes that organizations should be able to measure the strategic value of an investment. Flexibility represents the value that can be obtained for some future additional investment building on top of the initial investment already made. For instance, an investment in an enterprisewide upgrade of an office productivity suite can potentially increase standardization (to increase efficiency) and reduce licensing costs. However, an embedded collaboration feature may translate to greater worker productivity if activated. The collaboration can only be used with additional investment in training at some future point in time. However, having the ability to capture that benefit has a present value that can be estimated. The flexibility component of TEI captures that value.
Appendix C: About The Project Director
Bob Cormier
Vice President, Principal Consultant
Bob is a vice president and principal consultant for Forrester’s Total Economic Impact™ (TEI) service. He is a leading expert on deriving business value from technology investments, specializing in advising clients on the TEI framework — services that help organizations understand the overall financial value of IT strategies and investments. He serves the following client role:
Technology vendor sales enablement professionals. Bob works with these professionals in their efforts to clearly articulate the unique value proposition of their solutions to prospects and customers using Forrester’s TEI methodology.
Forrester Consulting
The Total Economic Impact Of NetApp Solutions For Cloud Service Providers
Page 25
Bob has authored numerous TEI case studies for Forrester’s vendor clients. He has also delivered his acclaimed Justifying Technology Investments (JTI) workshop to more than 800 participants representing 400 organizations.
Bob has more than 25 years experience in the IT and consulting industries. Prior to joining Forrester, he held senior-level positions at two leading eBusiness consulting firms, ZEFER and Cambridge Technology Partners. Bob has successfully led company efforts to optimize financial, operational, and resource planning activities, incorporating leading-edge professional service automation (PSA) applications and enterprise resource planning (ERP) systems. He has also held senior financial management positions at Digital Equipment and Anixter International.
During his career, Bob has consulted with global users and vendors of IT and has been a frequent speaker at conferences, events, and seminars.
Education Bob earned an M.B.A. from Bentley University and a B.S. in business from The University of New Hampshire. As an adjunct professor, he has taught finance and economics courses for more than 10 years at Southern New Hampshire University and Daniel Webster College.