Embed Size (px)
Citation preview

FOURTHQUARTER 2016 January 26, 2017
Tele2 AB

Group highlights – Q4 2016
2
Q4 2016 % Change Reported
LFL is constant currencies and pro forma for Altel and TDC Sweden
% ChangeLFL
Mobile end-user service revenue(SEK billion)
3.71 +14% +6%
EBITDA(SEK billion) 1.46 +9% +4%
Net sales(SEK billion) 8.22 +18% +2%

Delivering on our long term strategy
3
Winning People & Culture
Value Champion
Step-Change Productivity
Focused Technology
Choices
• Swedish and Baltics 4G population coverage above 99%• Netherlands population coverage now >99% outdoor, >90% indoor• Netherlands data on-loading on own network at 82%
• Sweden mobile end-user service revenue up 4%, excluding TDC• Baltics mobile end-user service revenue up 12%• Netherlands mobile customer base surpasses 1 million
• Strong cash contribution from Sweden and Baltics• Kazakhstan JV synergy progressing well, material EBITDA contribution• Challenger program delivering, annual run-rate benefits of SEK >600 million
• TDC Sweden acquisition completed October 31, welcoming 800 colleagues • Awarded BCG Global Child Forum prize and Allbright equality award• Moved to new, activity-based and open-plan HQ

3 299 3 053 3 018 3 095
4 029
Q4 15 Q1 16 Q2 16 Q3 16 Q4 16
Sweden – FinancialsNet sales(SEK million)
Mobile end-user serviceRevenue (SEK million)
Q4 Highlights
EBITDA and EBITDA margin(SEK million)
4
1 801 1 758 1 778 1 885 1 928
Q4 15 Q1 16 Q2 16 Q3 16 Q4 16
946 894 8461 068 1 028
29% 29% 28%
35%
26%
0%
5%
10%
15%
20%
25%
30%
35%
40%
45%
50%
-800
-300
200
700
1 200
Q4 15 Q1 16 Q2 16 Q3 16 Q4 16
TDC
– TDC Sweden consolidated as of October 31, 2016
– Net sales flat (excl. TDC) due to the higher mobile growth being offset by lower fixed telephony and wholesale revenues
– Continued strong mobile end-user service revenue growth of 4%, excl. TDC, driven by consumer postpaid and large enterprise segment
– EBITDA, excl. TDC, flat year-on-year due to higher marketing spend
+22% +7% +9%
3 2941 872
941

Sweden – Continuing momentumConsumer postpaid mobile end-user service revenue
Share of sales with bundle >0.5GB
Q4 Highlights
Geographic coverage2G/4G
Q4 15 Q4 16
5
71%
86%
Q4 15 Q4 16
86% 89%
Q4 15 Q4 16
– Consumer postpaid mobile end-user service revenue up 7% driven by increased data monetization and strong Comviq customer growth
– Tele2 increasingly taking share of premium value buckets
– Highest sales for the Comviq Christmas campaign
– Strong revenue and EBITDA growth within the large enterprise segment with record profit levels in TDC
+7%

Baltics – Financials
Q4 Highlights
6
Net sales(SEK million)
EBITDA and EBITDA margin(SEK million)
Mobile end-user service revenue (SEK million)
476 468 477 521 533
Q4 15 Q1 16 Q2 16 Q3 16 Q4 160
100
200
300
400
500
600
257 246 256287 264
32% 32% 33% 32% 28%
0%
10%
20%
30%
40%
50%
60%
Q4 15 Q1 16 Q2 16 Q3 16 Q4 160
50
100
150
200
250
300
350
815 770 787884 935
Q4 15 Q1 16 Q2 16 Q3 16 Q4 160
100
200
300
400
500
600
700
800
900
1 000
– Net sales growth driven by continued demand for data services and equipment sales
– Mobile end-user service revenue growth driven by prepaid to postpaid migration, data monetization and growth in mobile broadband
– EBITDA growth despite increased marketing investment into the mobile broadband segment in Lithuania
+15% +3%+12%

Baltics – Data monetization continues
7
ASPU development Share of 4G capable smartphones in base
Q4 Highlights
4G population coverage
– Strong data monetization driven by ongoing prepaid to postpaid transition and data centric pricing
– Strong ASPU growth, especially in Lithuania, driven by mobile broadband and consumer postpaid
– 4G handset penetration continues to drive data consumption
– 99% network coverage drives higher data usage and purchase of top-up data buckets
88%99%
Q4 15 Q4 16Q4 15 Q4 16
20%
37%
Q4 15 Q4 16
+7%

Netherlands – Financials
Q4 Highlights– Net sales up due to strong mobile momentum, slightly offset by decline in fixed
– Strong mobile end-user service revenue driven by 24% increase in customer base and solid ASPU development
– Excluding last year’s VAT adjustment of SEK 90 million, underlying mobile end-user service revenue grew 40%
– EBITDA impacted by investments related to mobile launch and benefit of VAT adjustment in Q4 2015
8
Net sales(SEK million)
EBITDA (SEK million)
Mobile end-user service revenue (SEK million)
403322 336
419 438
Q4 15 Q1 16 Q2 16 Q3 16 Q4 160
50
100
150
200
250
300
350
400
450
500
35
-31
-116
-2-23
Q4 15 Q1 16 Q2 16 Q3 16 Q4 16
-150
-100
-50
0
50
100
1 512 1 441 1 452 1 478 1 583
Q4 15 Q1 16 Q2 16 Q3 16 Q4 160
200
400
600
800
1 000
1 200
1 400
1 600
1 800
+5% -166%+9%

Netherlands – Continuing momentumSpontaneous brand awareness & brand consideration (Memo2)
Share of total new postpaid(GfK)
Data usage on own network
Q4 Highlights– Awareness and consideration remain at high levels supported by our ongoing innovative “Fun Rebel Campaign”
– Maintaining a solid market share of new postpaid contracts, 58k net intake in the quarter, despite increased competitive pressure
– Good progress in data on-loading on own network driven by network rollout now at >99% outdoor and >90% indoor coverage
– Doubled our 4G customer base year-on-year to >800k, of which >600k are provisioned for VoLTE and 170k active
9
27%
82%
Pre-launch Dec 164G
34%40%41%
52%
Pre-launch Dec 16
Awareness Consideration
12%
19%
Pre-launchOct 15
Q4 16

-38
14
47
84 92-5%
3%8%
14% 13%
-50%
-40%
-30%
-20%
-10%
0%
10%
20%
Q4 15 Q1 16 Q2 16 Q3 16 Q4 16-40
10
60
110
160
– Net sales stable due to a heavy Altel equipment sales campaign in Q4 2015
– Significant mobile end-user service revenue growth due to higher ASPU and an increasing customer base
– Positive EBITDA development driven by revenue growth, improved operating leverage and synergies from JV integration
Kazakhstan – Financials
10
Q4 Highlights
LFL is constant currency and pro forma for Altel
Net sales, LFL (SEK million)
EBITDA and EBITDA margin, LFL (SEK million)
Mobile end-user service revenue, LFL (SEK million)
404 418 433 457 470
Q4 15 Q1 16 Q2 16 Q3 16 Q4 160
50
100
150
200
250
300
350
400
450
500706
545 574 611702
Q4 15 Q1 16 Q2 16 Q3 16 Q4 160
100
200
300
400
500
600
700
800
+343%+16%0%

6 114 6 440
Q4 15 Q4 16
+5%
Q4 15 Q4 16
Kazakhstan – Strong performanceASPU development, LFL Integration
Q4 Highlights
11
Customer base, LFL(thousands)
LFL is pro forma for Altel
– Customer base continues to grow year-on-year, despite competitive pressure
– Strong ASPU growth driven by our continued focus on improving data monetization
– JV integration well on track with all 2016 integration KPI targets met. ~500 base station sites merged as integration progresses into 2017
– New Altel campaign launched to promote speed, data usage and improved brand consideration
+8%
~500 sites merged

Challenger program on track
Simplify% of products harmonized
on shared platforms
Discipline% of spend strategically
sourced & procured
Consolidate% of reduction in IT OpEx
as share of revenue
Transform% of staff in
Shared Operations
2016 target 2018 targetBaseline
30% 40% 60%
40% 75% 80%
0% 5% 20%
12% 18% 25%
Key progress areas
Further progress made on consolidating key cost categories into strategic sourcing, reaching level above 75% by year end
Continued consolidation of Network & IT organizations into Shared Operations, with Baltics and Croatia joining in Q4 2016, enabling further economies of scale
Productivity improvement program implemented in Sweden, reducing more than 200 FTEs
Announced reduction of additional 75 FTEs in Netherlands
Product simplification initiative progressing. 950 products closed year to date
12
✔
✔
✔
✔

Financial Overview
13

3 242
3 711
12757 35
217 924
Q4 15 Sweden Baltics NL KZ RoW Oth Q4 16
Mobile end-user service revenue
Tele2 Group(SEK million)
14
3 242 3 1293 307
3 598 3 711
Q4 15 Q1 16 Q2 16 Q3 16 Q4 16
+14%
Development per market(SEK million)
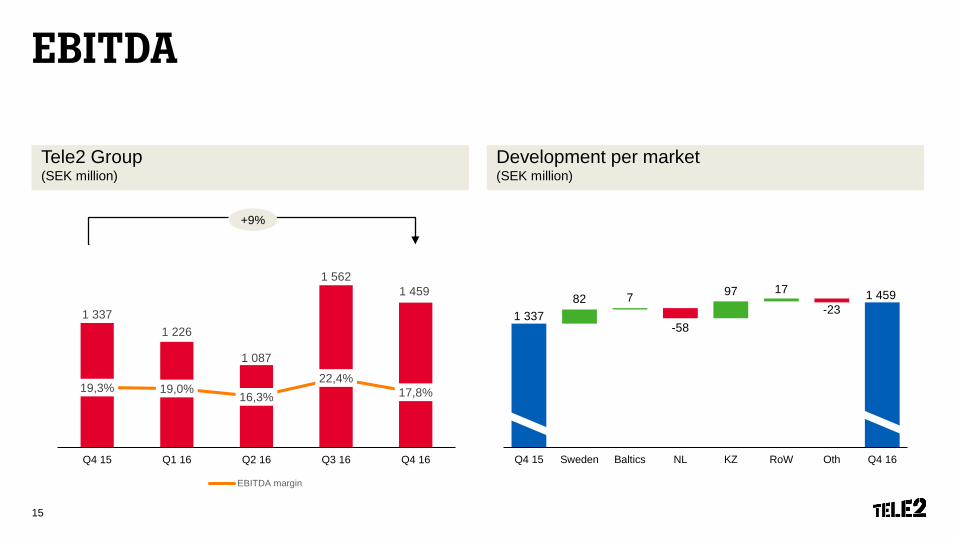
EBITDA
Tele2 Group(SEK million)
15
Development per market(SEK million)
1 3371 226
1 087
1 5621 459
19,3% 19,0%16,3%
22,4%17,8%
0,0%
10,0%
20,0%
30,0%
40,0%
50,0%
60,0%
600
800
1000
1200
1400
1600
Q4 15 Q1 16 Q2 16 Q3 16 Q4 16
EBITDA margin
+9%
1 337
1 45982 7
-58
97 17
-23
630
830
1 030
1 230
1 430
1 630
1 830
Q4 15 Sweden Baltics NL KZ RoW Oth Q4 16
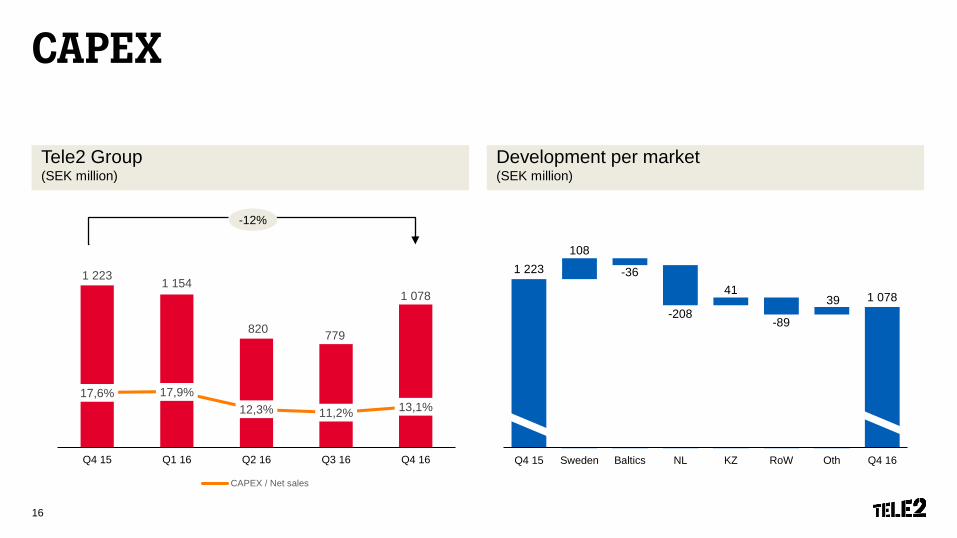
CAPEX
Tele2 Group(SEK million)
16
Development per market (SEK million)
1 223
1 078
108
-36
-208
41
-89
39
350
550
750
950
1 150
1 350
Q4 15 Sweden Baltics NL KZ RoW Oth Q4 16
1 223 1 154
820 779
1 078
17,6% 17,9%12,3% 11,2% 13,1%
0,0%
10,0%
20,0%
30,0%
40,0%
50,0%
60,0%
0
200
400
600
800
1000
1200
1400
Q4 15 Q1 16 Q2 16 Q3 16 Q4 16
CAPEX / Net sales
-12%

Free cash flowTotal operations
Tele2 Group(SEK million)
Development (SEK million)
Free cash flow = Cash flow from operating activities and CAPEX paid17
-291
-154
139
838
394
-500
-300
-100
100
300
500
700
900
Q3 15
Q1 16 Q1 16Q3 16 Q4 16
Q4 15
Q2 16
-291
394
122
-44 -24
130 0
-300
-200
-100
0
100
200
300
400
500
600
Q4 15 EBITDA Interest etc TaxesWorkingcapital CAPEX
One-offitems Q4 16
+235%
501

Cash generation in established markets
18Note: Cash generation defined as (EBITDA-CAPEX)/EBITDA,Established markets defined as Sweden and Baltics
83%80% 77%
66%69%
65%
79% 77%74%
2014 2015 2016
SE Baltics Established

Debt position and financial leverageEconomic net debt to EBITDA 12 m rolling
19 Economic net debt is defined as net debt excluding liabilities from Kazakhtelecom and liabilities guaranteed by Kazakhtelecom
1,88
LeverageSEK billion
9,9 9,4
11,7 11,0 10,4
2,6
1,88
0,0
0,5
1,0
1,5
2,0
2,5
0,0
2,5
5,0
7,5
10,0
12,5
Dec 2015 Mar 2016 Jun 2016 Sep 2016 Dec 2016
Economic net debt Dividend, announced Economic net debt to EBITDA
1,88

SEK 16 billion of debt refinanced
20
4,83,5
1,0 0
7,6
0-1 1-2 2-5 5+ years0,0
1,0
2,0
3,0
4,0
5,0
6,0
7,0
8,0
9,0
10,0
Utilized Unutilized
Maturity profile in Q4 2015(SEK billion)
Maturity profile in Q4 2016(SEK billion)
2,9 0
5,12,4
8,8
0-1 1-2 2-5 5+ years0,0
2,0
4,0
6,0
8,0
10,0
12,0
Utilized Unutilized
Average maturity of net financial debt 1,6 years Average maturity of net financial debt >5 years

Financial guidance 2017
*Based on LFL which is constant currencies and pro forma for Altel and TDC SwedenDividend policy: 2017 dividend to be paid in 2018 21
Net sales(SEK billion)
EBITDA(SEK billion)
31 – 32
5.9 – 6.2
CAPEX(SEK billion)
3.8 – 4.1
Mobile end-user service revenue
Mid-single digit % growth*
Dividend policy
Financial leverage
2017: 4 SEK / share Covered by eFCF from 2019
2.0 - 2.5

Summary
22

Key priorities moving forward
Growth from continued data monetization
Sustain momentum in Sweden and Baltics
Integration of TDC
Further leverage our challenger strategy in
Netherlands and Kazakhstan
Execute on Challenger and synergy programs
23
Winning People & Culture
Value Champion
Step-Change Productivity
Focused Technology
Choices

Tele2’s Way2Win
The Tele2 Way
We are challengers, fast-movers and will always offer our customers what they need for less
We will be champions of customer value in everything we do
How we win
Focused Technology
Choices
Value Champion
Step-Change Productivity
Winning People & Culture
Vision
Mission
Where we play
Mobile access
Our current footprint
Residential and Business
IoT
Responsible Challenger
23

THEEND