Embed Size (px)
Citation preview

Financial Analyst Day – June 30, 2011
NetApp Strategic Overview Tom Georgens
President & CEO
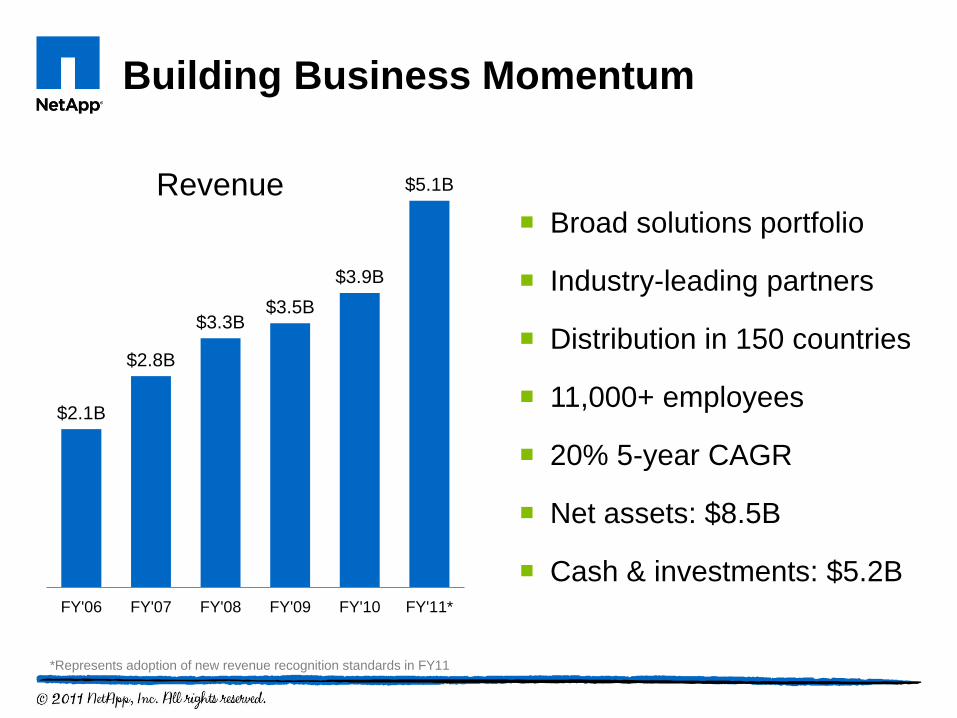
Building Business Momentum
Broad solutions portfolio
Industry-leading partners
Distribution in 150 countries
11,000+ employees
20% 5-year CAGR
Net assets: $8.5B
Cash & investments: $5.2B
$2.1B
$2.8B
$3.3B $3.5B
$3.9B
$5.1B
FY'06 FY'07 FY'08 FY'09 FY'10 FY'11*
Revenue
*Represents adoption of new revenue recognition standards in FY11

Strong Geo Performance
FY11* Revenue Growth
Americas 31%
– USPS 47%
– Commercial 26%
EMEA 29%
APAC 28%
*Represents adoption of new revenue recognition standards in FY11

Separating from the Pack
Dell, 0%
Dell, -12%
HP, 10%
HP, 1%
IBM, 9%
IBM, 1%
EMC, 18%
EMC, 17%
NetApp, 30%
NetApp, 45%
Compared
to 2 years
ago
Most Recent 4 Quarters Revenue Growth
Compared
to 1 year
ago
Updated 5.18.11: YoY growth numbers of the storage business
NTAP: FY’11 Apr’11; DELL: FQ2'11-Q1'12 ending Apr’11; HPQ: FQ3'10-FQ2'11 ending Apr’11; EMC: FQ2'10-FQ1'11 ending Mar’11; IBM FQ2'10-FQ1'11 ending Mar’11.
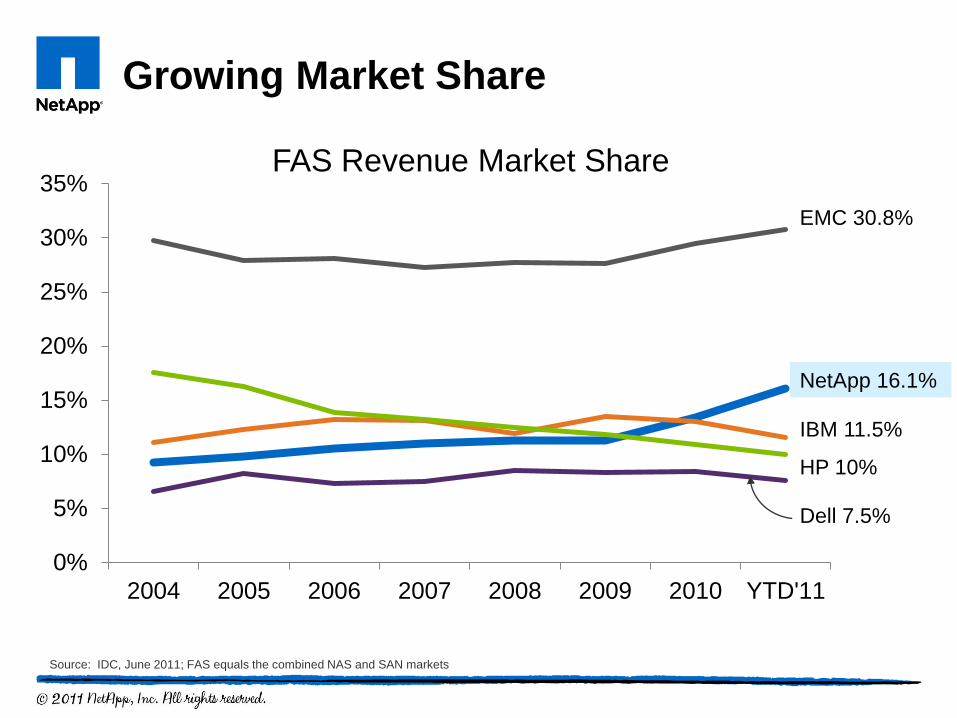
Growing Market Share
0%
5%
10%
15%
20%
25%
30%
35%
2004 2005 2006 2007 2008 2009 2010 YTD'11
Source: IDC, June 2011; FAS equals the combined NAS and SAN markets
EMC 30.8%
NetApp 16.1%
IBM 11.5%
HP 10%
Dell 7.5%
FAS Revenue Market Share

NetApp Momentum in Virtual Environments
Forrester Global Virtual Server Environments Surveys Q: Which vendor(s) supplied the networked storage used for your virtual server environment
2008 2010
“Storage Choices For Virtual Server Environments”, Forrester Research
Inc., January 15, 2009
“Storage Choices For Virtual Server Environments, Q1, 2011”, Forrester
Research Inc., March 15, 2011

Culture as a Competitive Differentiator
EMEA
Switzerland #2
United Kingdom #2
France #4
Netherlands #5
Germany #8
North America
Canada #2
USA #5
APAC
Australia #3
Japan #8
India #10

Opportunity

Growth Companies of Scale
Fortune 1000 + Global 2000 High Tech Companies with $5B+ revenues and 20%+ five year organic CAGR

Multiple Growth Opportunities
We can double in our current markets
Large growing market
No dominant player
Significant opportunity in S5000 and MSE
Many under-penetrated geographies
Abundant partner opportunities
Emerging high growth workloads

How We Think about Acquisitions
Acquisition Criteria
Affinity
Adjacency

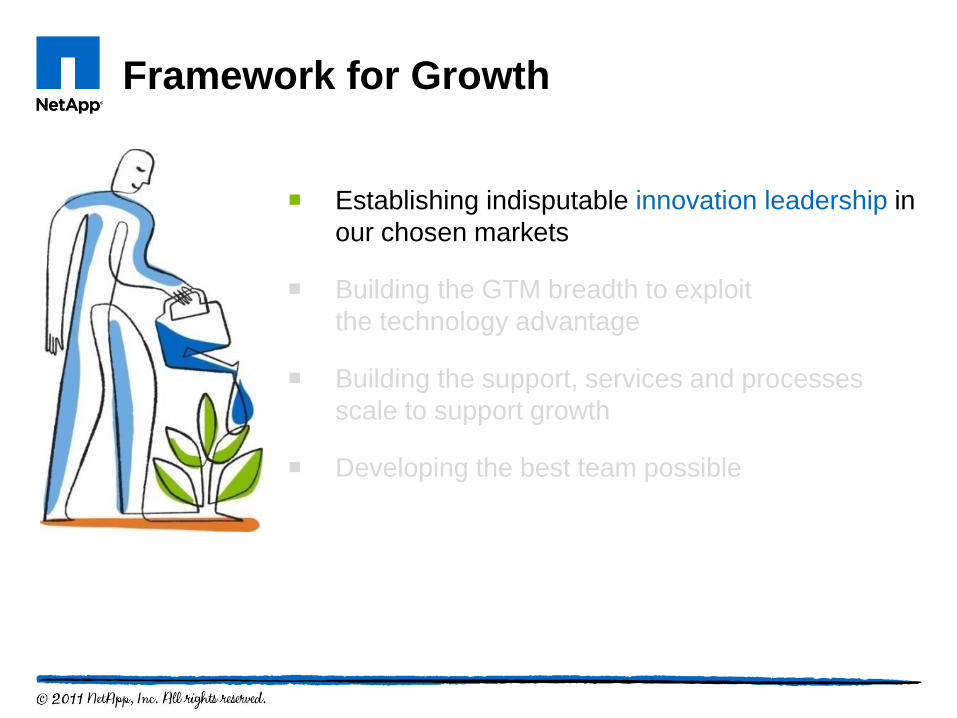
Framework for Growth

Framework for Growth
Establishing indisputable innovation leadership in
our chosen markets
Building the GTM breadth to exploit
the technology advantage
Building the support, services and processes
scale to support growth
Developing the best team possible
Framework for Growth
Establishing indisputable innovation leadership in
our chosen markets
Building the GTM breadth to exploit
the technology advantage
Building the support, services and processes
scale to support growth
Developing the best team possible

Innovation Fuels Our Growth
FY10 FY95 FY00 FY05
Revenue
Tech
Computing
Business
Applications
Storage
Efficiency
Shared Virtual
Infrastructure
File
Services
Unified
Architecture
at Scale
Private &
Public Cloud
Big Data

Framework for Growth
Establishing indisputable innovation leadership in
our chosen markets
Building the GTM breadth to exploit
the technology advantage
Building the support, services and processes
scale to support growth
Developing the best team possible

Framework for Growth
Establishing indisputable innovation leadership in
our chosen markets
Building the GTM breadth to exploit
the technology advantage
Building the support, services and processes
scale to support growth
Developing the best team possible
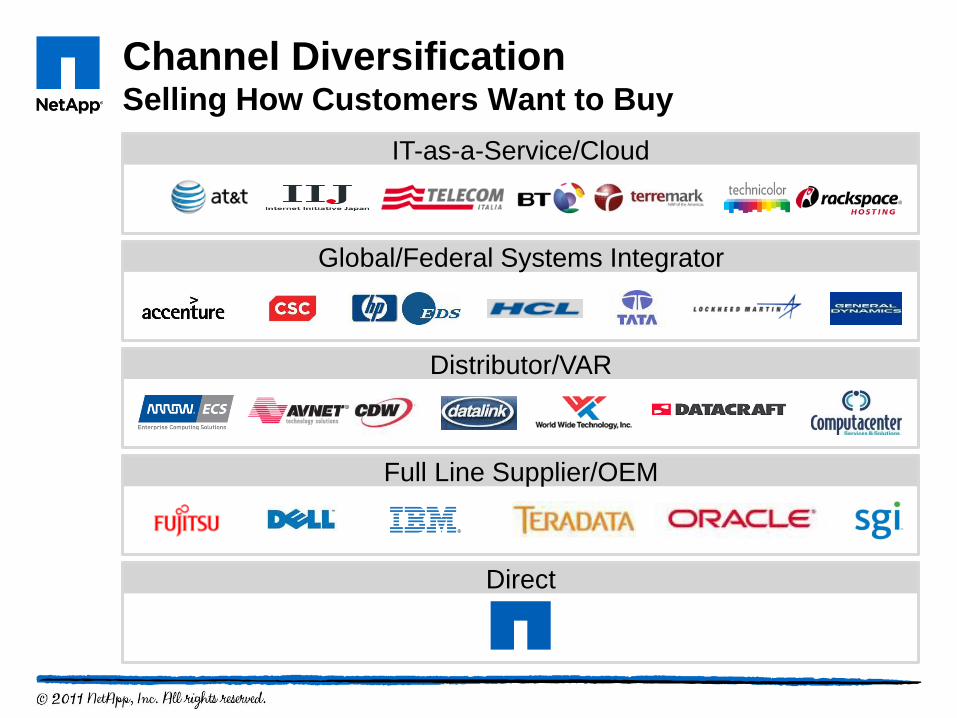
Channel Diversification Selling How Customers Want to Buy
Direct
Full Line Supplier/OEM
Distributor/VAR
Global/Federal Systems Integrator
IT-as-a-Service/Cloud

Innovation Stack
Server & Networking
Storage
Applications
Management
OS & Virtualization

Framework for Growth
Establishing indisputable innovation leadership in
our chosen markets
Building the GTM breadth to exploit
the technology advantage
Building the support, services and processes
scale to support growth
Developing the best team possible

Framework for Growth
Establishing indisputable innovation leadership in
our chosen markets
Building the GTM breadth to exploit
the technology advantage
Building the support, services and processes
scale to support growth
Developing the best team possible

Framework for Growth
Establishing indisputable innovation leadership in
our chosen markets
Building the GTM breadth to exploit
the technology advantage
Building the support, services and processes
scale to support growth
Developing the best team possible

FY’12 Priorities
Expand our market share
Drive business velocity by innovating everywhere
Strengthen our culture as a sustainable differentiator


![Strategic Planning Overview[1]](https://img.dokumen.tips/doc/110x75/553998064a7959c36e8b49bc/strategic-planning-overview1.jpg)