Embed Size (px)
Citation preview

1
Israel IT Market: STKI “tiers” 2016 V2
Dr. Jimmy SchwarzkopfResearch Fellow,STKIhttp://index.stki.info/[email protected]: 972 9 7907000
2
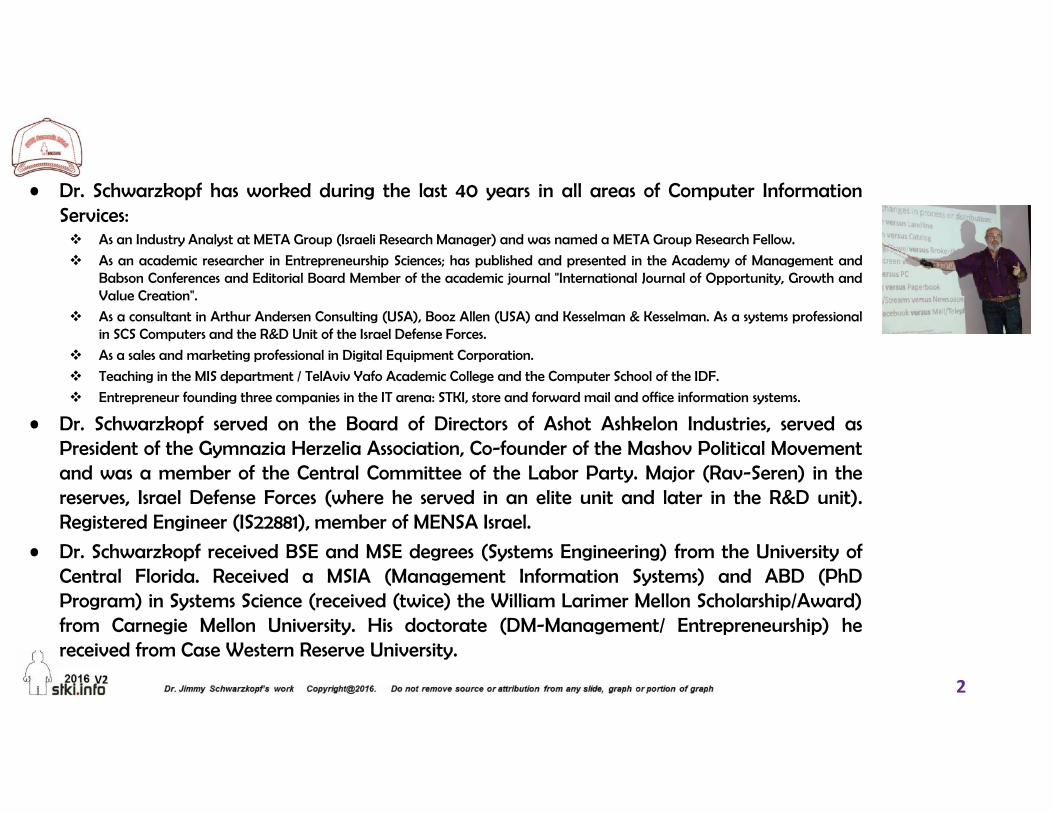
• Dr. Schwarzkopf has worked during the last 40 years in all areas of Computer InformationServices: As an Industry Analyst at META Group (Israeli Research Manager) and was named a META Group Research Fellow.
As an academic researcher in Entrepreneurship Sciences; has published and presented in the Academy of Management andBabson Conferences and Editorial Board Member of the academic journal "International Journal of Opportunity, Growth andValue Creation".
As a consultant in Arthur Andersen Consulting (USA), Booz Allen (USA) and Kesselman & Kesselman. As a systems professionalin SCS Computers and the R&D Unit of the Israel Defense Forces.
As a sales and marketing professional in Digital Equipment Corporation.
Teaching in the MIS department / TelAviv Yafo Academic College and the Computer School of the IDF.
Entrepreneur founding three companies in the IT arena: STKI, store and forward mail and office information systems.
• Dr. Schwarzkopf served on the Board of Directors of Ashot Ashkelon Industries, served asPresident of the Gymnazia Herzelia Association, Co-founder of the Mashov Political Movementand was a member of the Central Committee of the Labor Party. Major (Rav-Seren) in thereserves, Israel Defense Forces (where he served in an elite unit and later in the R&D unit).Registered Engineer (IS22881), member of MENSA Israel.
• Dr. Schwarzkopf received BSE and MSE degrees (Systems Engineering) from the University ofCentral Florida. Received a MSIA (Management Information Systems) and ABD (PhDProgram) in Systems Science (received (twice) the William Larimer Mellon Scholarship/Award)from Carnegie Mellon University. His doctorate (DM-Management/ Entrepreneurship) hereceived from Case Western Reserve University.

3
STKI’s goal is to help our clients make the right choices in the strategic and financial management
of their information technology systems.
Founded in 1992, STKI is the leading market research and strategic analyst firm in Israel, covering the IT infrastructures, IT applications and IT services industry .
Over 22 years of experience in the IT analyst sector and thousands of annual face-to-face interviews with key industry participants have enabled us to establish solid, long-standing relationships with our customers.
Our customers include major IT organizations (government, financial institutions, telecoms, manufacturing, medical, education, etc.) and IT suppliers/vendors (infrastructure and software suppliers, consulting and professional services firms).
STKI works closely with vendor senior management (strategy, business development, and marketing). Where end users are concerned, STKI meets with IT managers as well as with all levels of IT decision making,
thereby attaining complete information of processes.
STKI's mission is to advise and analyze users of information technology as well as their suppliers while conducting original research and providing advisory servicesregarding all parts of the information system puzzle.
Israel's foremost IT companies have come to rely on STKI's market-proven experience and expertise.
Our services include: Face-to-face meetings
STKI Analyst House Calls (for both users and vendors) CIO STKI "Help Desk"
Inquiries Surveys
Strategic Marketing & Positioning Round Tables for users
Vendor Discovery Series (Newsletters and workshops) In-house Workshops CIO Annual Bootcamp CTO Annual Bootcamp Brainstorming Workshops STKI Annual Summit

4

5
6
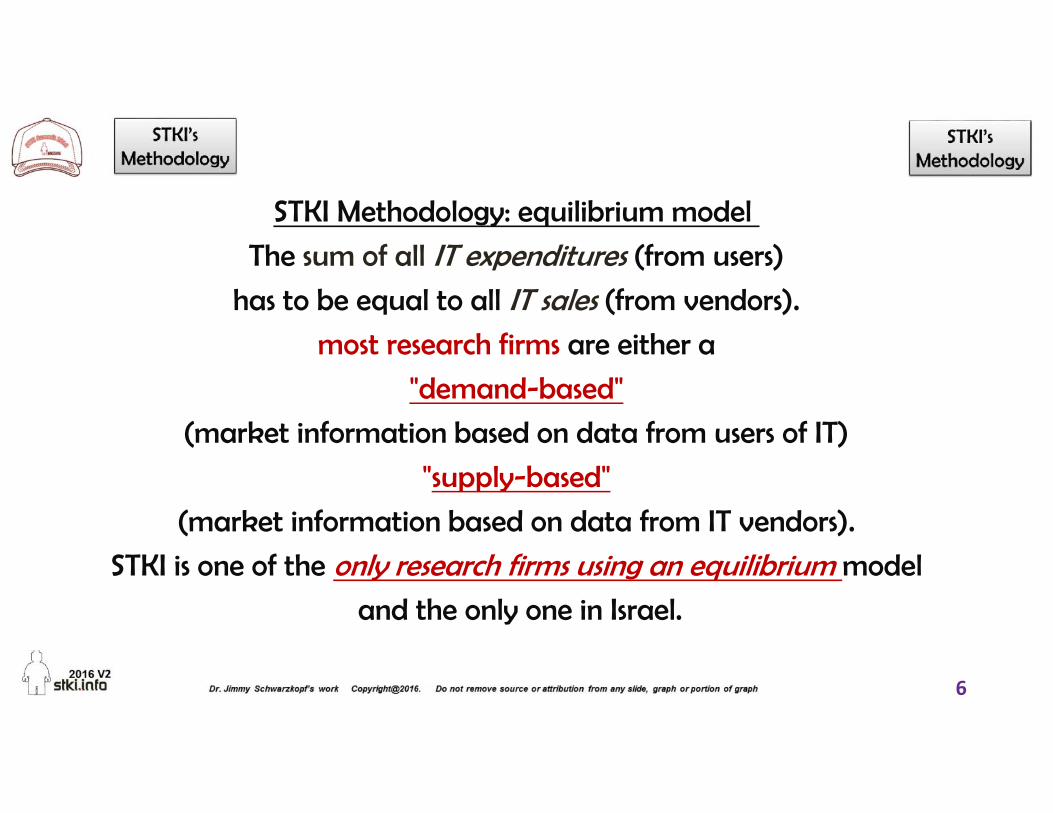
STKI Methodology: equilibrium model
The sum of all IT expenditures (from users)
has to be equal to all IT sales (from vendors).
most research firms are either a
"demand-based"
(market information based on data from users of IT)
"supply-based"
(market information based on data from IT vendors).
STKI is one of the only research firms using an equilibrium model
and the only one in Israel.

7
› Real revenues of software licenses and maintenance.
› Real revenues of hardware sales.
› Differentiation between new projects and continuing projects. New projects count more.
› We do not include any work/ products for OEMs and military non-IT projects.
› We are learning how to account for cloud usage for IT (Israel) only
› We distinguish between work done by the vendor's employees and work outsourced toanother vendor. The revenue is transferred to the vendor actually doing the work.
› Distinguish revenues from projects done in fixed price, cost plus (SLA defined) and staffaugmentation (non SLA) projects.
› Differentiate value between work done by high level internal professionals in a projectand staff augmentation employees in the clients IT department.
Take into consideration IT department’s view/mindshare ofvendor’s value in projects/products
What our study looks at:

STKI Summit 2016Israeli IT Market
8

9
Global Information TechnologyReport 2015

10
Israel 2016

11

12
Israel Economic Sentiment Chart
THE BUSINESS CONFIDENCE INDEXincreased from 15.8 in January to 17.7 in
February
THE CONSUMER CONFIDENCE INDEXincreased from minus 17.5 in December to
minus 16.0 in January
Both indexes have the highest readingsin over four years.

13
Economy improves significantly in Q4 2015
In annual terms, GDP expanded 2.7% in Q4,up from the 2.5% in Q3.
The Central Bankexpects GDP to grow 2.8% in 2016 and 3.1%in 2017.
Focus Economics ConsensusForesee GDP to grow 3.0% in 2016 and 3.3%in 2017.
Israel GDP Chart

14
State of the Economy Index

15
State of the Economy Index (% change*) 4/2014 - 4/2016
2-3 Q 2014

16
Over 65% is BAD

17

18
Israel Business Confidence Survey

STKI Summit 2016Israeli IT Market
19

20
Number of Firms in Israel 1/2016

21
Number of Firms in Israel 1/2016

22
In order to get the “IT Market” (what is bought/sold out there) :
What users bought?From whom?Why?
IT Departments IT Vendors
How much did they sell?To whom?
For how much?Competitors?
24 years ofIT market history
2013
2014
HARDWARE1,69
4,000
3.61%
1,755,20
0
SOFTWARE
1,350,20
06.72
%1,44
1,000
VALUE ADDED
SERVIC
ES
3,126,00
04.48
%3,26
6,000
TOTAL
6,172,21
34.73
%6,46
4,214

23

24

25
industrySTKI ITMarketHealthIndex
STKI ITMarketHealthIndex
STKI ITMarketHealthIndex
STKI ITMarketHealthIndex
STKI ITMarketHealthIndex
government $1,350 $1,250 $1,310 $1,350 $1,500education $250 $230 $235 $230 $260
health $300 $290 $275 $290 $320banks $900 $815 $835 $850 $800
insurance $350 $400 $425 $430 $400fin other $200 $190 $215 $245 $246
STKI IT MarketHealth Index
Budgets 2013 Budgets 2014 Budgets 2015Budgets
2016
2012 2013 2014 2015 2016
$1,525
$1,770
79.38%
$1,405$1,450
76.32%
$1,820
$1,475
81.04%
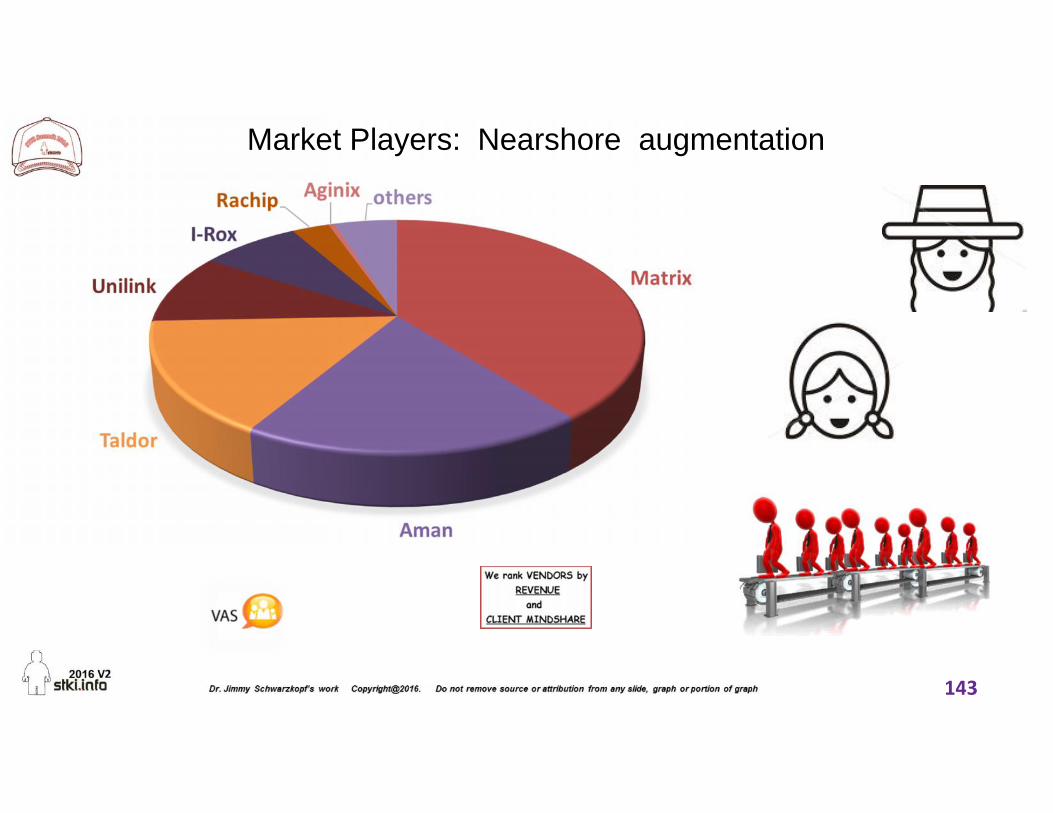
$1,446
81.55%
STKI IT Market Health Index
$2,080$1,870$1,900
69.52%
Budgets 2012industrySTKI ITMarketHealthIndex
STKI ITMarketHealthIndex
STKI ITMarketHealthIndex
STKI ITMarketHealthIndex
STKI ITMarketHealthIndex
government $1,350 $1,250 $1,310 $1,350 $1,500education $250 $230 $235 $230 $260
health $300 $290 $275 $290 $320banks $900 $815 $835 $850 $800
insurance $350 $400 $425 $430 $400fin other $200 $190 $215 $245 $246
STKI IT MarketHealth Index
Budgets 2013 Budgets 2014 Budgets 2015Budgets
2016
2012 2013 2014 2015 2016
$1,525
$1,770
79.38%
$1,405$1,450
76.32%
$1,820
$1,475
81.04%
$1,446
81.55%
STKI IT Market Health Index
$2,080$1,870$1,900
69.52%
Budgets 2012
26

27
Client inquiries (STKI) FY 2014-15 shifting

28
Client inquiries (STKI) FY 2014-15 shifting

29
Tri-Modal IT Consequences
IT Centric Business Centric Customer Centric

30
IT Budget
Divisions Transfer Budget
P/L software vendor
MFcomputing
Hybridcomputing
SaaS delivery
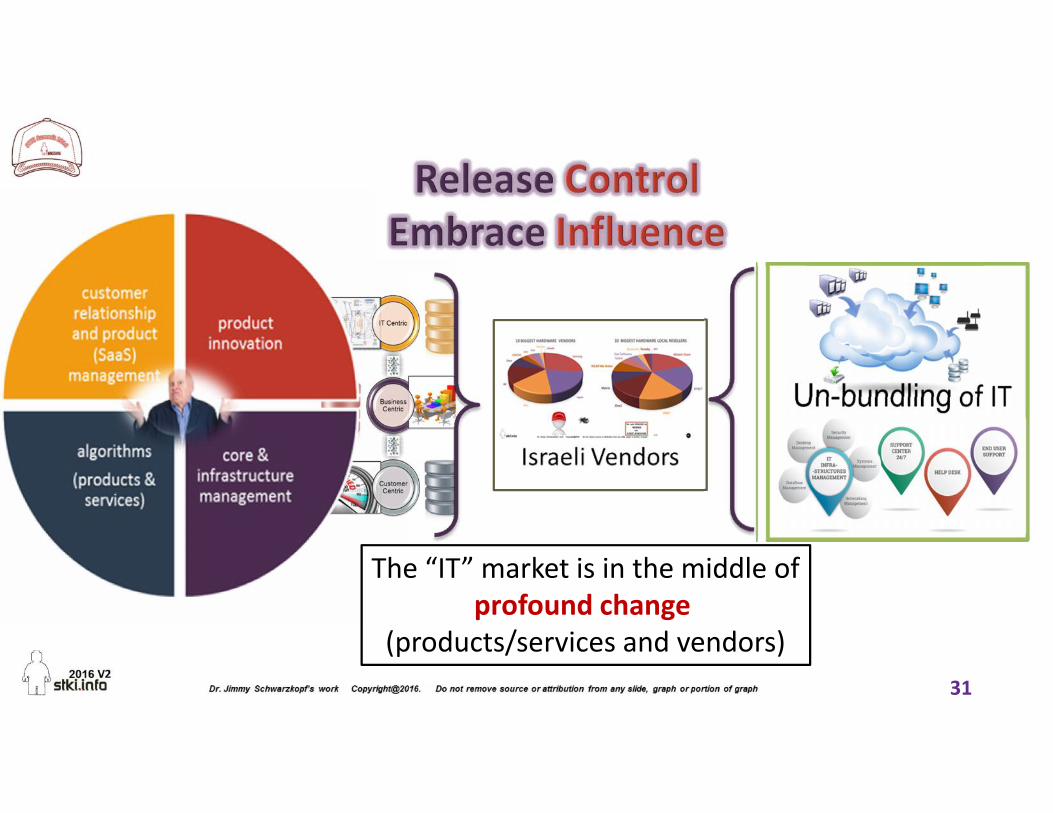
31
The “IT” market is in the middle ofprofound change
(products/services and vendors)

STKI Summit 2016Israeli IT Market
2015 Israel IT Market
32

33
The Great Debate: explanations
Even if thegraphs “look”
different
“not worse”just smaller“boutique”
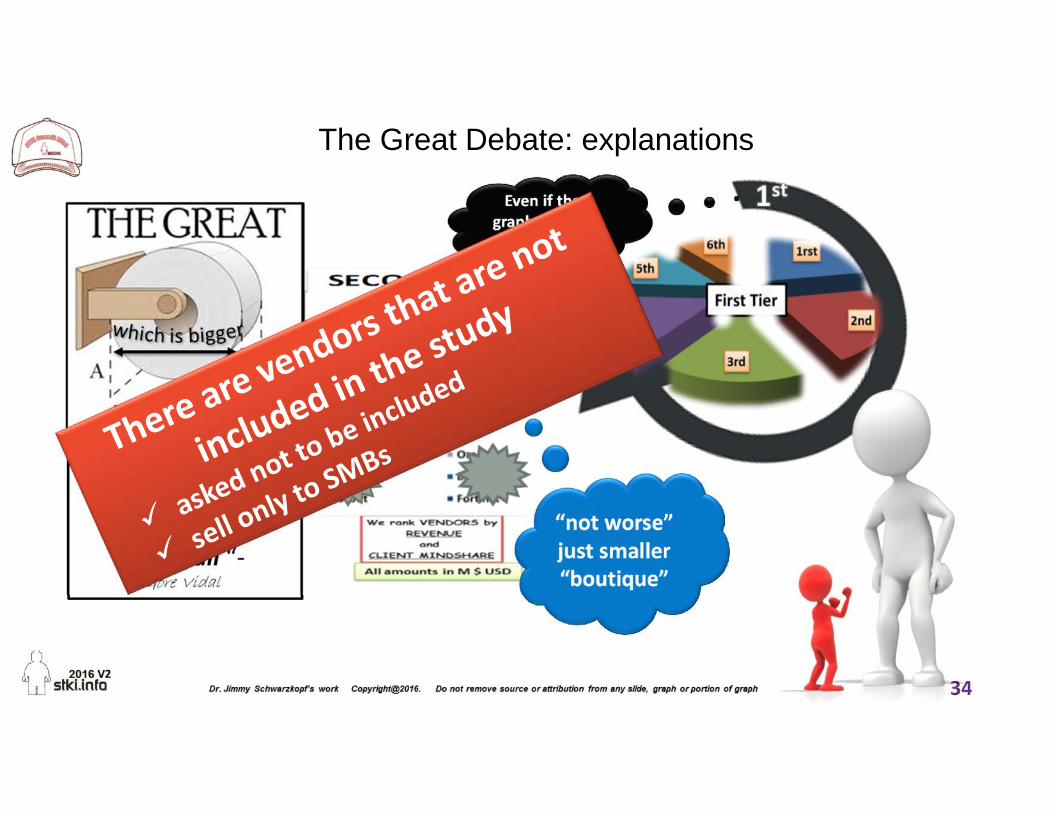
34
The Great Debate: explanations
Even if thegraphs “look”
different
“not worse”just smaller“boutique”

35
VARs or Partners:NO double bookings for IT market size forecasts
Value Added Resellers“VAR or Partners”
are incorporated intoSTKI’s “TIERS”.
Both sell into the IsraeliMarket.

36
Products “sold” on the cloudSTKI “books” in on-premises software categoriesNO double bookings for IT market size forecasts

37
IT Market in Israel

STKI Summit 2016Israeli IT Market
2015 Israel Hardware Market
38

39
Vendors: Hardware markets

40
Israel: IT Hardware Total Market 2014-2016
HARDWARE

41
Hardware: Servers and Clients

42
Server Markets

43
Market Players: Servers (manufacturers)
DB/DW, CONVERGED HW& OTHER APPLIANCES
44
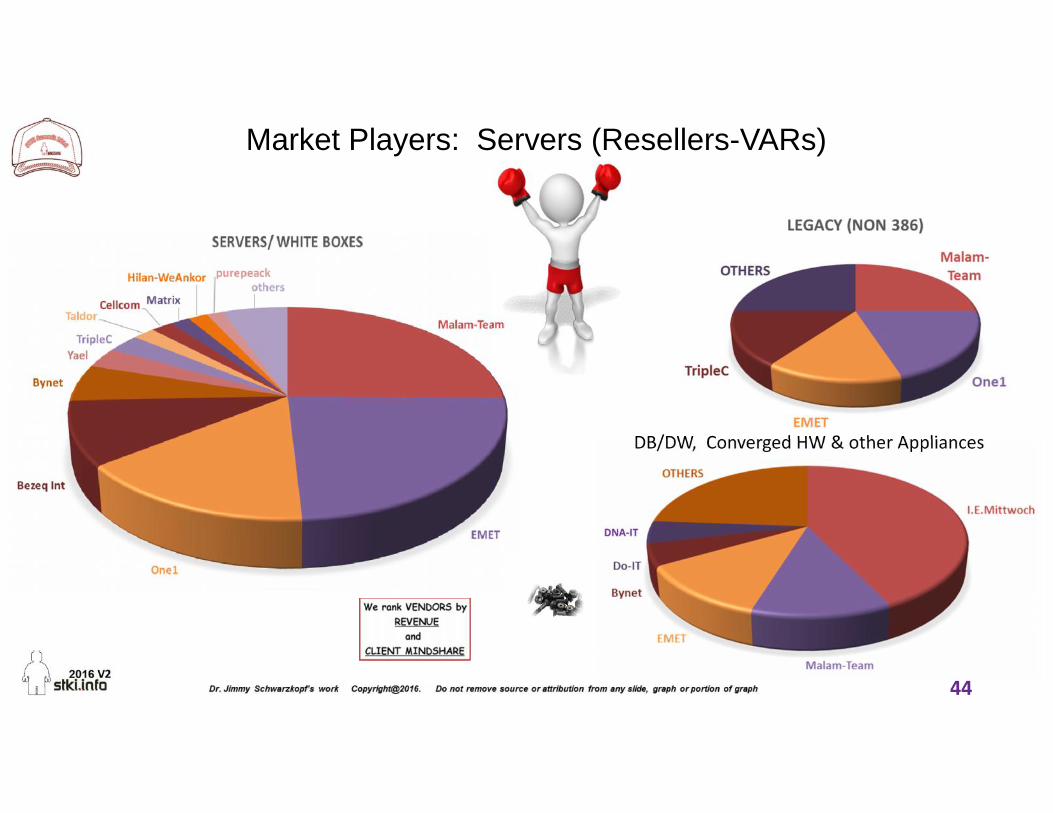
Market Players: Servers (Resellers-VARs)
DB/DW, Converged HW & other Appliances

45
Clients (B2B) Markets

46
Market Players: Client Computing (manufacturers) B2B

47
Market Players: Personal Computing (VARs)

48
Hardware : storage, networking and security

49
Storage and Networking Markets
storage 2014 2015 2016 2017 2018Disks (HDD and SSD) 135,000 -3.70% 130,000 -3.08% 126,000 -2.38% 123,000 -2.44% 120,000
VTL Backup and otherStorage Appliances
29,000 -3.45% 28,000 -7.14% 26,000 -3.85% 25,000 -4.00% 24,000
Tape Libraries 11,000 -4.55% 10,500 -4.76% 10,000 -10.00% 9,000 0.00% 9,000
total 175,000 -3.71% 168,500 -3.86% 162,000 -3.09% 157,000 -2.55% 153,000
networking 2014 2015 2016 2017 2018Enterprise Networking 205,000 0.98% 207,000 1.93% 211,000 -2.84% 205,000 -2.44% 200,000
Security / Cyber 95,000 10.53% 105,000 14.29% 120,000 8.33% 130,000 3.85% 135,000
VoIP/Call Center Equipment 55,000 -9.09% 50,000 -4.00% 48,000 -6.25% 45,000 -4.44% 43,000
total 355,000 1.97% 362,000 4.70% 379,000 0.26% 380,000 -0.53% 378,000

50
Market Players: “storage” (manufacturers)
Disks (HDD and SSD)
VTL Backup, Storage Appliances & networking
Tape Libraries
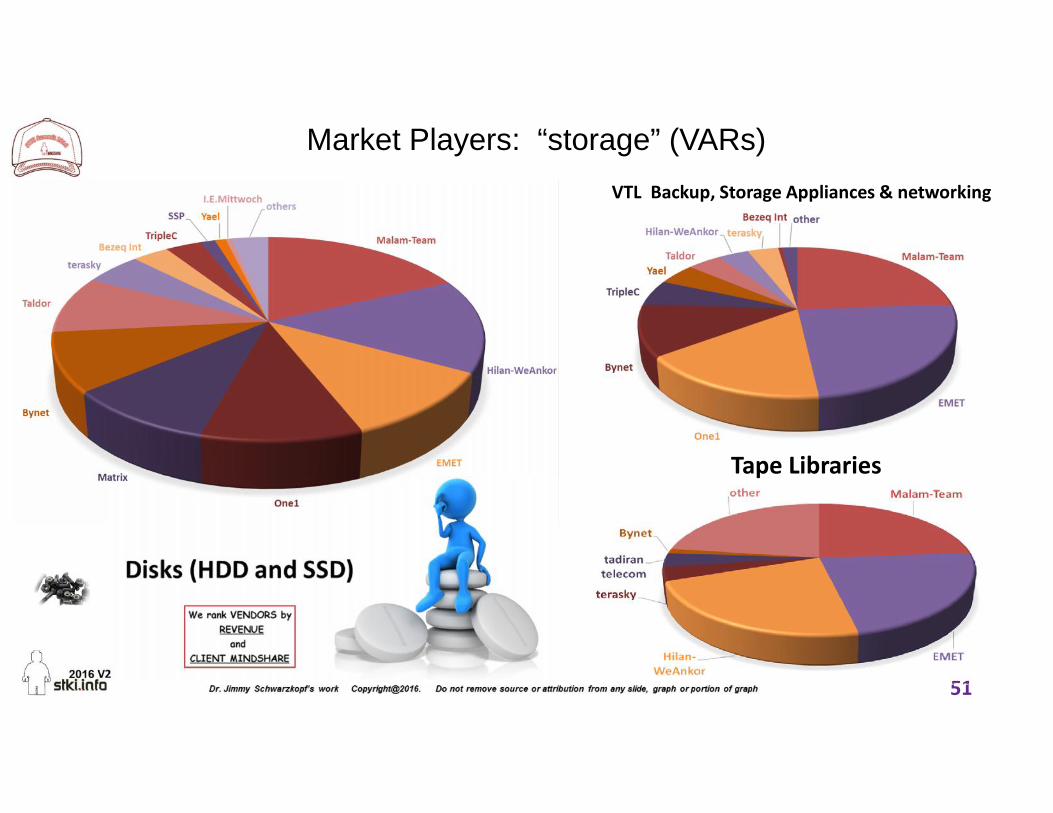
51
Market Players: “storage” (VARs)
Tape Libraries
VTL Backup, Storage Appliances & networking

52
Market Players: Networking Products

53
Market Players: Security Appliances

54
Market Players: VoIP & other call center equipment

55
Hardware: printers, monitors, self-service and data center

56
Printers, Monitors, DC Equipment, Self Service Markets
57
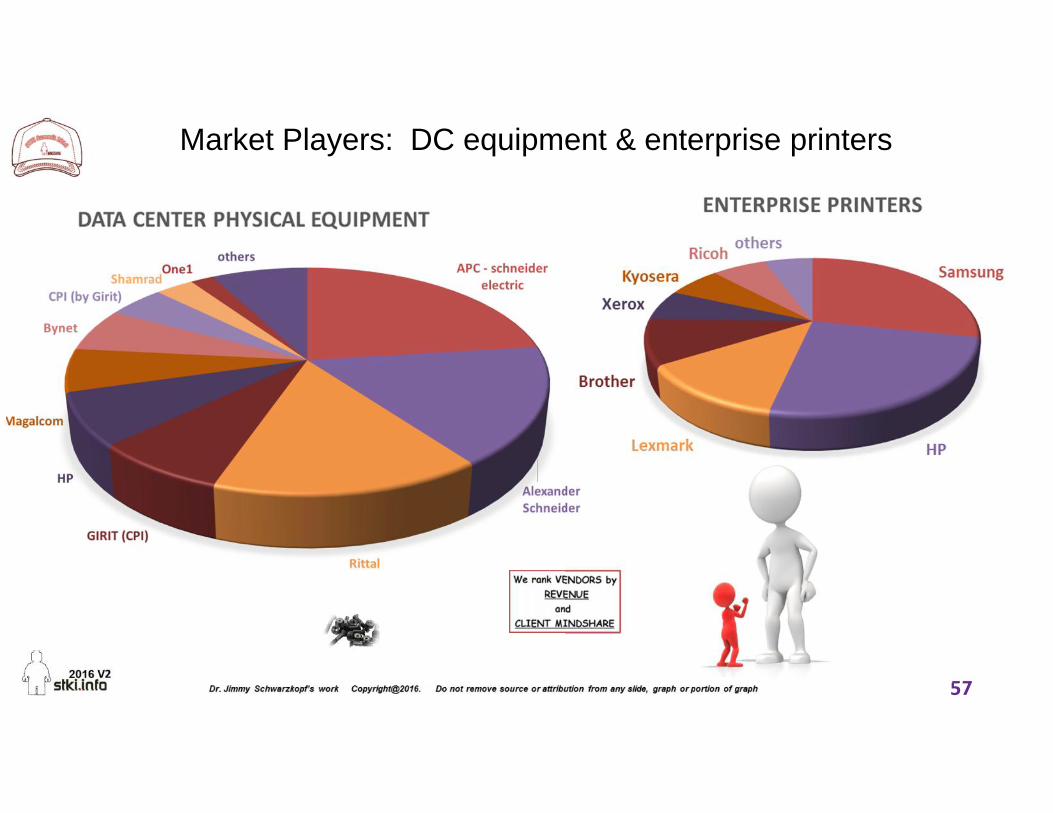
Market Players: DC equipment & enterprise printers

58
Market Players: POS ,Self-Service, monitors and Video Systems

STKI Summit 2016Israeli IT Market
59
2015 Israel Software Market

60
Vendors that sell in the Software markets

61
Israel: IT Software Total Market 2014-2018
SOFTWARE
1,515,500 4.39% 1,582,000 4.42% 1,652,000 4.36% 1,724,000 4.76% 1,806,000
2017 changes 2018changes2014 changes 2015 changes 2016

62
Delivery and Development Software

63
Infrastructure and Middleware Software

64
Market Players: system software

65
Market Players: Storage and Backup Software

66
Market Players: Data Bases, Cloud and Automation Tools

67
Market Players: Middleware Software

68
Delivery and Development Software
e
69
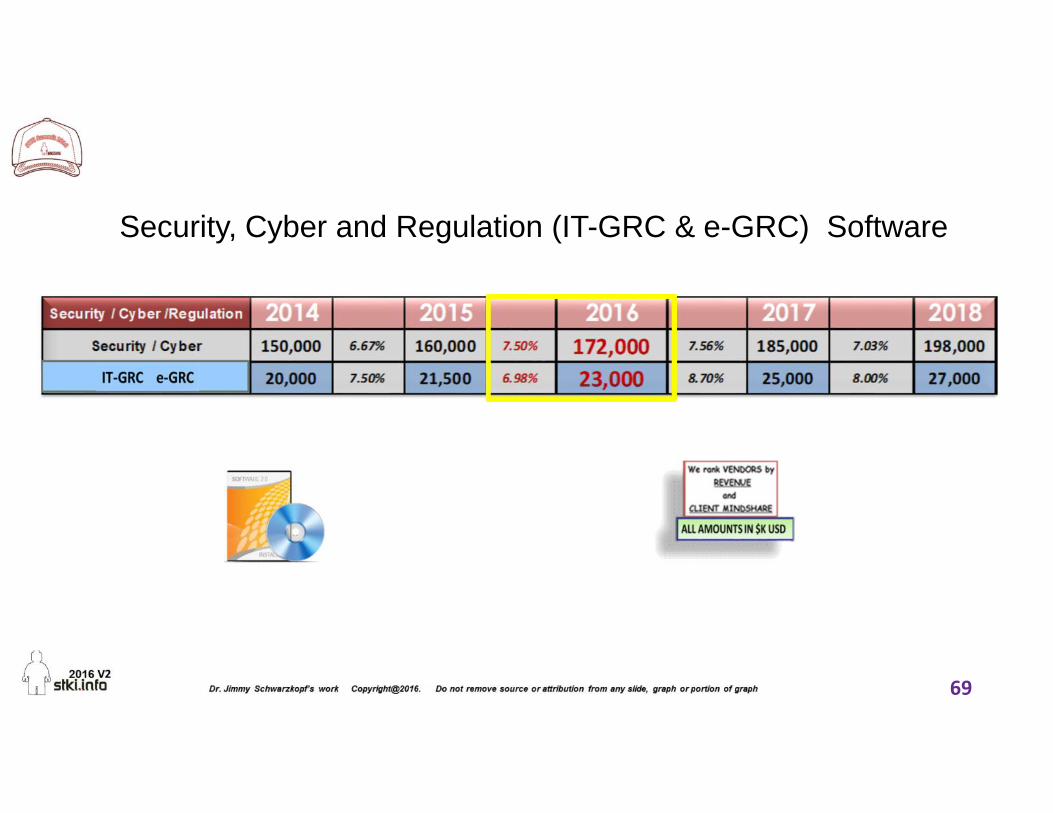
Security, Cyber and Regulation (IT-GRC & e-GRC) Software

70
Market Players: project, portfolio, governance, risk and compliance software

71
Market Players: Development & ALM Software

72
Market Players: BSM Software
73
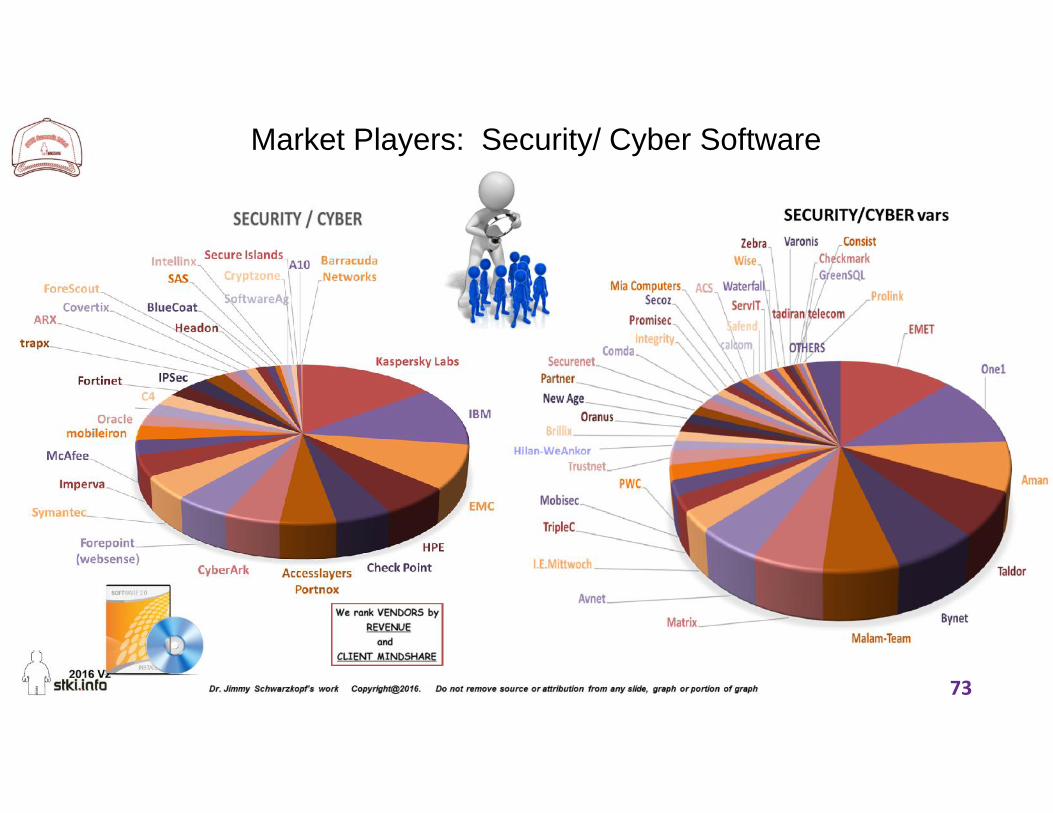
Market Players: Security/ Cyber Software

74
Software: Information Management

75
Software: Information Management Markets

76
Market Players: KM Tools

77
Market Players: Collaboration and Output Software

78
Market Players: Analytics & Data Mgmt Software

79
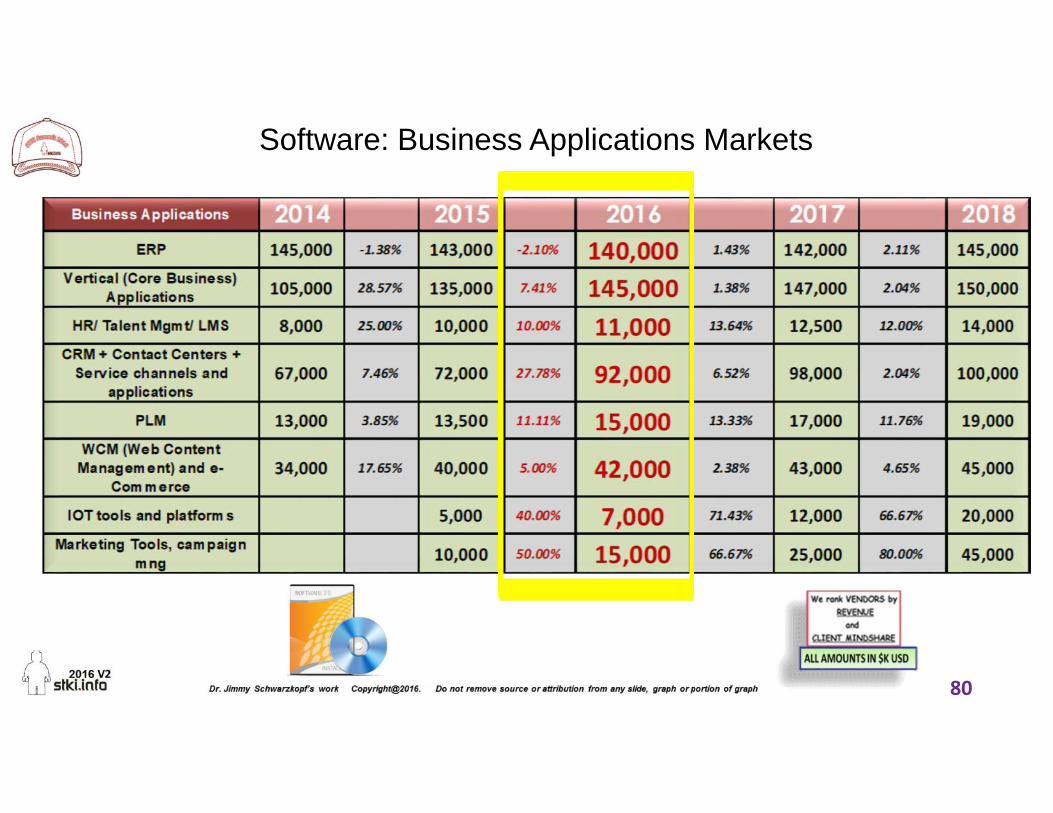
Software: Business Applications
80
Software: Business Applications Markets

81
Market Players: ERP Software (all sizes)

82
Market Players: Vertical Application Software
83
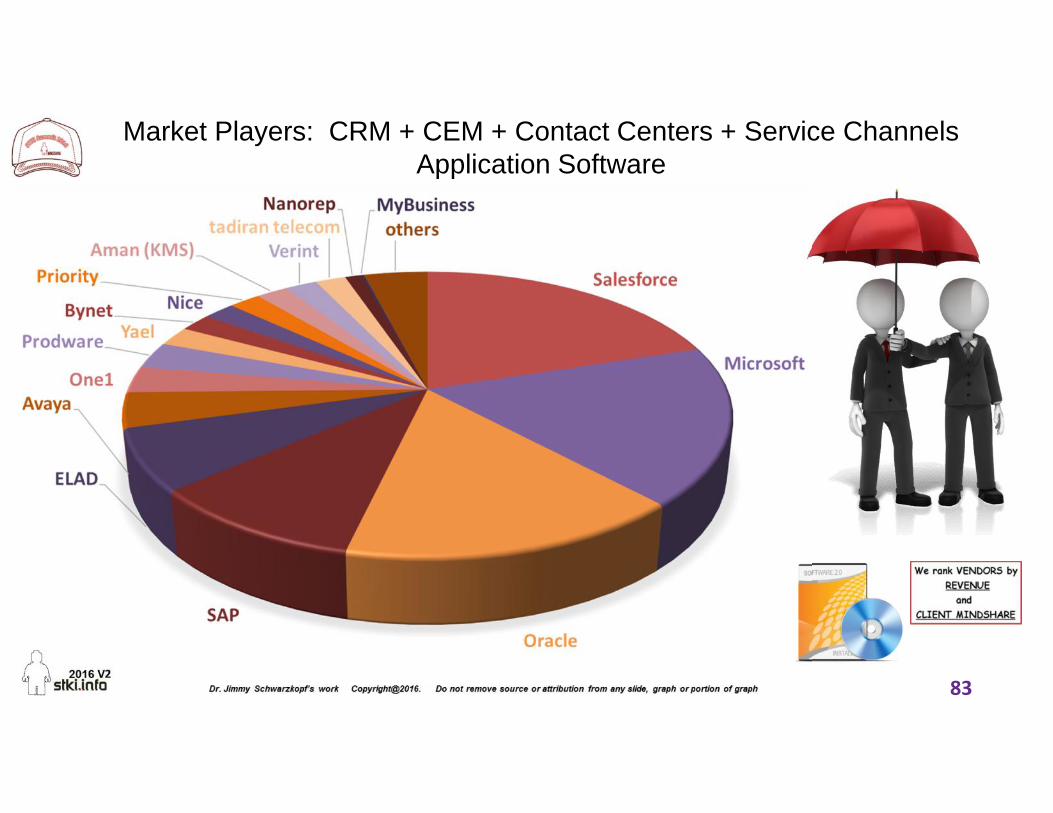
Market Players: CRM + CEM + Contact Centers + Service ChannelsApplication Software

84
Market Players: HR /Talent Mgmt/ LMS Software

85
Market Players: Marketing, WCM and e-commerce software
Marketing Tools .. Campaign Management

STKI Summit 2016Israeli IT Market
86
87
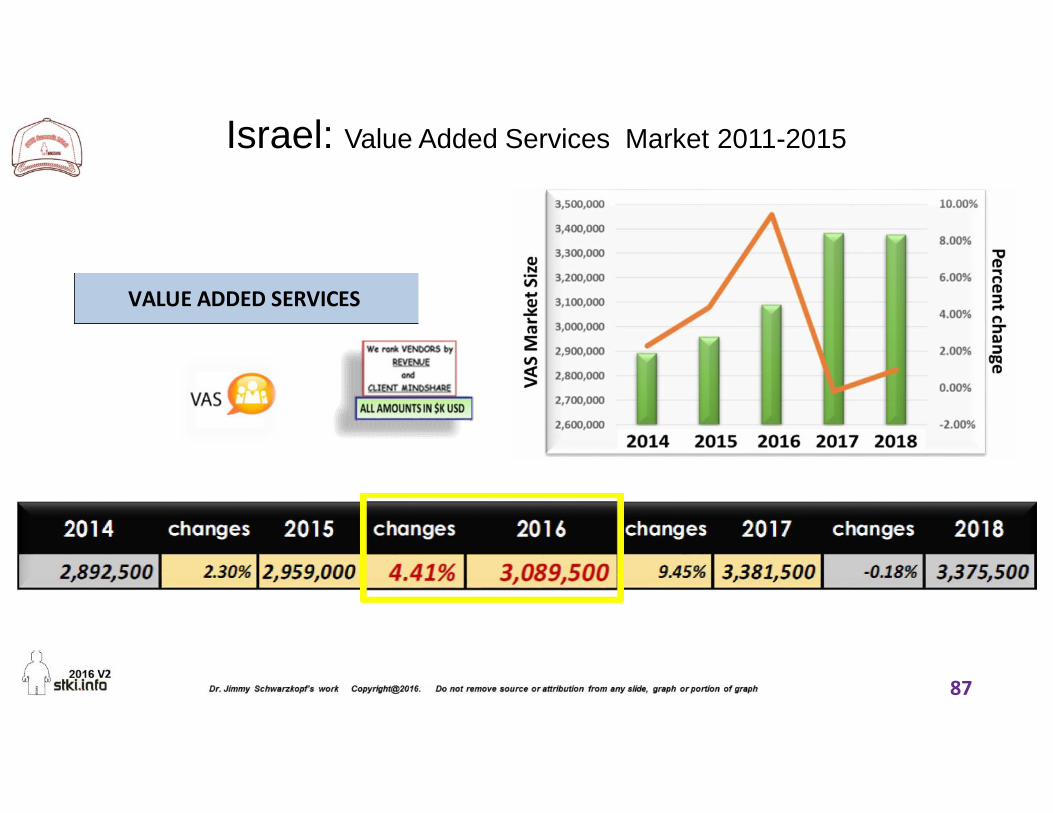
Israel: Value Added Services Market 2011-2015
VALUE ADDED SERVICES

88
Vendors that sell in the VAS markets

89
The SIX categories of IT Value Added Services Offered in Israel
90
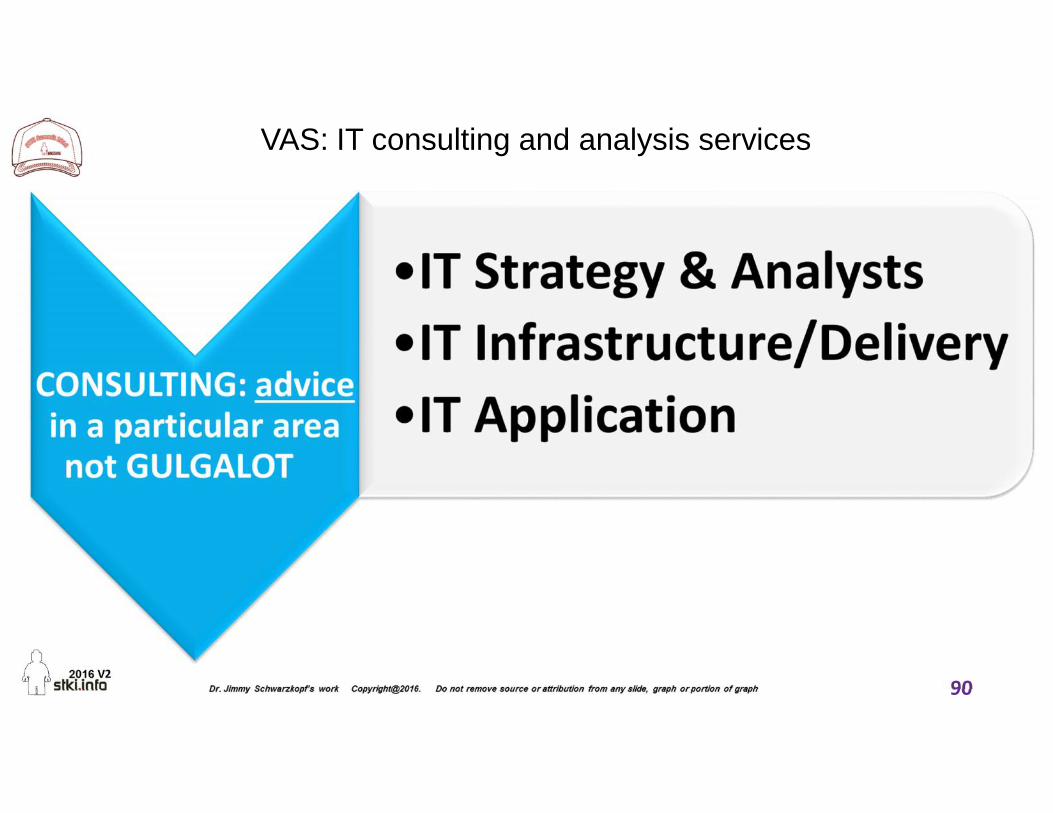
VAS: IT consulting and analysis services

91
VAS: IT consulting and analysis services

92
Market Players: IT Consulting
Consulting: IT Strategy / Digital Innovation/ Industry Analysts Consulting: IT Infrastructure/ Delivery (on-premises & cloud)

93
Market Players: IT Consulting 2Consulting: IT Business Applications (ERP, CRM, BI…)

94
VAS: Hardware & Software Maintenance Services

95
VAS: Hardware Maintenance Services

96
Market Players: Hardware Maintenance Services

97
VAS: Infrastructure Projects

98
VAS: Infrastructure Projects

99
Market Players: hardware integration projectsConsolidation/ Virtualization /Monitoring/ BSM/ Storage/Hardware/ Data Center Environment/ Networking Projects

100
Market Players: software integration and legacy projects
Software integration, middleware, SOA, BPM, ALM,Testing tools, DevOps

101
Market Players: Security Projects

102
Market Players: Unified Communication (IM,Video,Voice) projects

103
VAS: Project Management, training and “Hatmaa” services

104
VAS: Project Management, training and “Hatmaa” services

105
Market Players: Office of the CIO Projects

106
Market Players: ALM, Q/A & Testing Projects

107
Market Players: Training Services

108
Market Players: “Hatmaa” Projects

109
VAS: contact center & EGRC Projects

110
VAS: contact center & eGRC & IT-GRC Projects

111
Market Players: Risk & GRC Projects

112
Market Players: VoIP- Call Center Projects

113
VAS: Business Application Implementation

114
VAS: Business Application Implementation

115
Market Players: ERP Projects

116
Market Players: Core / ERP vertical Projects

117
Market Players: CRM,Marketing and social (on-premises & cloud)

118
Market Players:Knowledge Management (ECM, Portals, LMS)
119
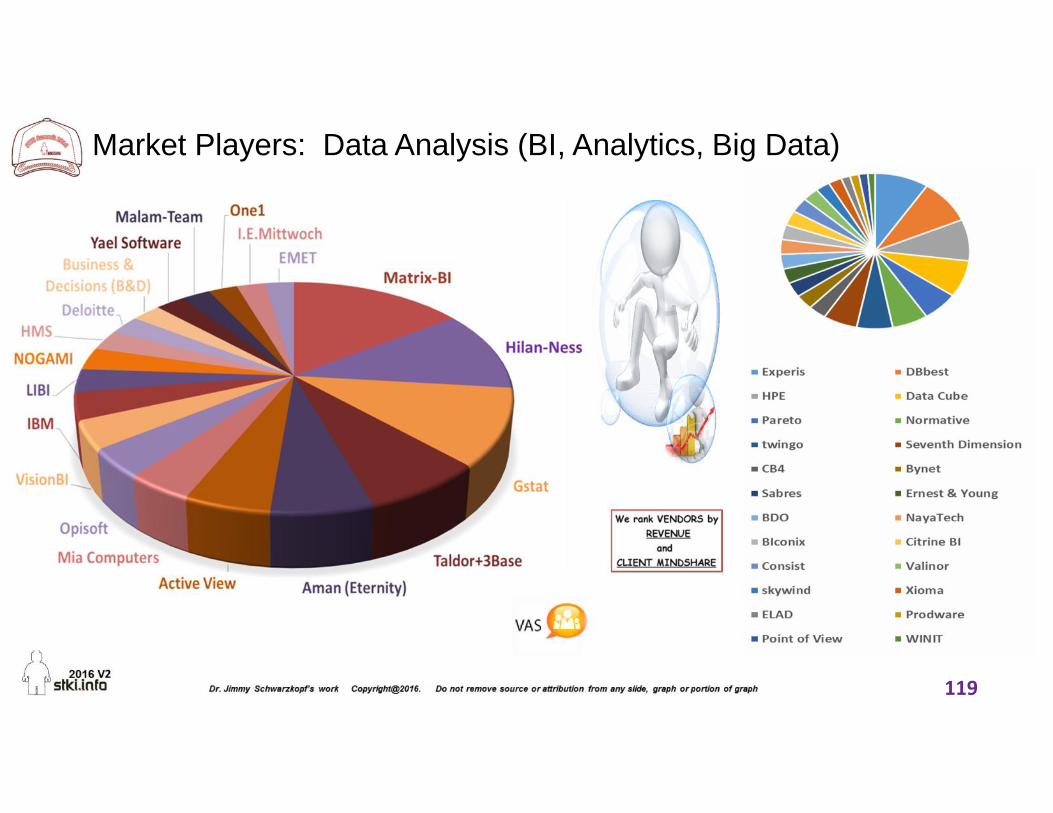
Market Players: Data Analysis (BI, Analytics, Big Data)

120
Market Players: Application development (on-premises & cloud)

121
Market Players: Web Accessibility

122
Market Players: Migration Projects
123
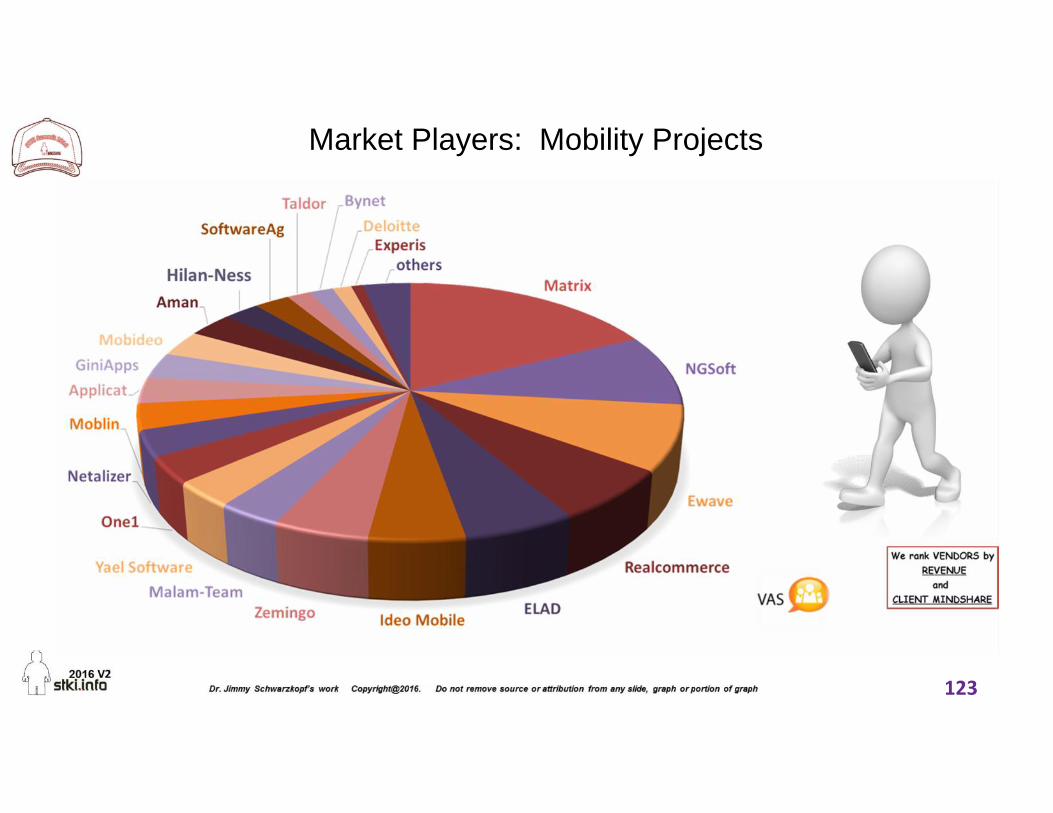
Market Players: Mobility Projects

124
Market Players: IoT and UX Projects
IoT (enterprise) ProjectsUX Design

125
VAS: outsourcing services

126
VAS: outsourcing services

127
Market Players: "off site" data center

128
Market Players: help desk outsourcing

129
Market Players: complete outsourcing
129

130
Market Players: application cost-plus (managed services,third party software maintenance, others)

131
Market Players: application SLA based (managed services, third partysoftware maintenance, others)

132
Market Players: Infrastructure cost-plus (managed services, storage,DBA services, third party maintenance, others)

133
Market Players: Market Players: Infrastructure SLA based (managed services,storage, DBA services, third party maintenance, others)

134
VAS: Cloud Services

135
VAS: Cloud Services

136
Market Players: BSaaS (many different) B2B Services

137
Market Players: PaaS & IaaS Services
* partners

138
Market Players: SaaS Services

139
Market Players: DRaaS Services

140
VAS: Staff Augmentation

141
VAS: Staff Augmentation
141

142
Market Players: “gulgalot”- temps- on premises augmentation
143
Market Players: Nearshore augmentation

144
http://index.stki.info/it-tiering/