Embed Size (px)
Citation preview
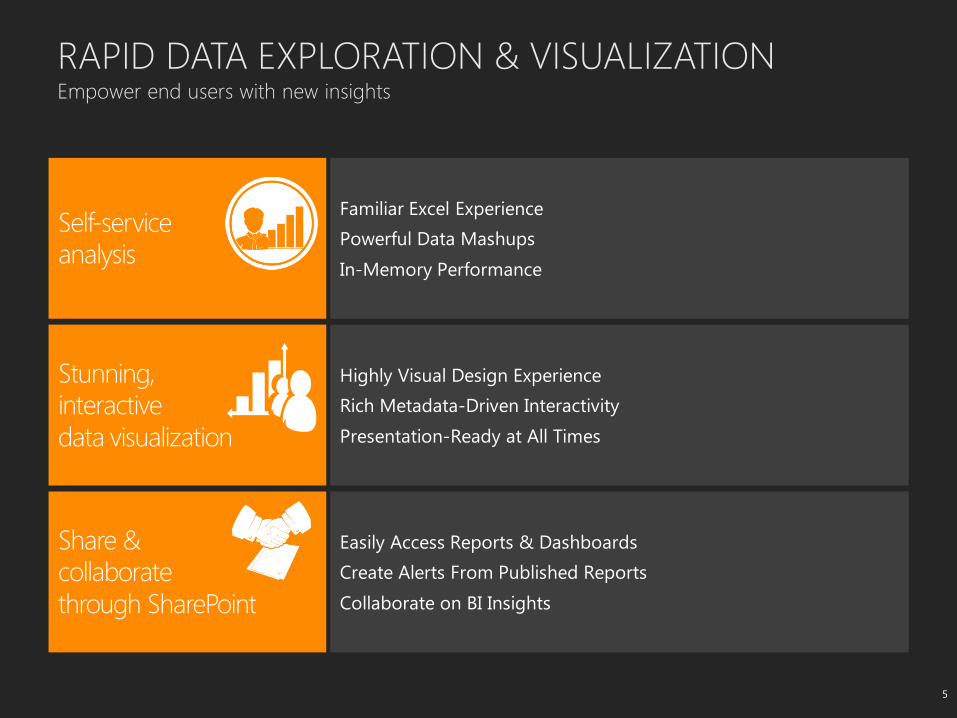
RAPID DATA EXPLORATION IN EXCEL
Breakthrough Insight
THE FANTASTIC 12 OF 2012
4 3 2 1
11 12 10 9
8 5 7 6
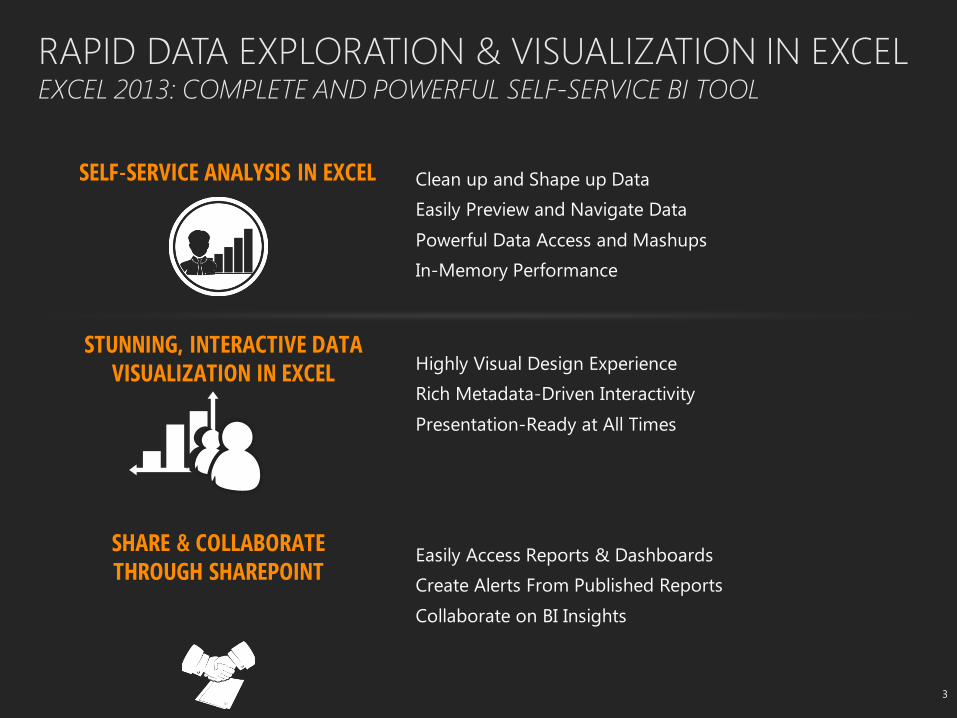
RAPID DATA EXPLORATION & VISUALIZATION IN EXCEL EXCEL 2013: COMPLETE AND POWERFUL SELF-SERVICE BI TOOL
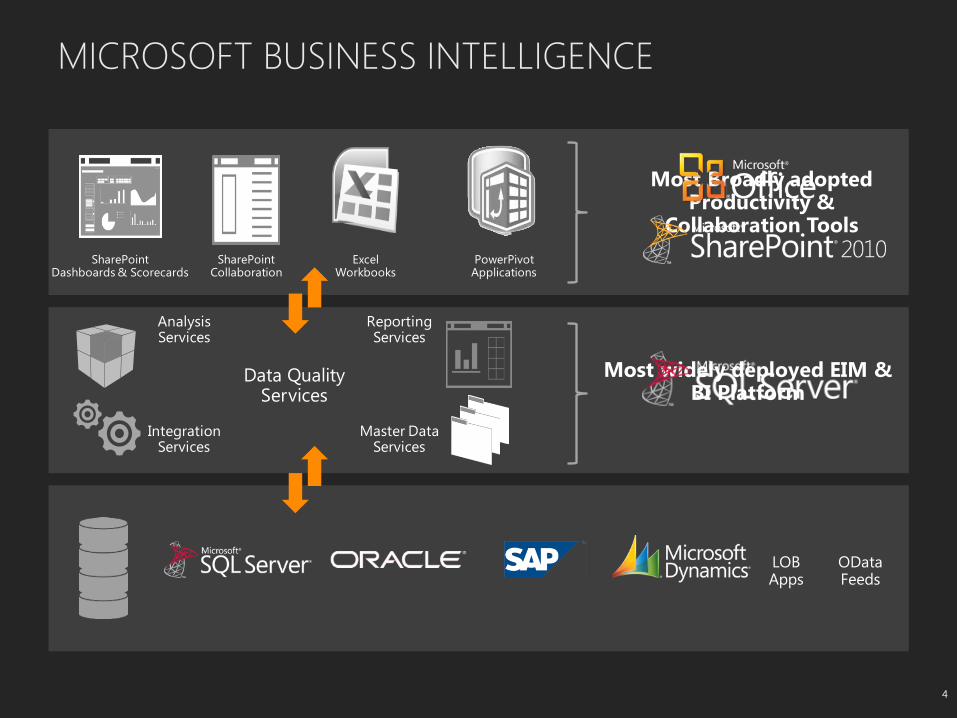
WHY MICROSOFT SELF-SERVICE BI
for Ability to Execute
BI platform
• Familiar tools and
• Extensive
confidence
to hundreds of terabytes
to
WHY MICROSOFT SELF-SERVICE BI
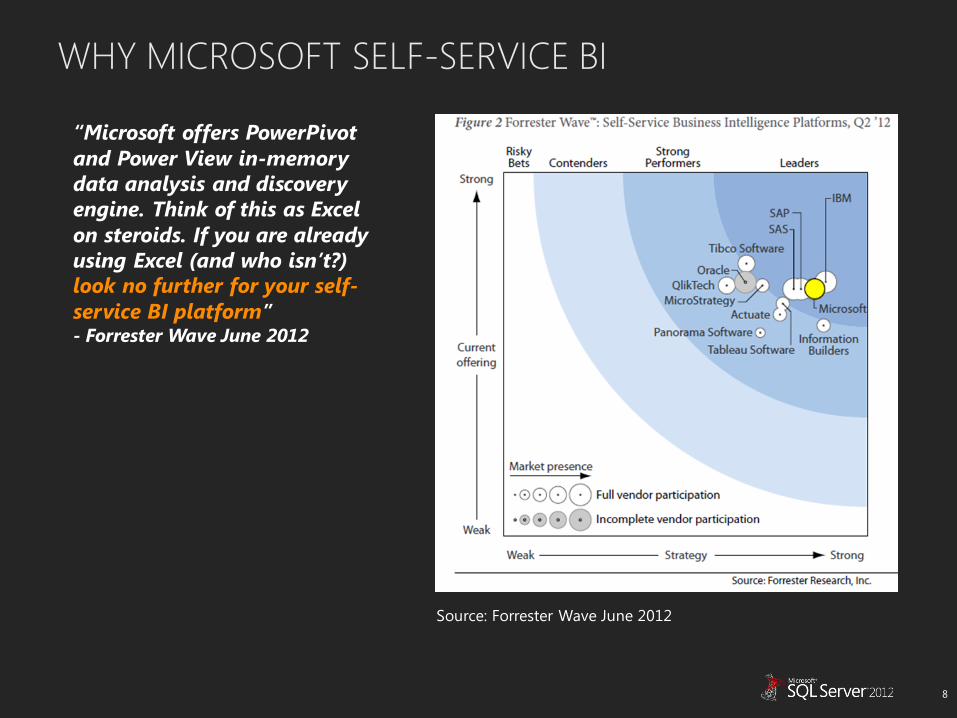
Source: Forrester Wave June 2012
“Microsoft offers PowerPivot
and Power View in-memory
data analysis and discovery
engine. Think of this as Excel
on steroids. If you are already
using Excel (and who isn’t?)
” - Forrester Wave June 2012
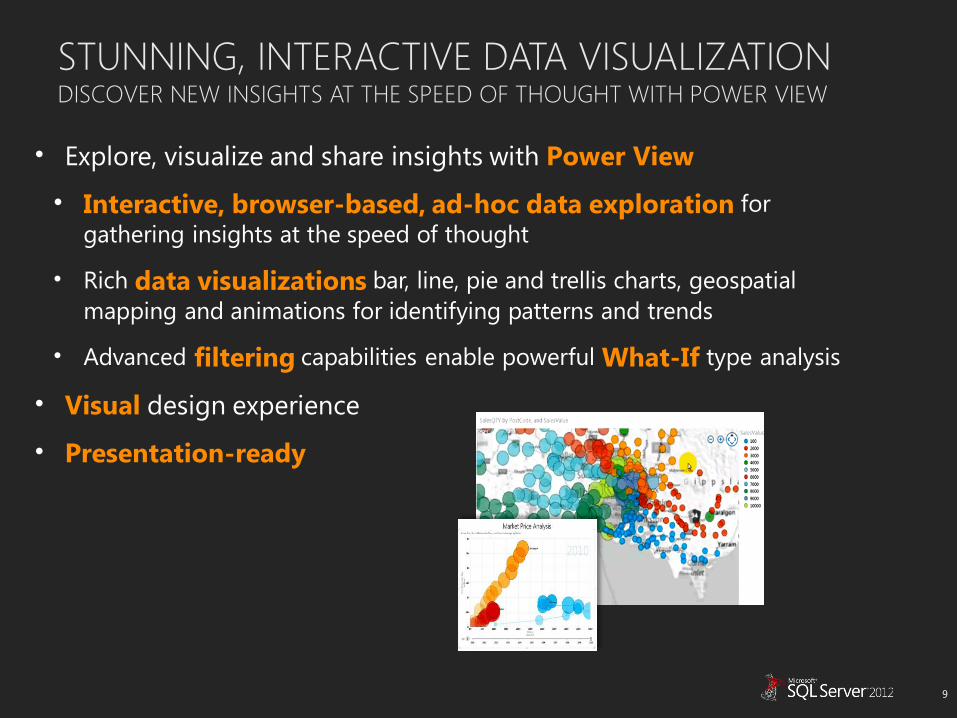
STUNNING, INTERACTIVE DATA VISUALIZATIONDISCOVER NEW INSIGHTS AT THE SPEED OF THOUGHT WITH POWER VIEW
• Explore, visualize and share insights with Power View
• Interactive, browser-based, ad-hoc data exploration for
gathering insights at the speed of thought
• Rich data visualizations bar, line, pie and trellis charts, geospatial
mapping and animations for identifying patterns and trends
• Advanced filtering capabilities enable powerful What-If type analysis
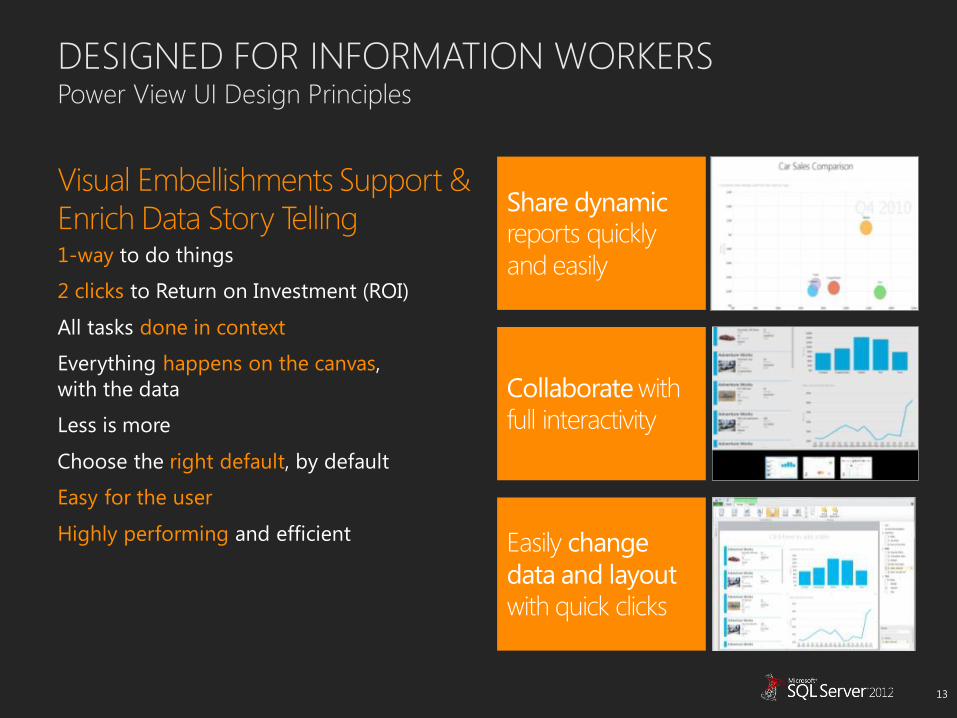
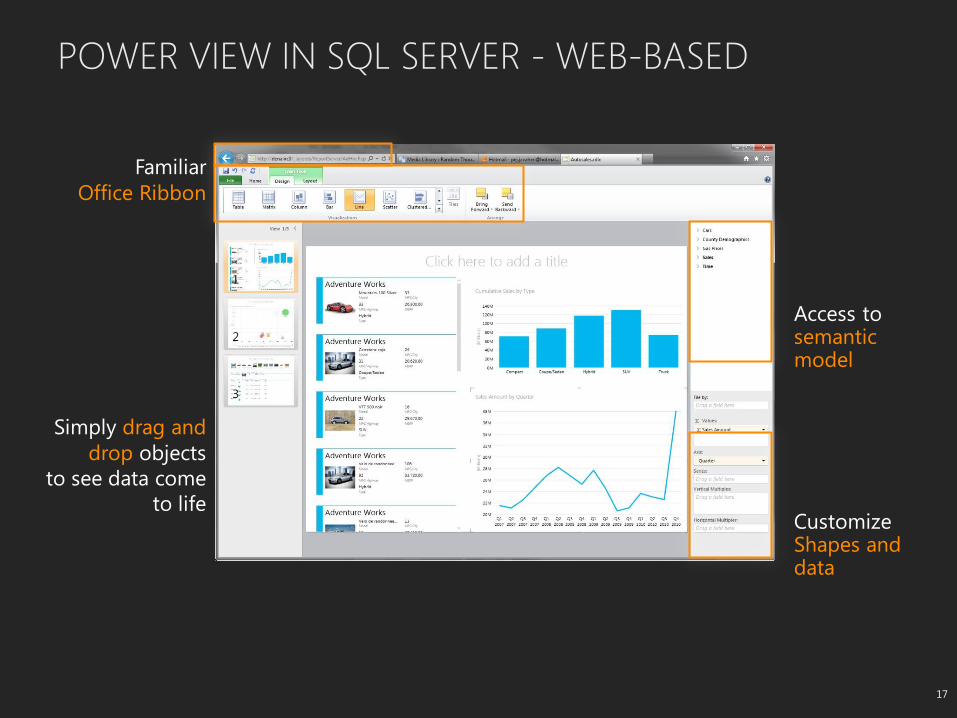
• Visual design experience
• Presentation-ready
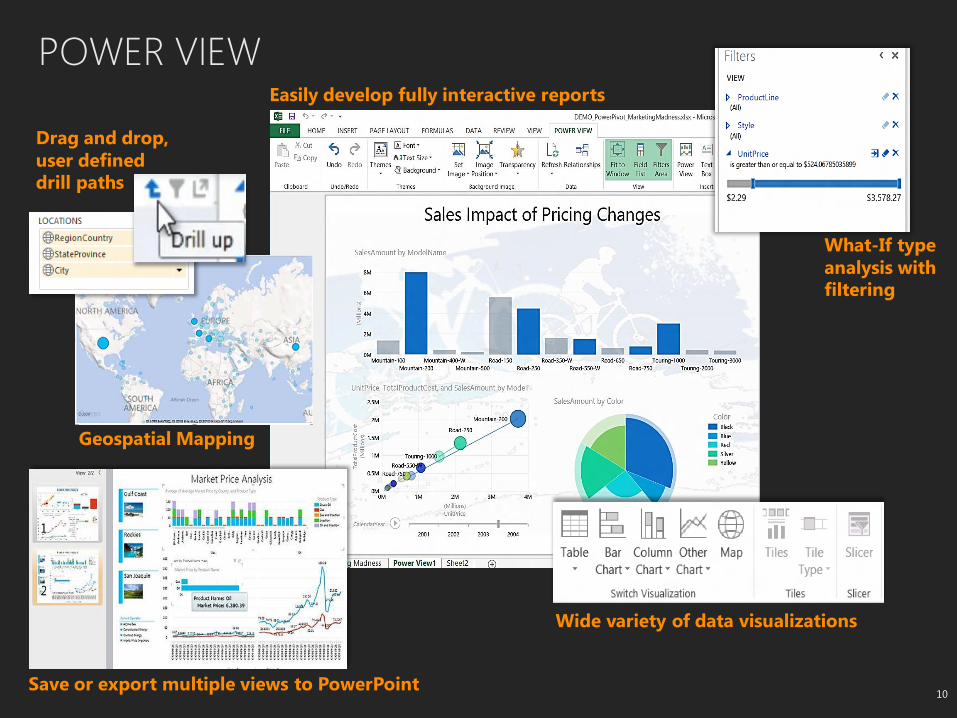
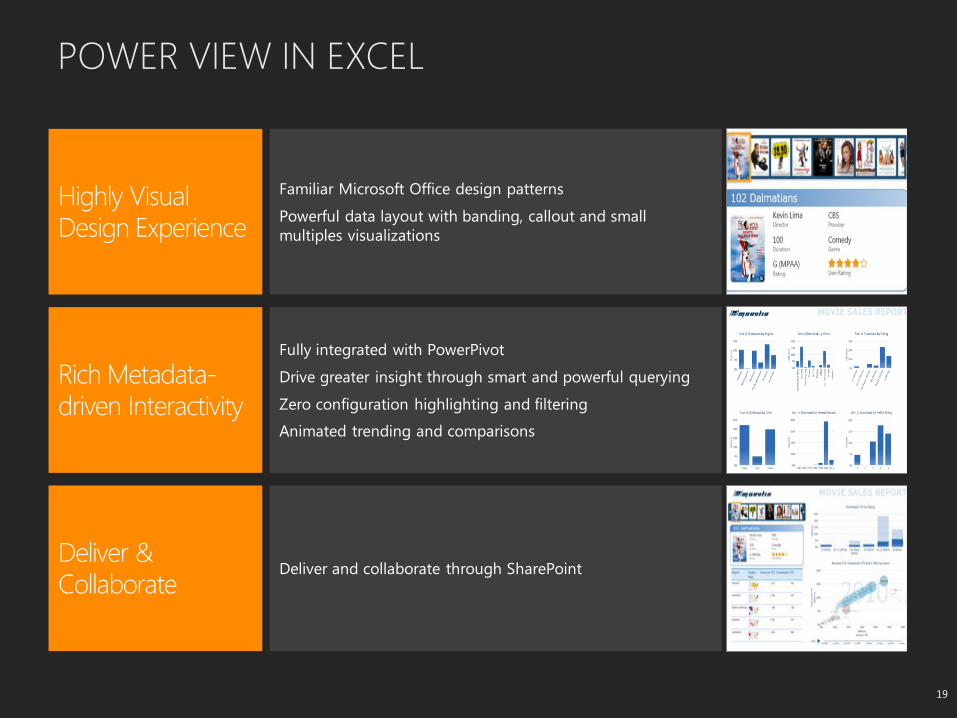
POWER VIEW
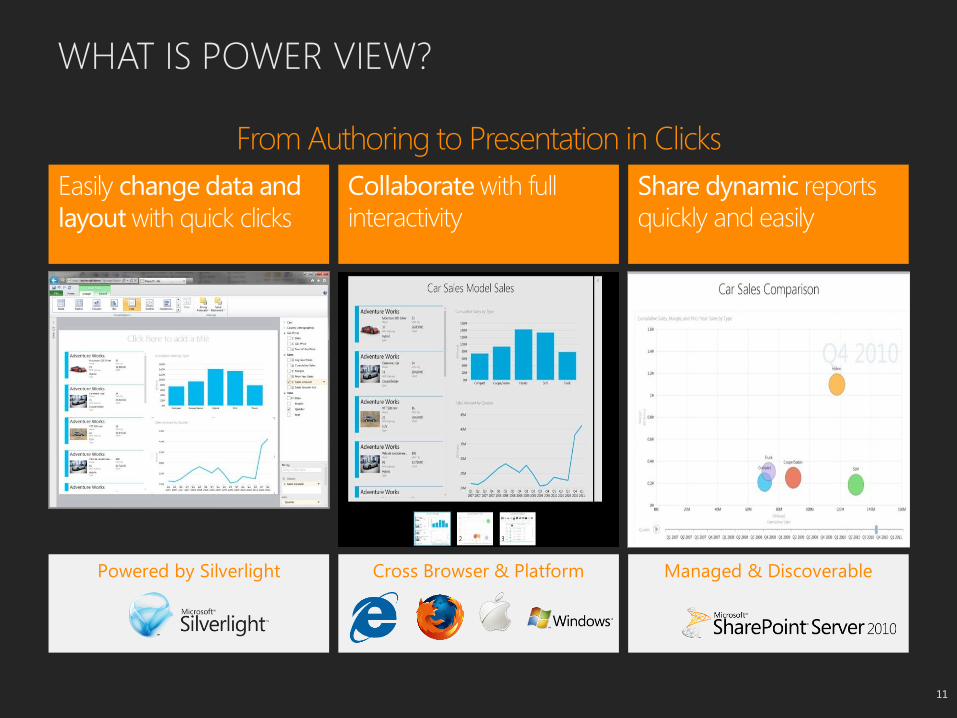
WHAT IS POWER VIEW?
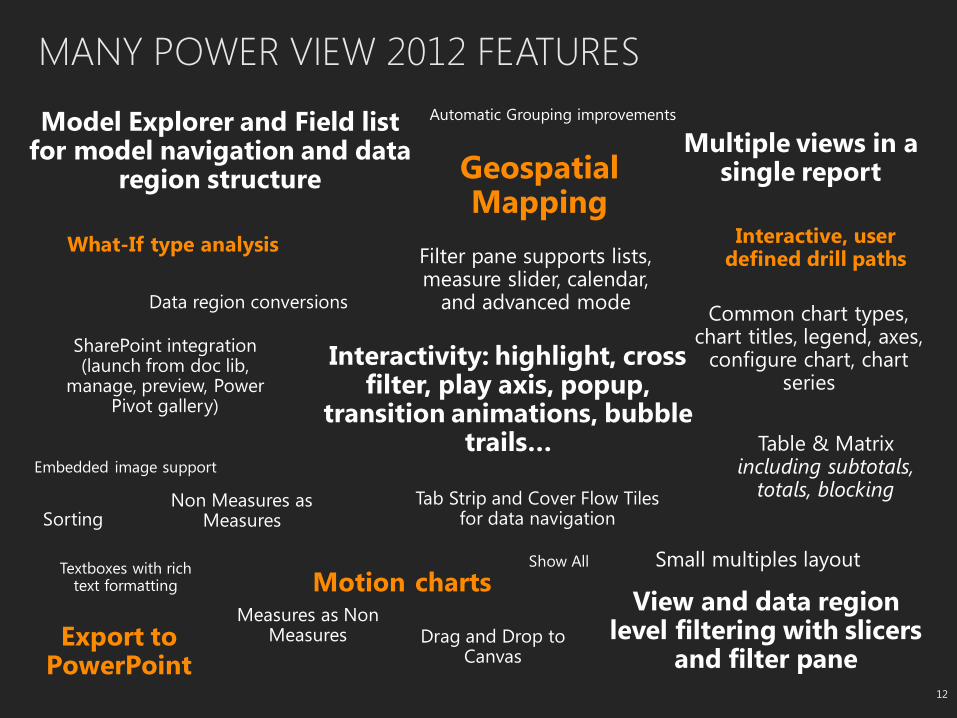
MANY POWER VIEW 2012 FEATURES
Model Explorer and Field list for model navigation and data
region structure
Motion charts
Interactivity: highlight, cross filter, play axis, popup,
transition animations, bubble trails…
View and data region level filtering with slicers
and filter pane Export to
PowerPoint
Multiple views in a single report
What-If type analysis
Table & Matrix including subtotals,
totals, blocking Tab Strip and Cover Flow Tiles for data navigation
Data region conversions
SharePoint integration (launch from doc lib,
manage, preview, Power Pivot gallery)
Common chart types, chart titles, legend, axes,
configure chart, chart series
Small multiples layout
Geospatial Mapping
Filter pane supports lists, measure slider, calendar,
and advanced mode
Sorting
Interactive, user defined drill paths
Drag and Drop to Canvas
Measures as Non Measures
Non Measures as Measures
Textboxes with rich text formatting
Show All
Embedded image support
Automatic Grouping improvements
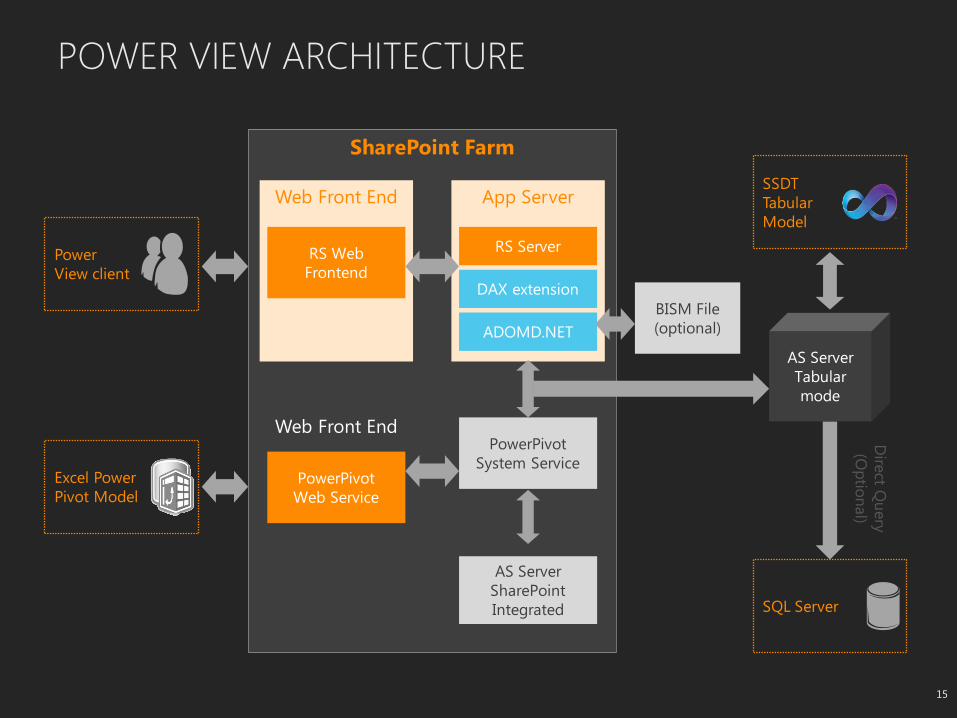
POWER VIEW ARCHITECTURE
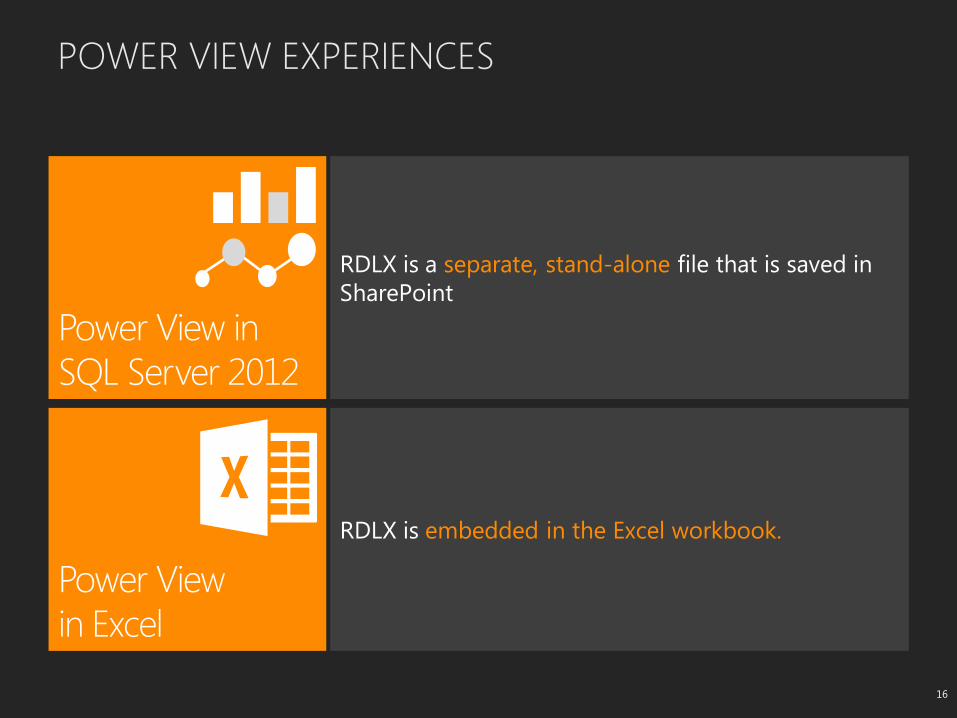
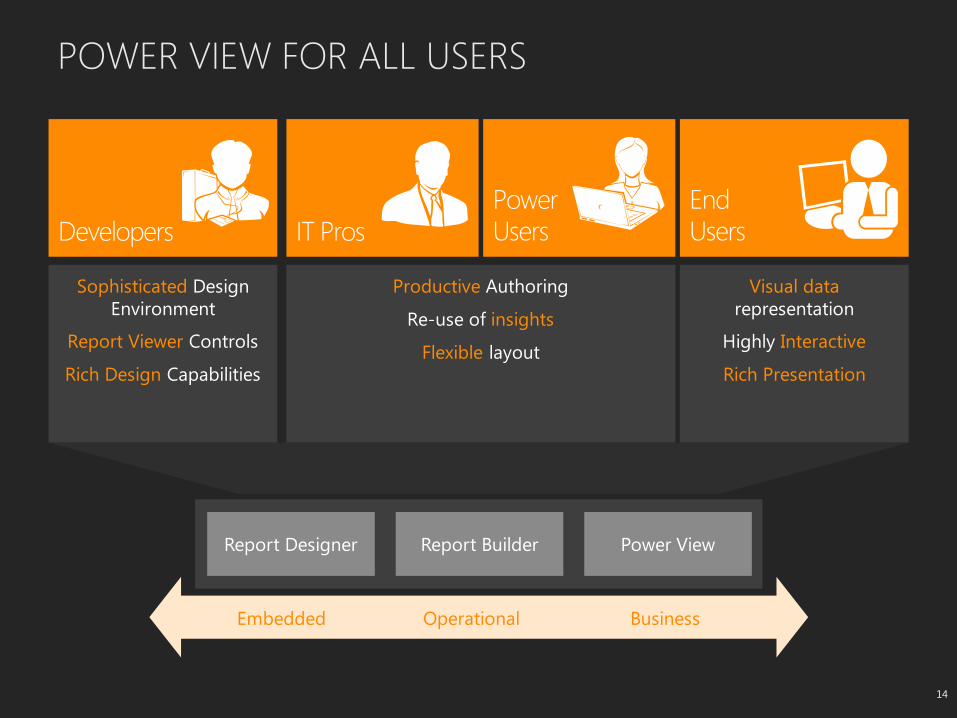
POWER VIEW EXPERIENCES
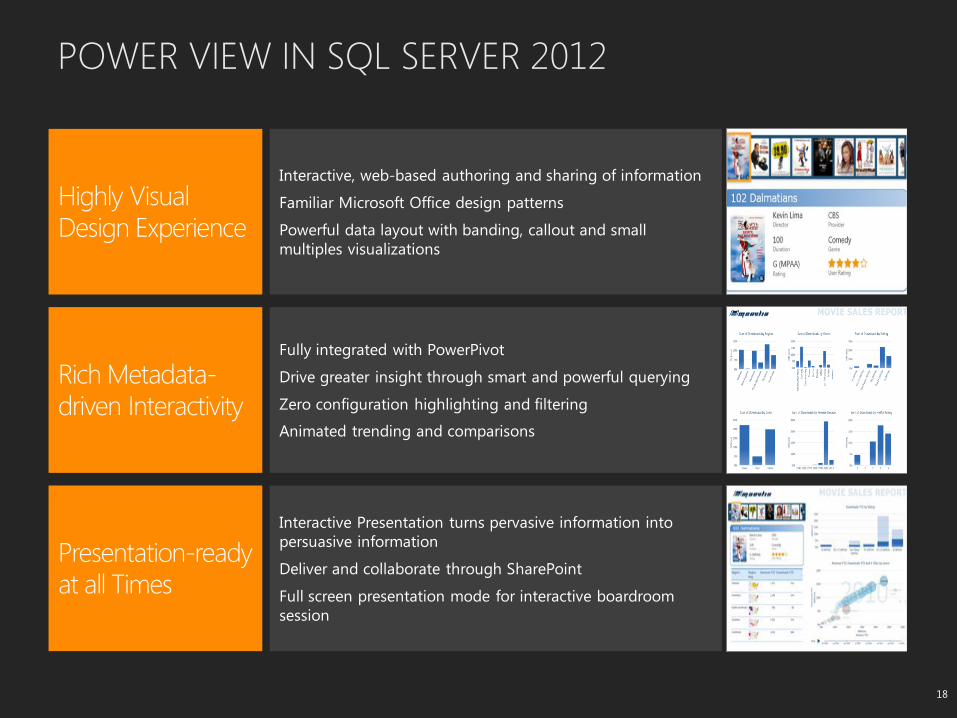
POWER VIEW IN SQL SERVER 2012
POWER VIEW IN EXCEL
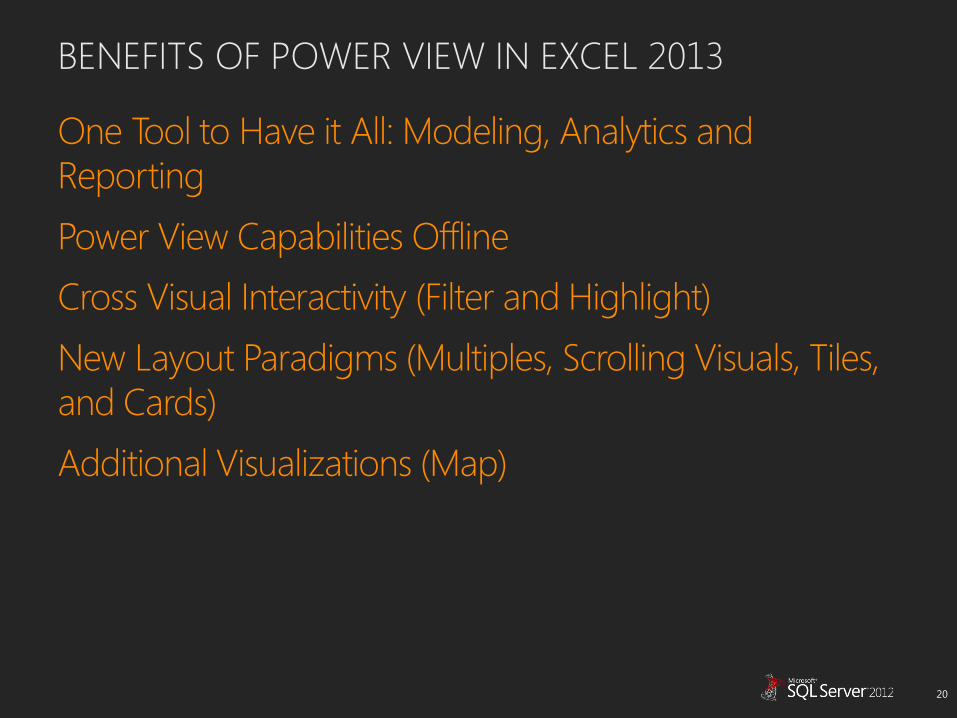
BENEFITS OF POWER VIEW IN EXCEL 2013
One Tool to Have it All: Modeling, Analytics and Reporting
Power View Capabilities Offline
Cross Visual Interactivity (Filter and Highlight)
New Layout Paradigms (Multiples, Scrolling Visuals, Tiles, and Cards)
Additional Visualizations (Map)
EXCEL 2013 + POWERPIVOT: THE PERFECT MARRIAGE
Excel brings: Easier data cleanup (Flash Fill)
Faster on-ramp (Quick Analysis, Pivot and Chart Recommendations)
Built-in Data Model (relate your data)
New Data Sources (Odata, Azure Marketplace)
PowerPivot add-in for Excel 15 brings: Further Data Model enrichments (Calculated fields, KPIs, Hierarchies,
Perspectives)
Enriched data connectivity experience
Advanced Data Model exploration and manipulation
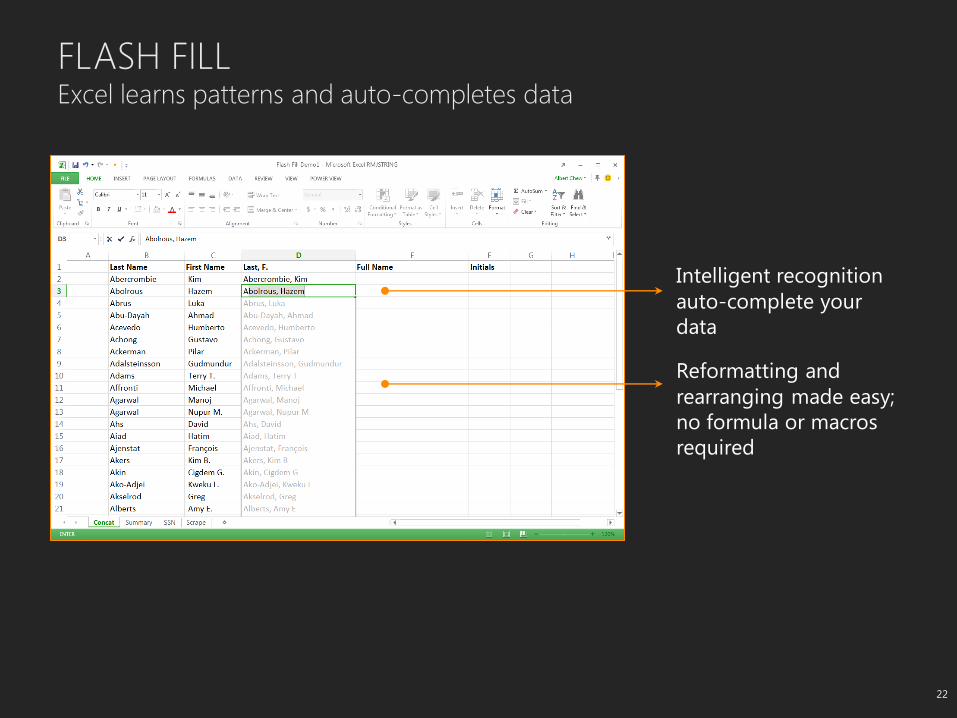
FLASH FILL Excel learns patterns and auto-completes data
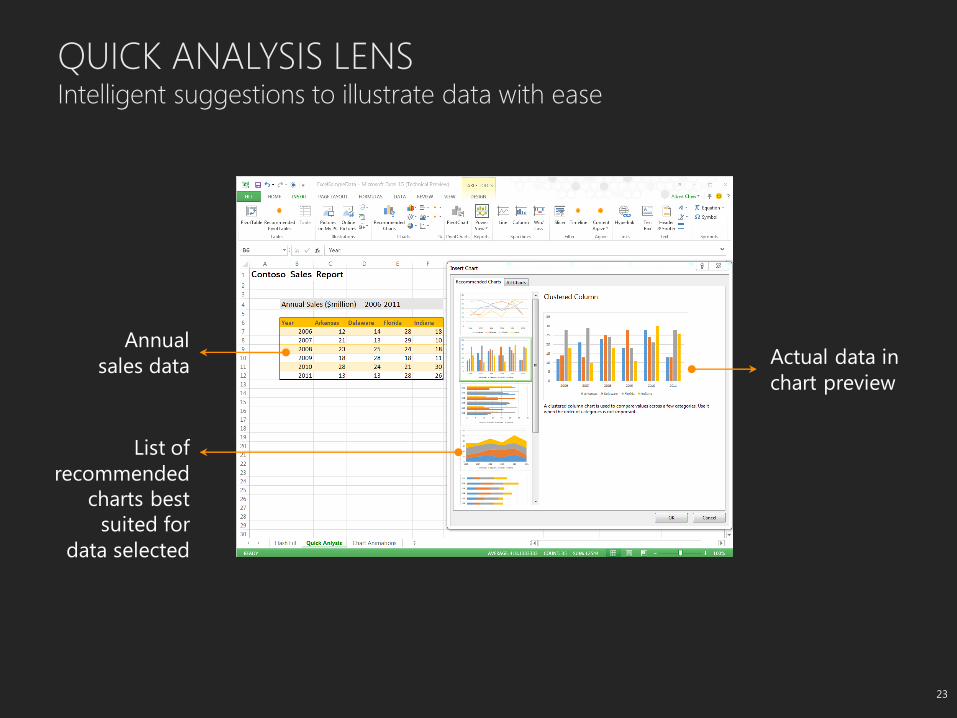
QUICK ANALYSIS LENS Intelligent suggestions to illustrate data with ease
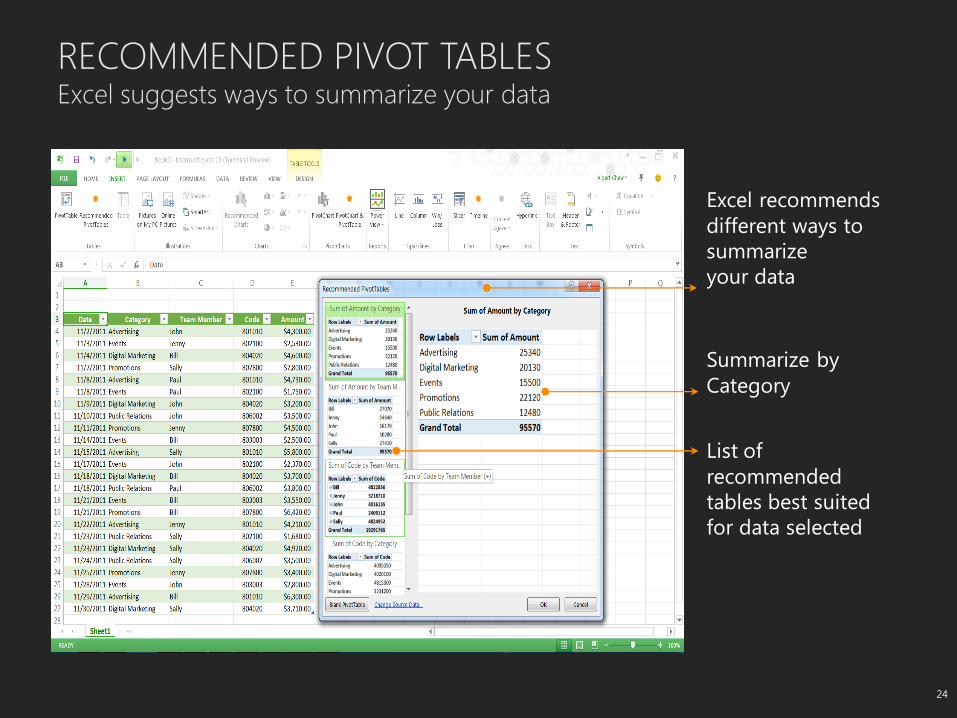
RECOMMENDED PIVOT TABLES Excel suggests ways to summarize your data
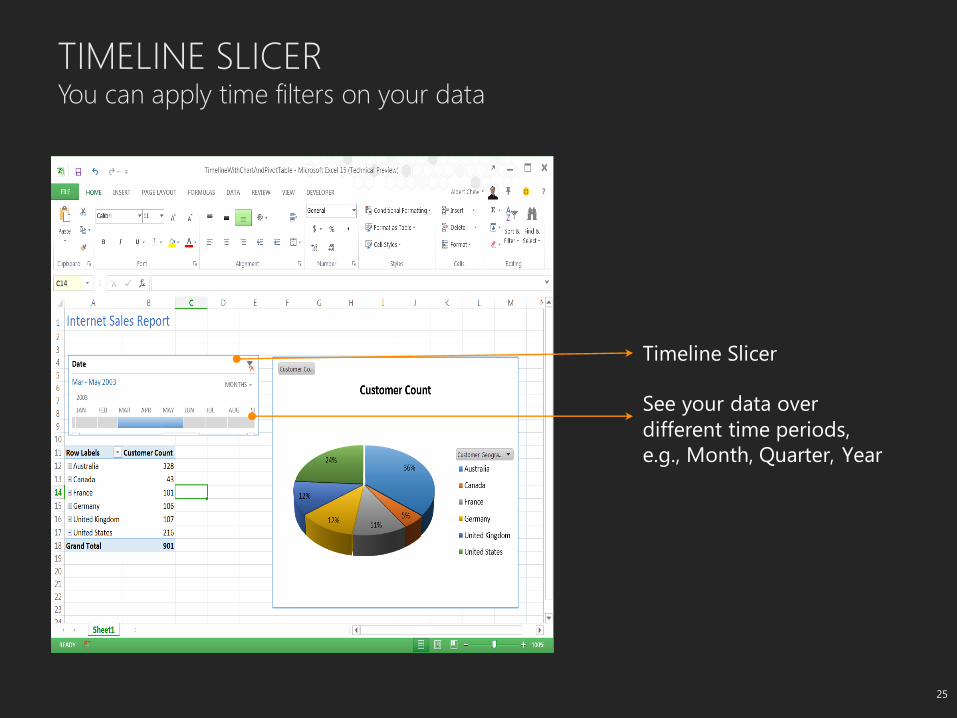
TIMELINE SLICER You can apply time filters on your data
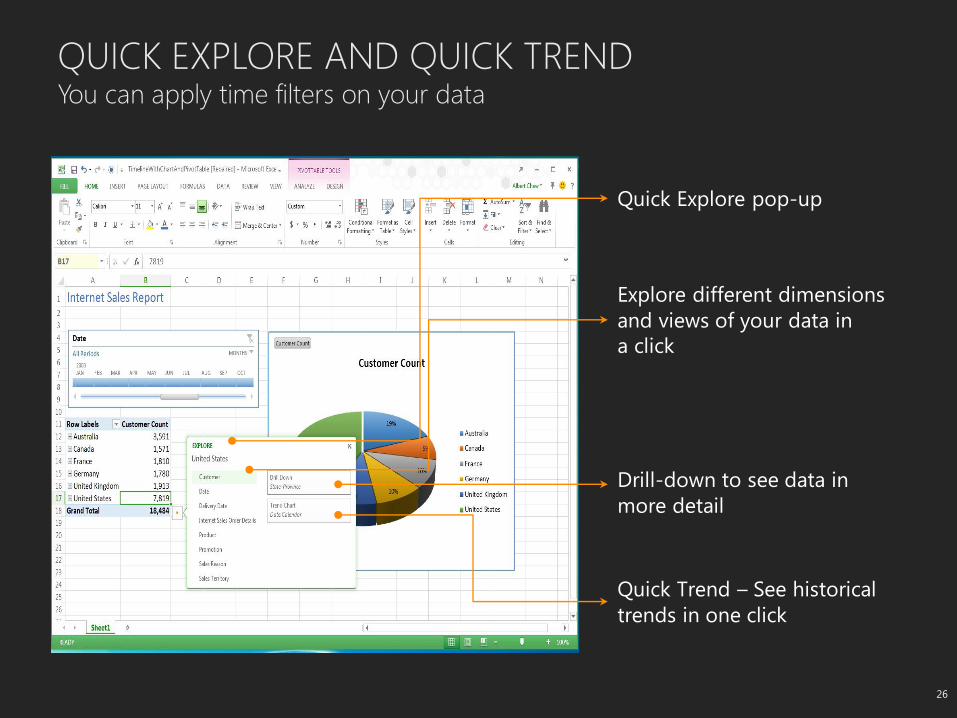
QUICK EXPLORE AND QUICK TREND You can apply time filters on your data
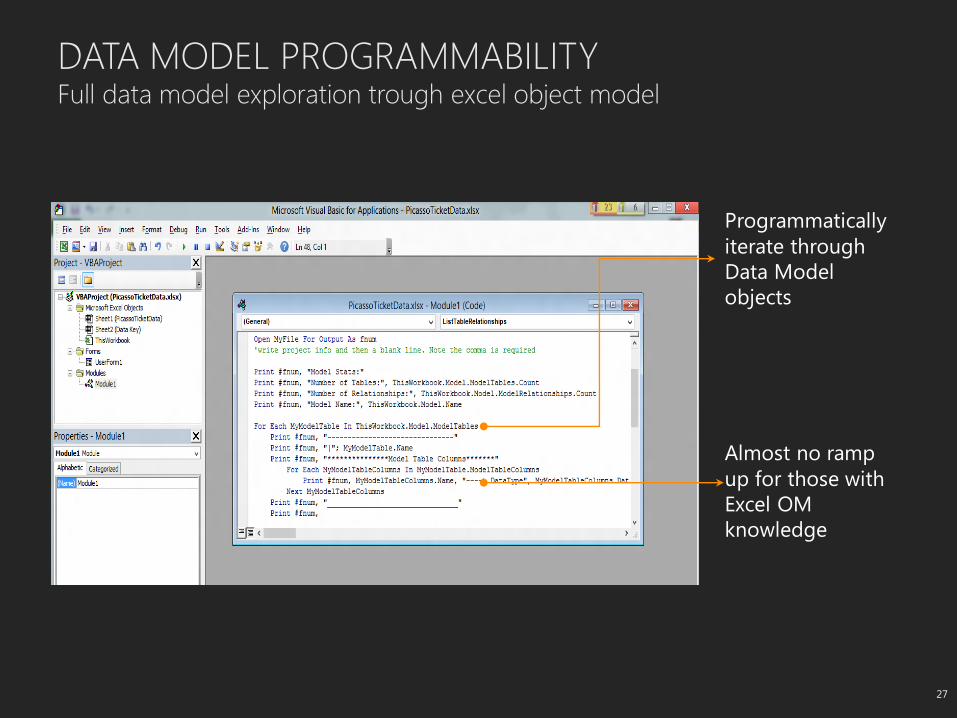
DATA MODEL PROGRAMMABILITY Full data model exploration trough excel object model

ON EVERY DEVICE AND EVERY BROWSER
Excel
on
Windows
Phone
Excel
on
iPhone
Excel
on
Android
phone
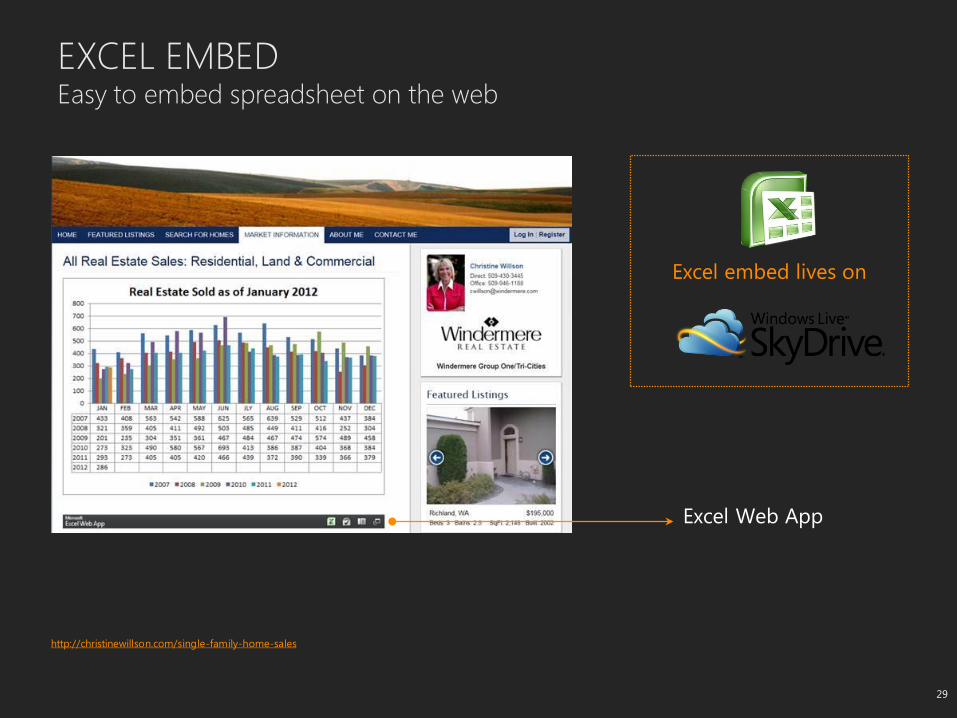
EXCEL EMBED Easy to embed spreadsheet on the web
http://christinewillson.com/single-family-home-sales
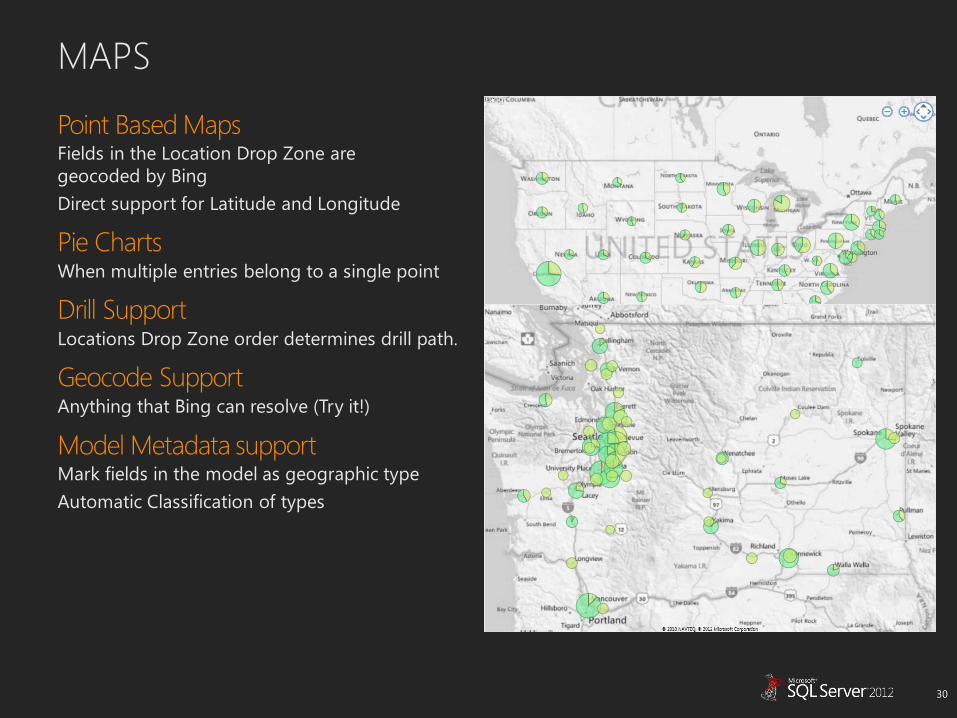
MAPS
Point Based Maps Fields in the Location Drop Zone are
geocoded by Bing
Direct support for Latitude and Longitude
Pie Charts When multiple entries belong to a single point
Drill Support Locations Drop Zone order determines drill path.
Geocode Support Anything that Bing can resolve (Try it!)
Model Metadata support Mark fields in the model as geographic type
Automatic Classification of types
HIERARCHIES AND DRILL
Hierarchy Support All hierarchies are supported in Power View
Drill Drill is not dependent on hierarchies
Users can define their own drill paths using any fields
Show One or Show All For tablix, drill using “Show One Level” option
For chart and map, drill is turned on by default based on defined drill path
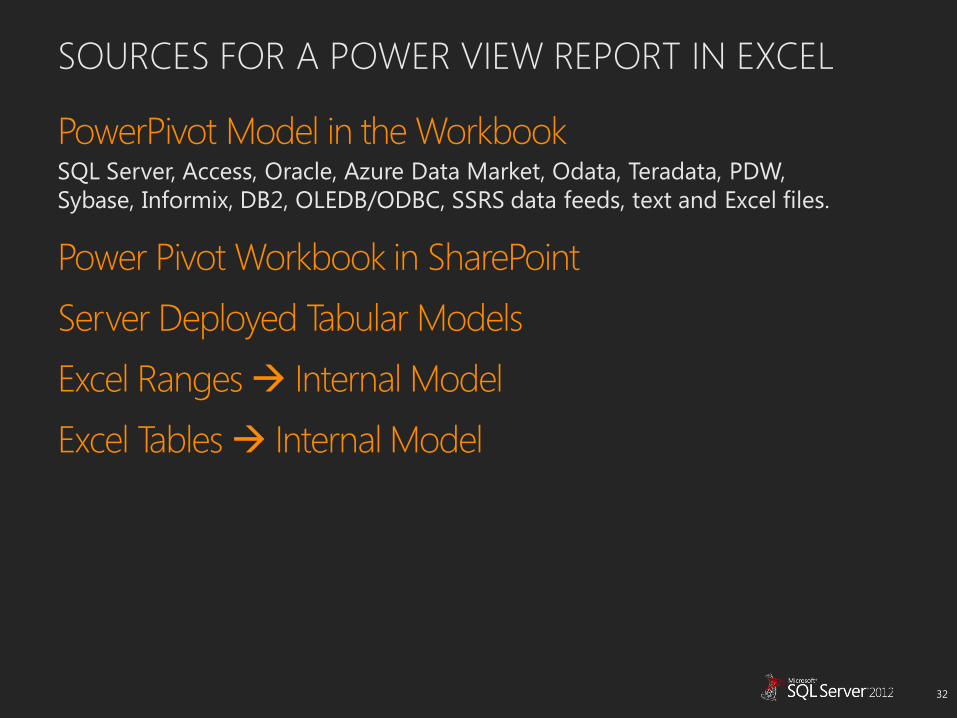
SOURCES FOR A POWER VIEW REPORT IN EXCEL
PowerPivot Model in the Workbook SQL Server, Access, Oracle, Azure Data Market, Odata, Teradata, PDW,
Sybase, Informix, DB2, OLEDB/ODBC, SSRS data feeds, text and Excel files.
Power Pivot Workbook in SharePoint
Server Deployed Tabular Models
Excel Ranges Internal Model
Excel Tables Internal Model
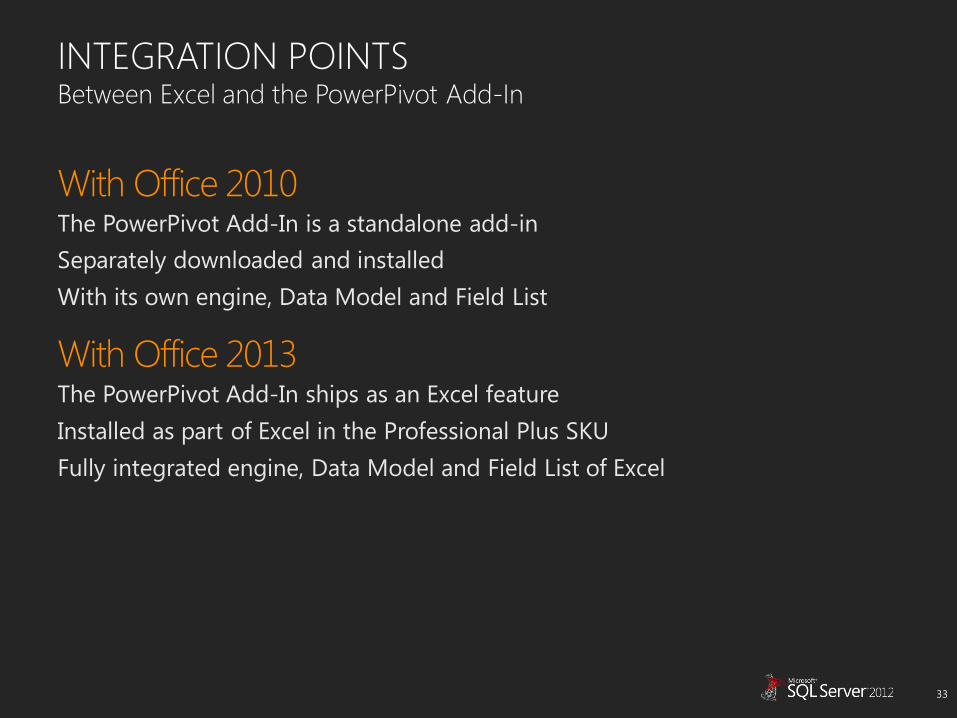
INTEGRATION POINTS Between Excel and the PowerPivot Add-In
With Office 2010 The PowerPivot Add-In is a standalone add-in
Separately downloaded and installed
With its own engine, Data Model and Field List
With Office 2013 The PowerPivot Add-In ships as an Excel feature
Installed as part of Excel in the Professional Plus SKU
Fully integrated engine, Data Model and Field List of Excel
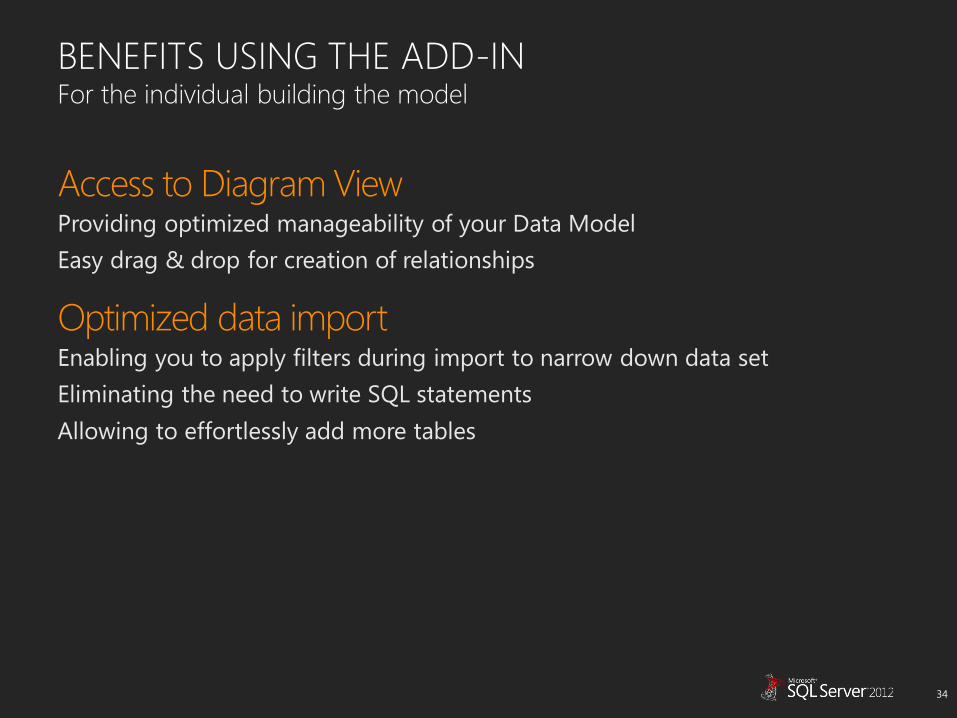
BENEFITS USING THE ADD-IN For the individual building the model
Access to Diagram View Providing optimized manageability of your Data Model
Easy drag & drop for creation of relationships
Optimized data import Enabling you to apply filters during import to narrow down data set
Eliminating the need to write SQL statements
Allowing to effortlessly add more tables
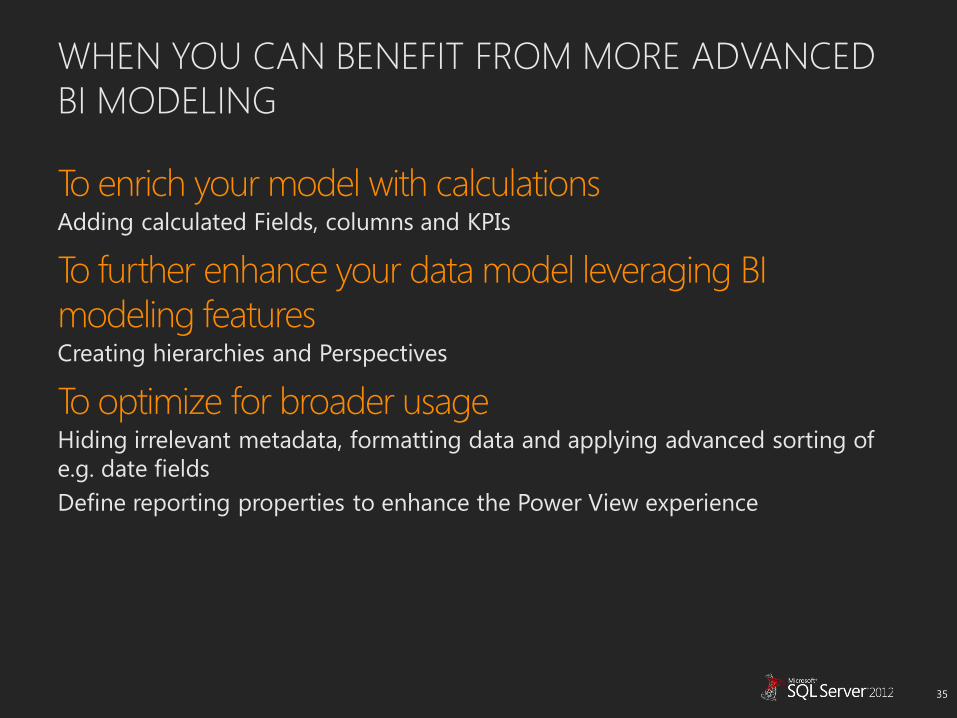
WHEN YOU CAN BENEFIT FROM MORE ADVANCED BI MODELING
To enrich your model with calculations Adding calculated Fields, columns and KPIs
To further enhance your data model leveraging BI modeling features Creating hierarchies and Perspectives
To optimize for broader usage Hiding irrelevant metadata, formatting data and applying advanced sorting of
e.g. date fields
Define reporting properties to enhance the Power View experience
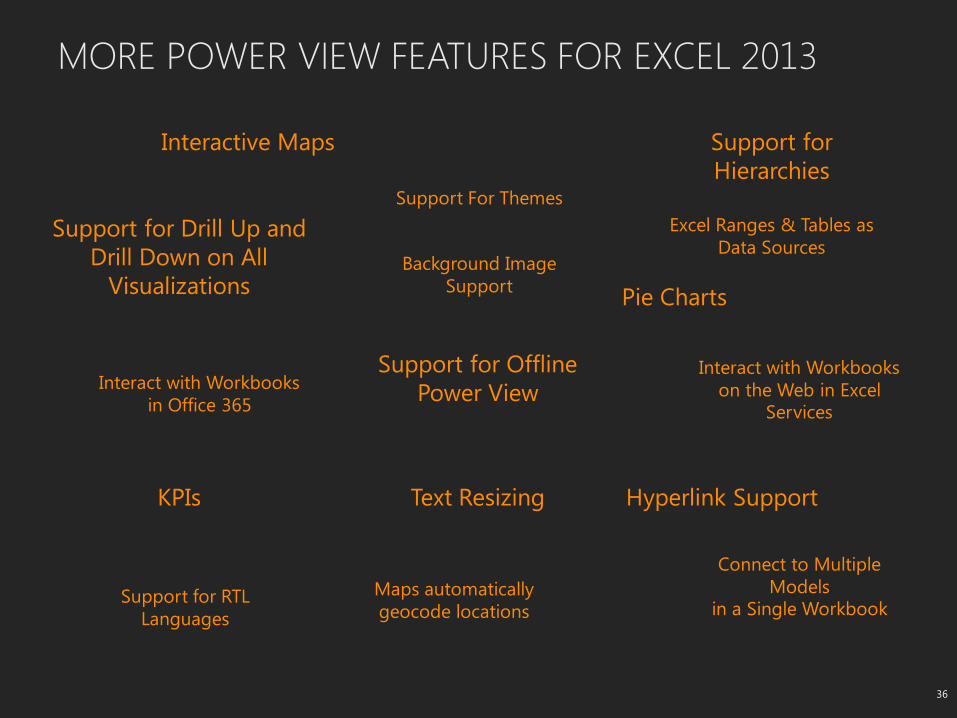
MORE POWER VIEW FEATURES FOR EXCEL 2013
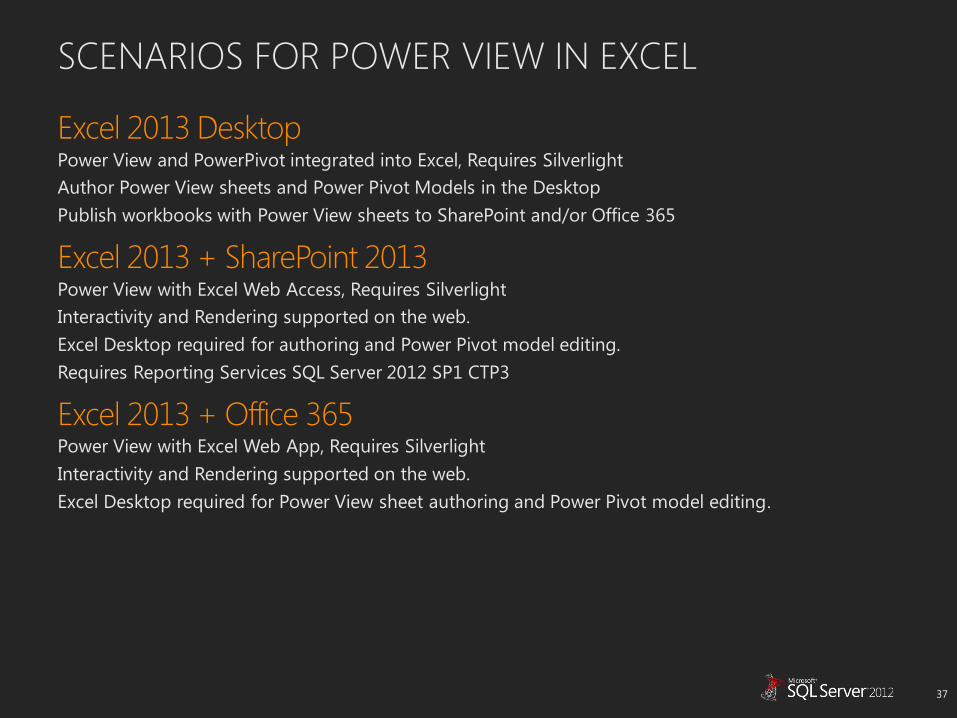
SCENARIOS FOR POWER VIEW IN EXCEL
Excel 2013 Desktop Power View and PowerPivot integrated into Excel, Requires Silverlight
Author Power View sheets and Power Pivot Models in the Desktop
Publish workbooks with Power View sheets to SharePoint and/or Office 365
Excel 2013 + SharePoint 2013 Power View with Excel Web Access, Requires Silverlight
Interactivity and Rendering supported on the web.
Excel Desktop required for authoring and Power Pivot model editing.
Requires Reporting Services SQL Server 2012 SP1 CTP3
Excel 2013 + Office 365 Power View with Excel Web App, Requires Silverlight
Interactivity and Rendering supported on the web.
Excel Desktop required for Power View sheet authoring and Power Pivot model editing.
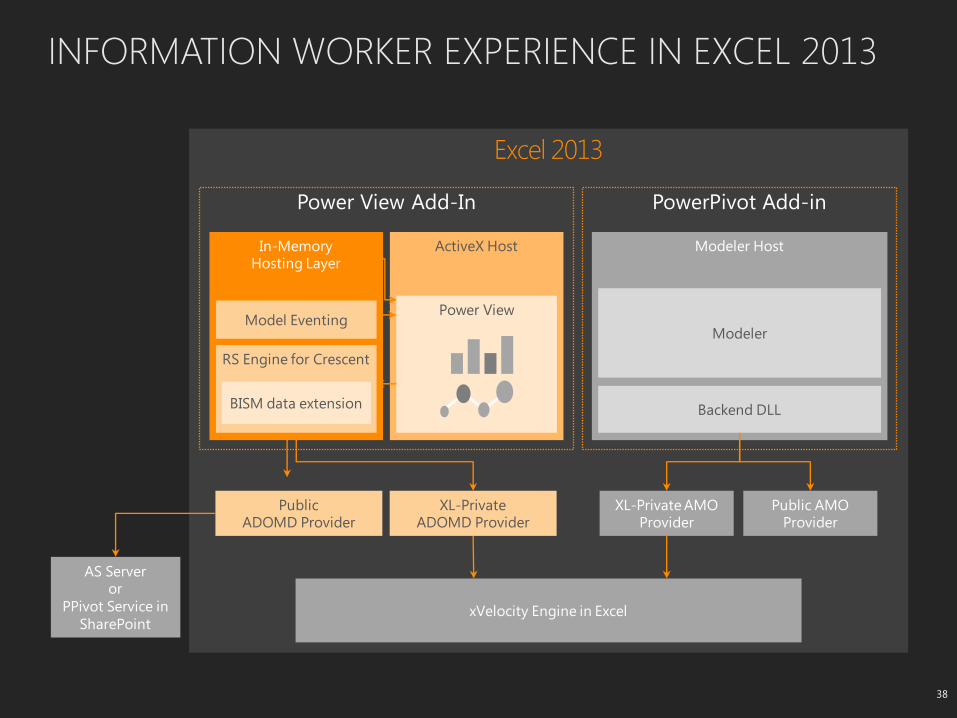
INFORMATION WORKER EXPERIENCE IN EXCEL 2013
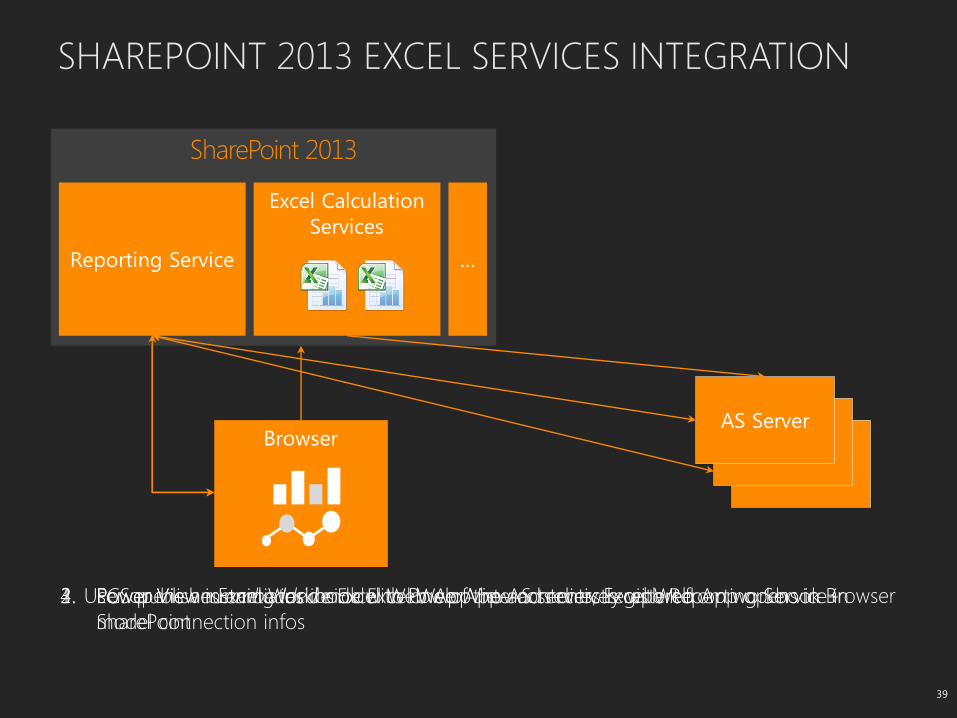
SHAREPOINT 2013 EXCEL SERVICES INTEGRATION
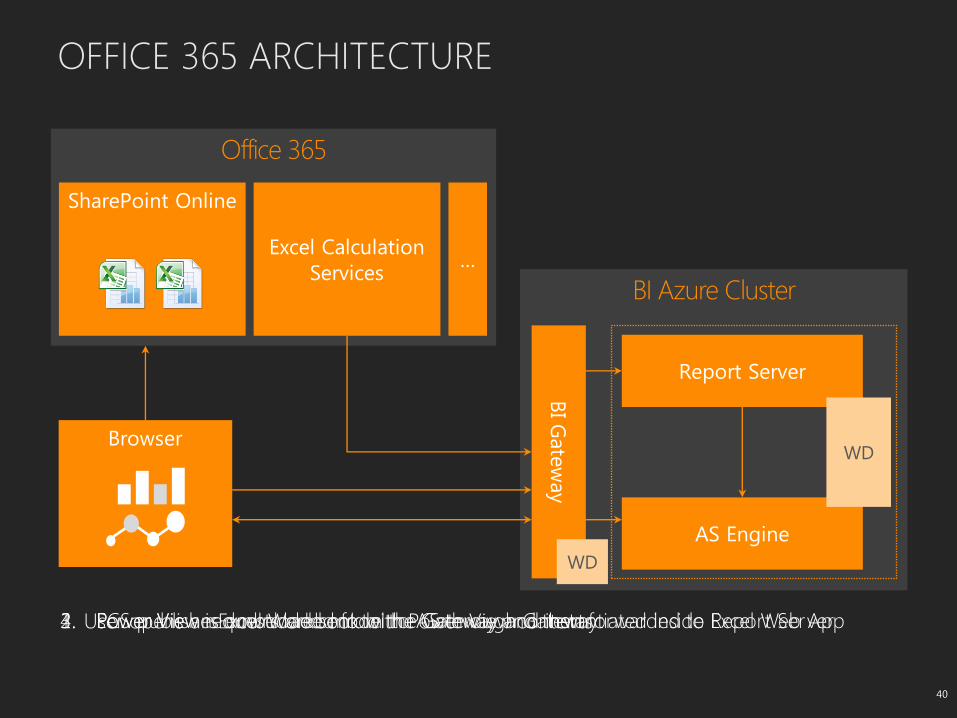
OFFICE 365 ARCHITECTURE
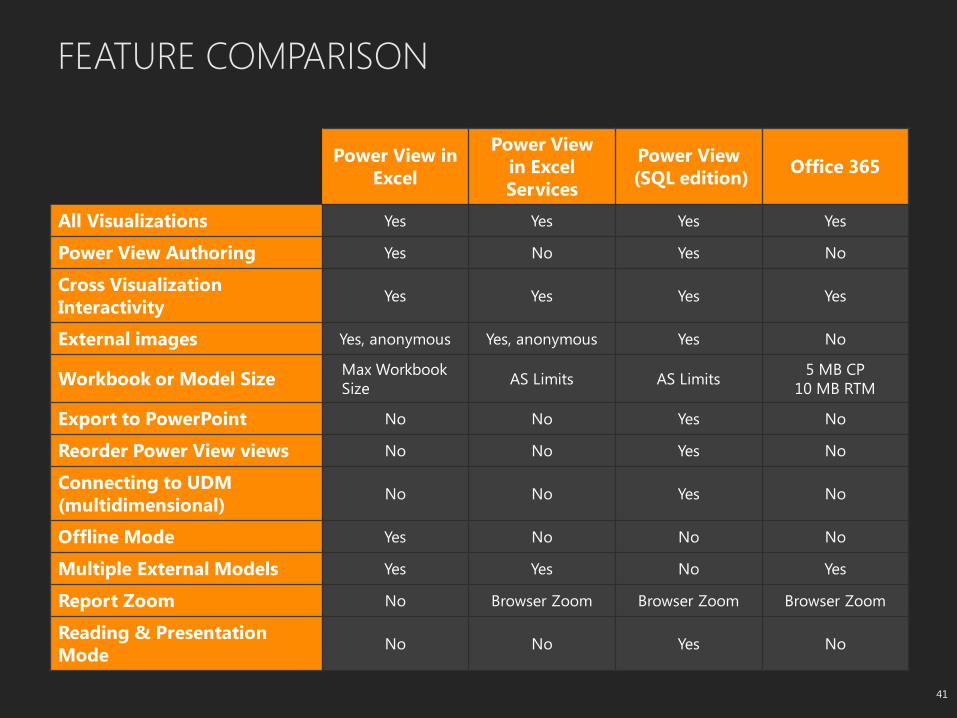
FEATURE COMPARISON
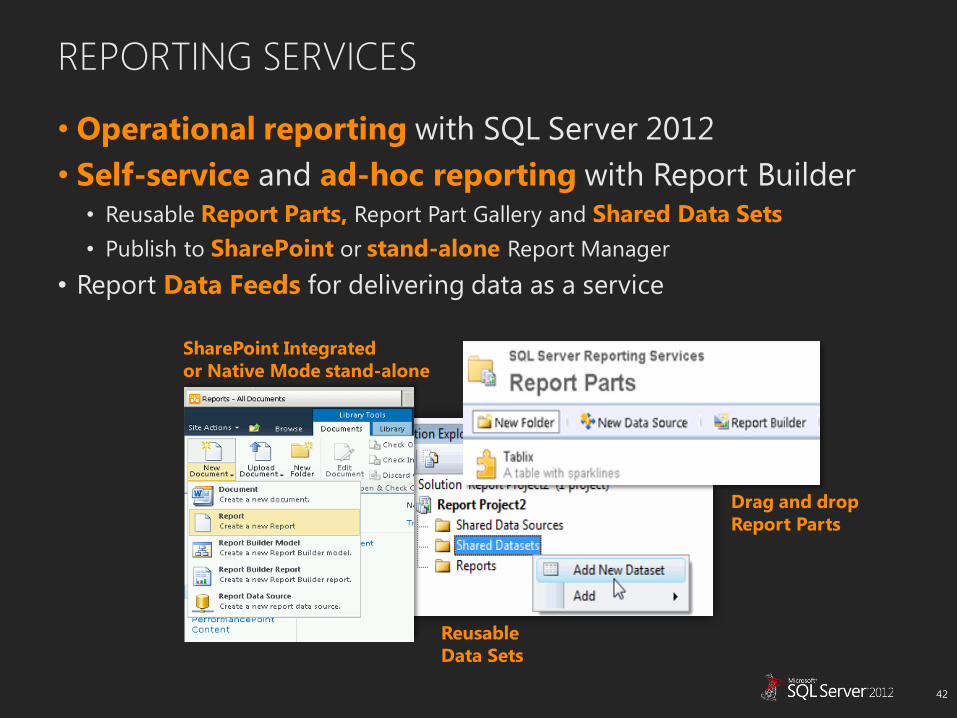
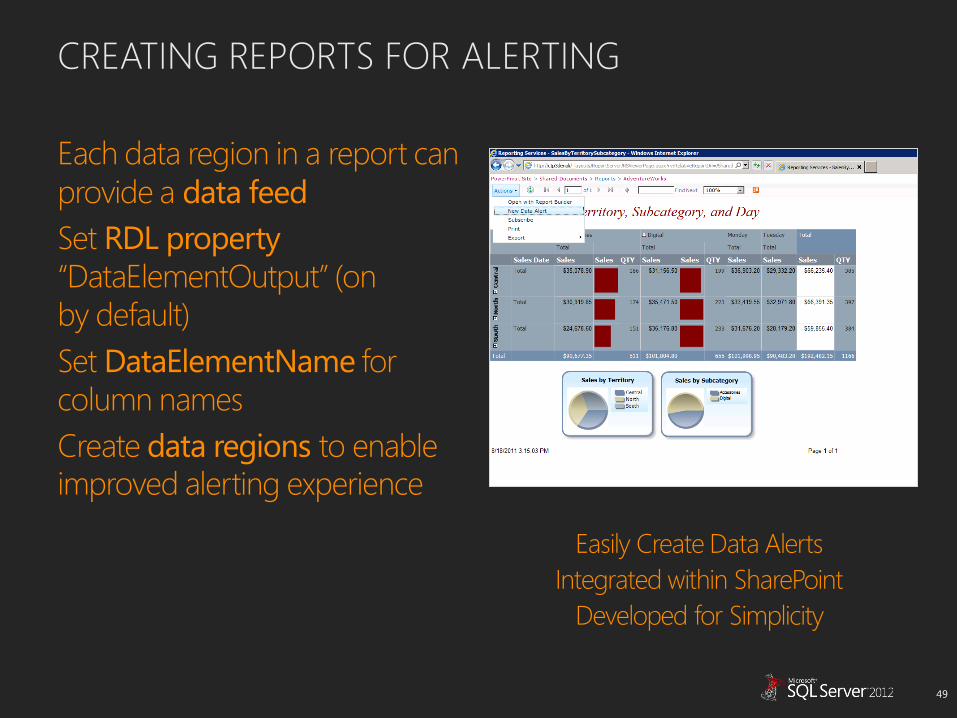
REPORTING SERVICES
• Operational reporting with SQL Server 2012
• Self-service and ad-hoc reporting with Report Builder • Reusable Report Parts, Report Part Gallery and Shared Data Sets
• Publish to SharePoint or stand-alone Report Manager
• Report Data Feeds for delivering data as a service
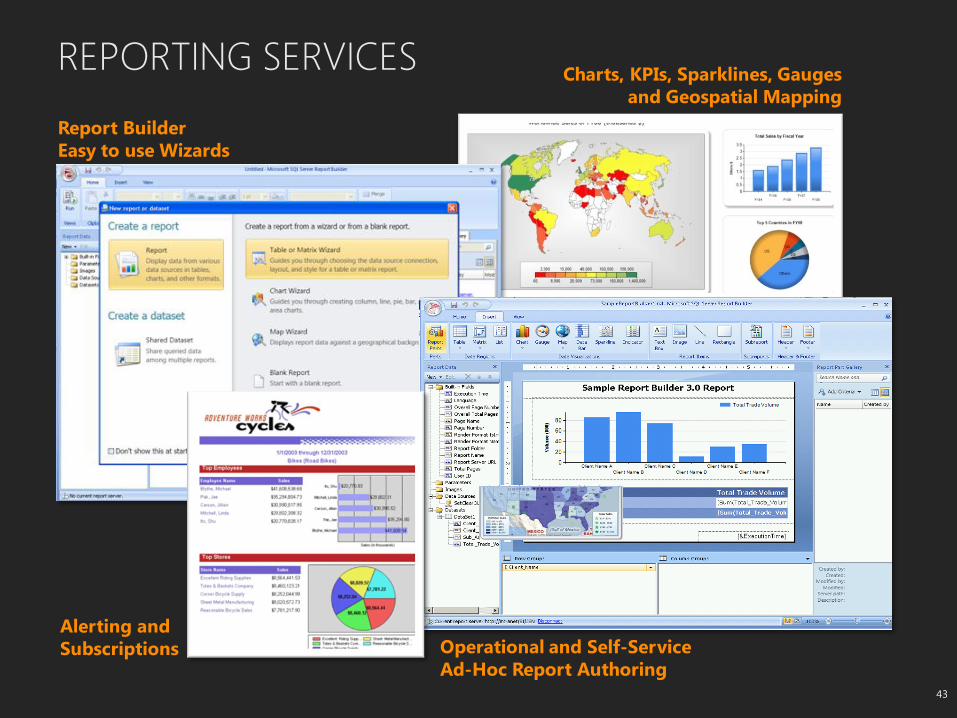
REPORTING SERVICES
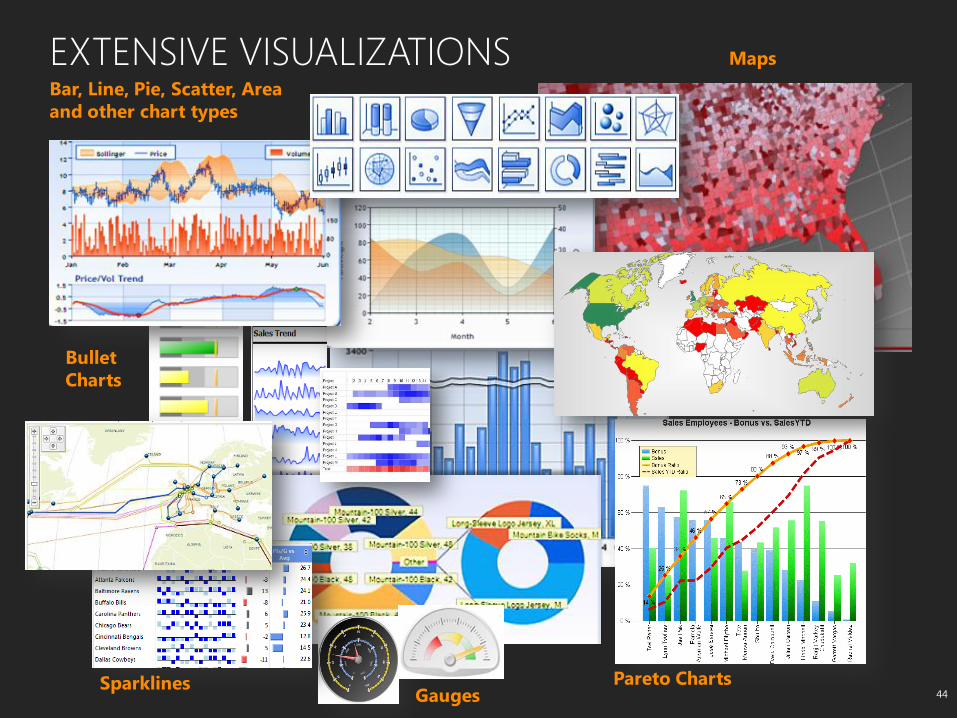
EXTENSIVE VISUALIZATIONS
OData Feeds
LOB Apps
Hadoop Big Data
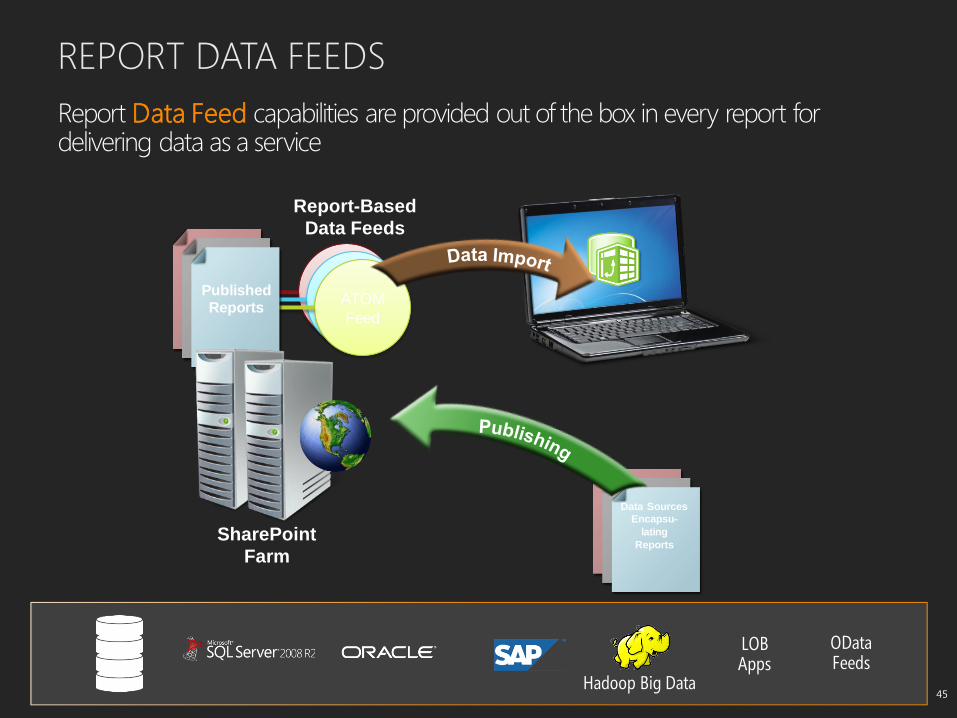
REPORT DATA FEEDS
ATOM
Feed
Published Reports
Data Sources
Encapsu-
lating
Reports SharePoint
Farm
Report-Based
Data Feeds
Report Data Feed capabilities are provided out of the box in every report for delivering data as a service
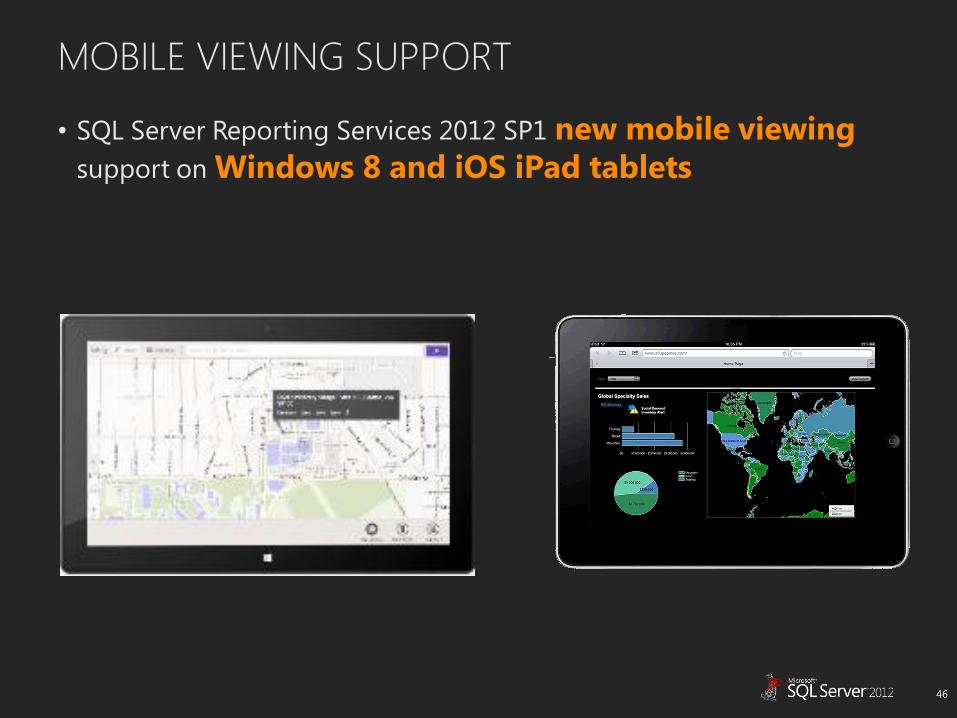
MOBILE VIEWING SUPPORT
• SQL Server Reporting Services 2012 SP1 new mobile viewing
support on Windows 8 and iOS iPad tablets
ADDITIONAL ENHANCEMENTS
• Support for new report export file formats
• Word rendering to *.docx format
• Excel rendering to *.xlsx format
• Feature parity with existing Word and Excel renderers
• Added ZIP-compressed files
• Larger worksheets in Excel
• 65k -> 1M rows
• 256 -> 16k columns
• More colors, theming and branding in Excel
• 56-color palette -> 24-bit color (16M colors)
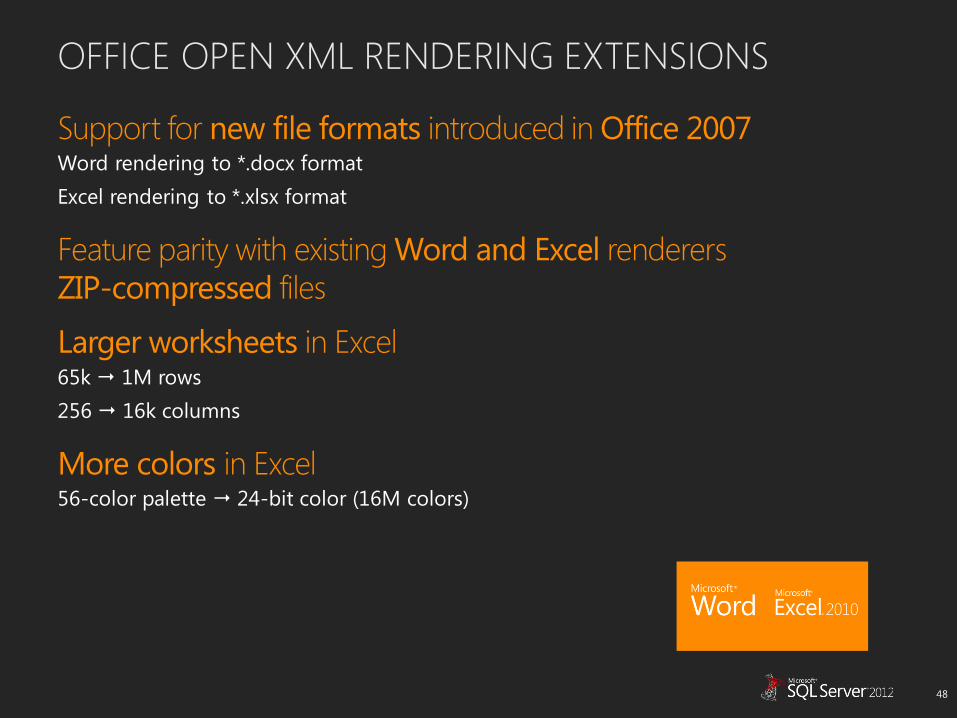
OFFICE OPEN XML RENDERING EXTENSIONS
Support for new file formats introduced in Office 2007 Word rendering to *.docx format
Excel rendering to *.xlsx format
Feature parity with existing Word and Excel renderers ZIP-compressed files
Larger worksheets in Excel 65k 1M rows
256 16k columns
More colors in Excel 56-color palette 24-bit color (16M colors)
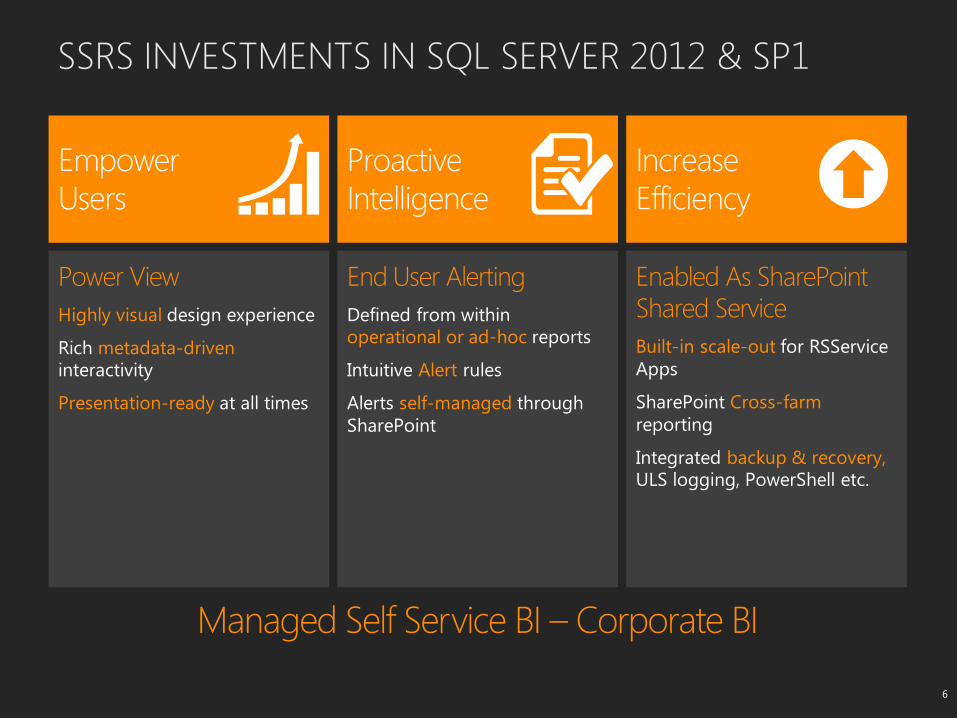
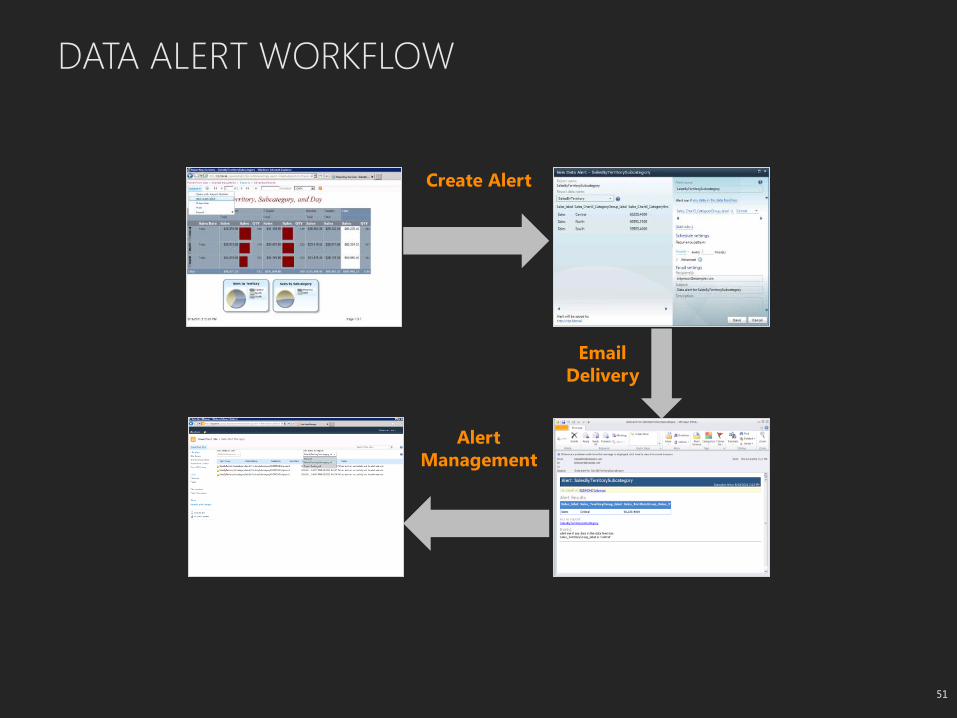
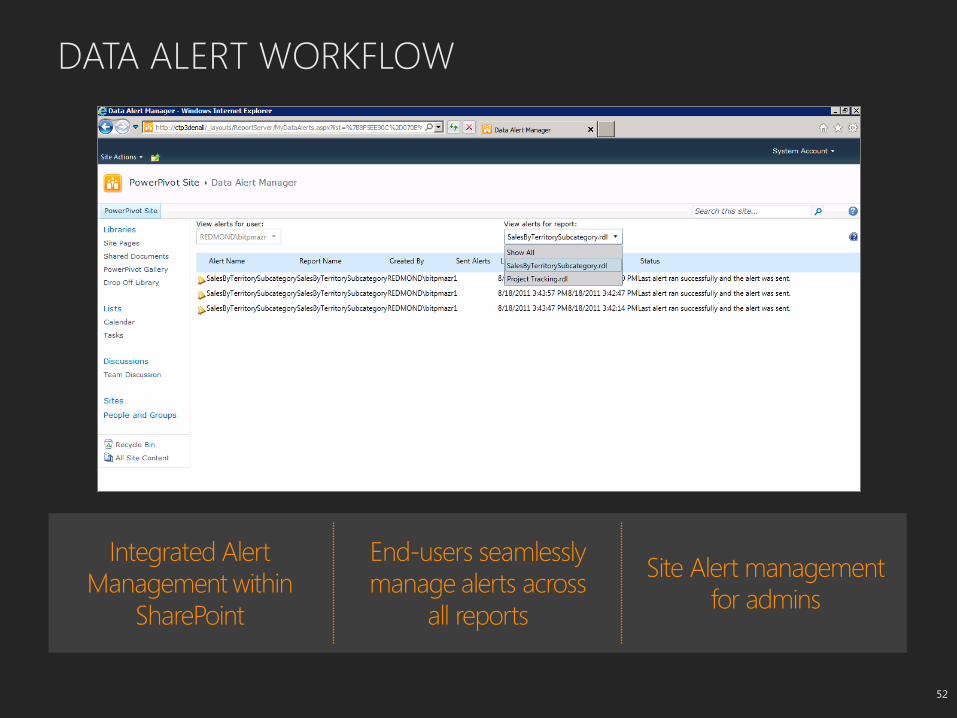
USER-DEFINED SELF SERVICE ALERTING
• Create Data Alerts within Reporting Services Reports
• Report authors maintain control over available data for alerting
• Users create alerts directly on the data visible in reports
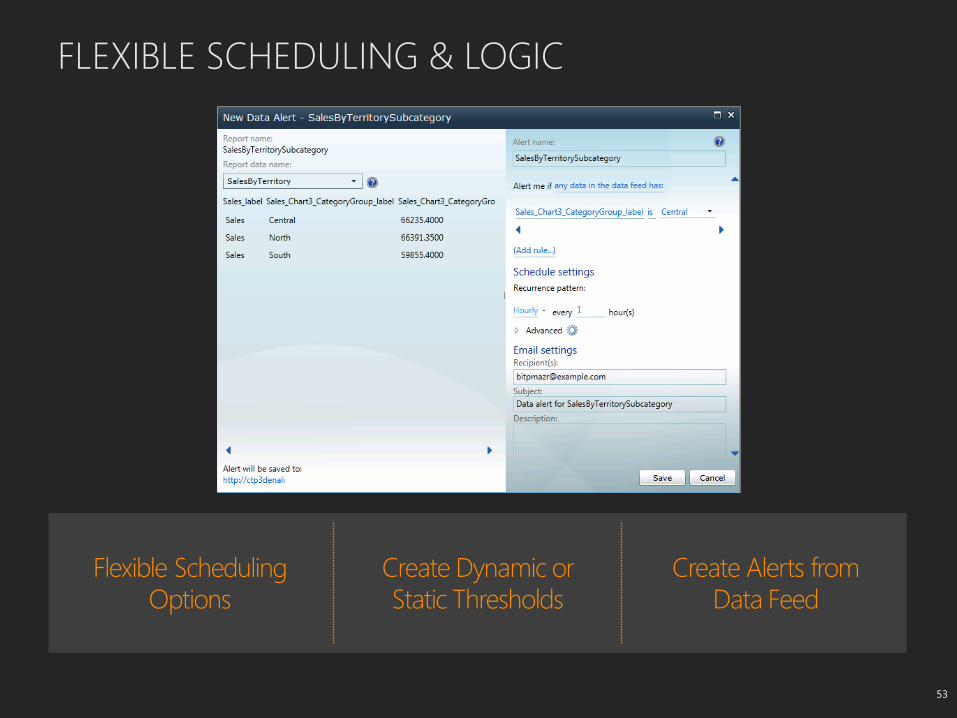
• Detect Important Data Level Changes • Intuitive Alert Rules (greater than, before/after)
• Easy to use scheduling (weekly, daily, monthly)
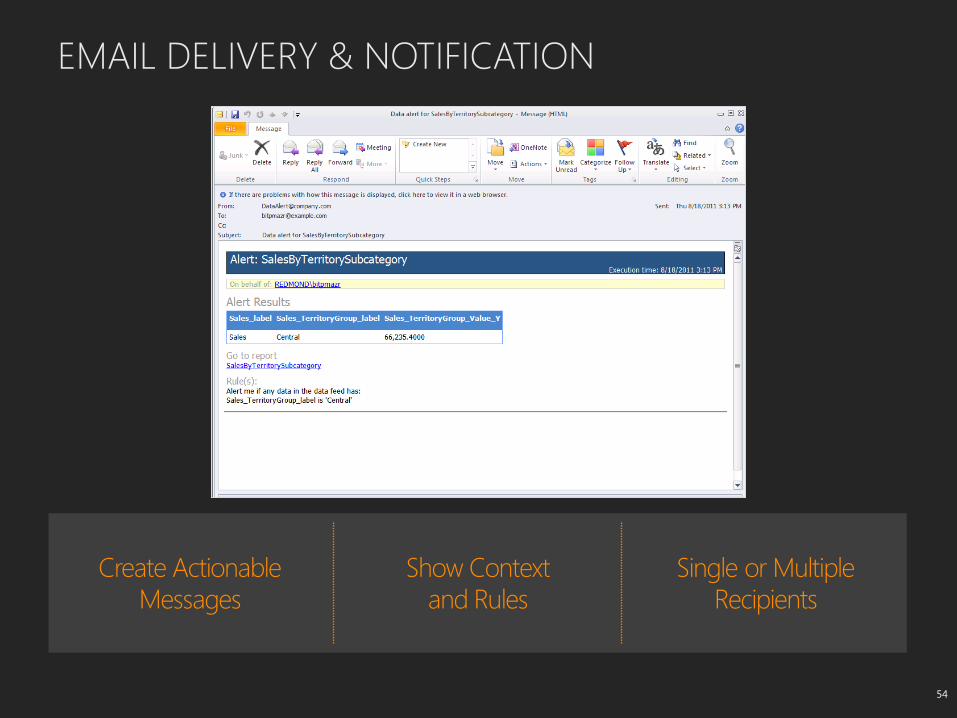
• Relevant data included in Alert Message
• Alert Management in SharePoint • Fine grained authorization
• Self-managed through SharePoint
• IT visibility and control over user-defined alerts
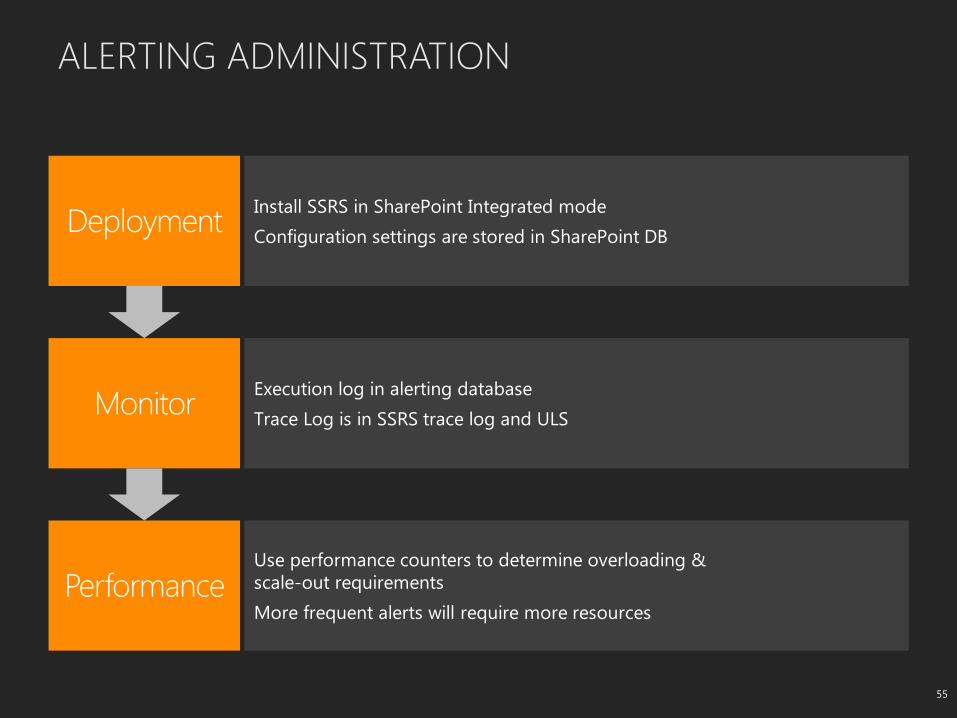
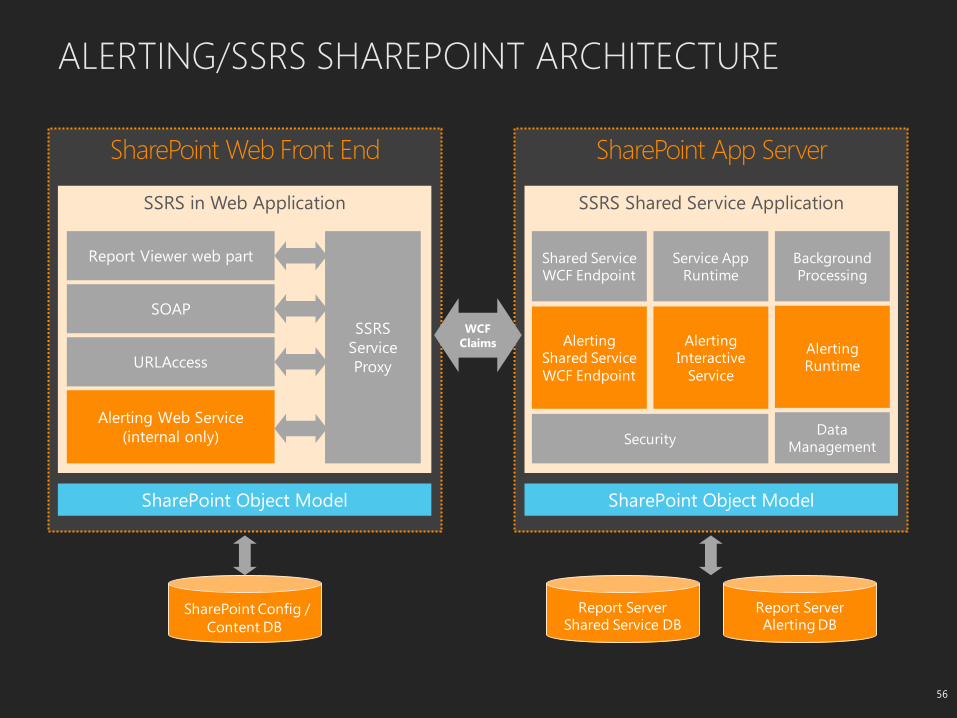
ALERTING/SSRS SHAREPOINT ARCHITECTURE
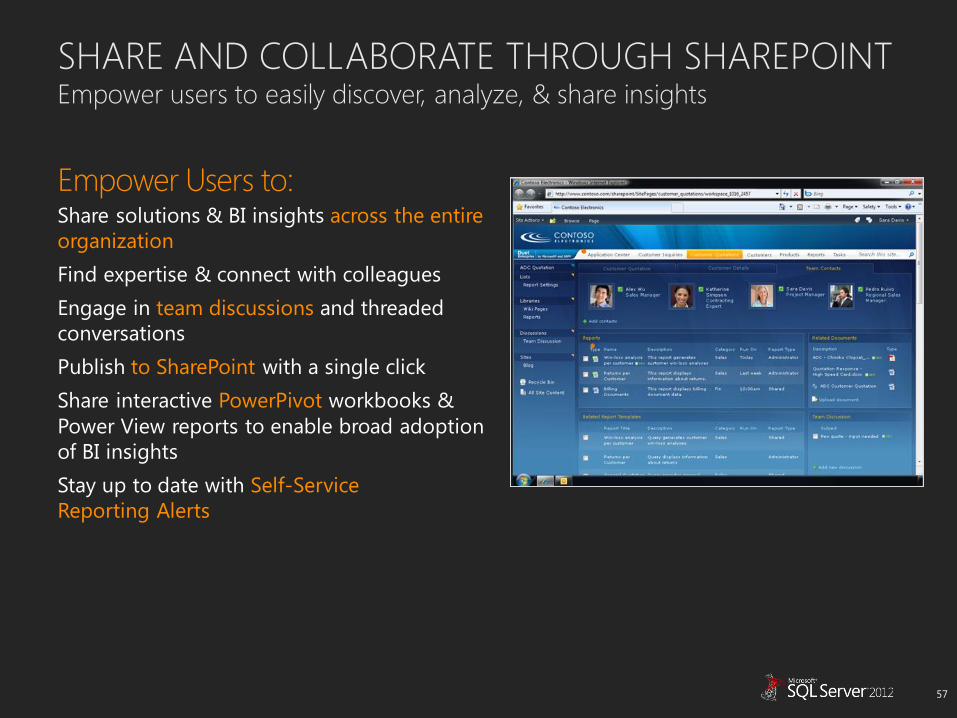
SHARE AND COLLABORATE THROUGH SHAREPOINT Empower users to easily discover, analyze, & share insights
Empower Users to: Share solutions & BI insights across the entire
organization
Find expertise & connect with colleagues
Engage in team discussions and threaded
conversations
Publish to SharePoint with a single click
Share interactive PowerPivot workbooks &
Power View reports to enable broad adoption
of BI insights
Stay up to date with Self-Service
Reporting Alerts
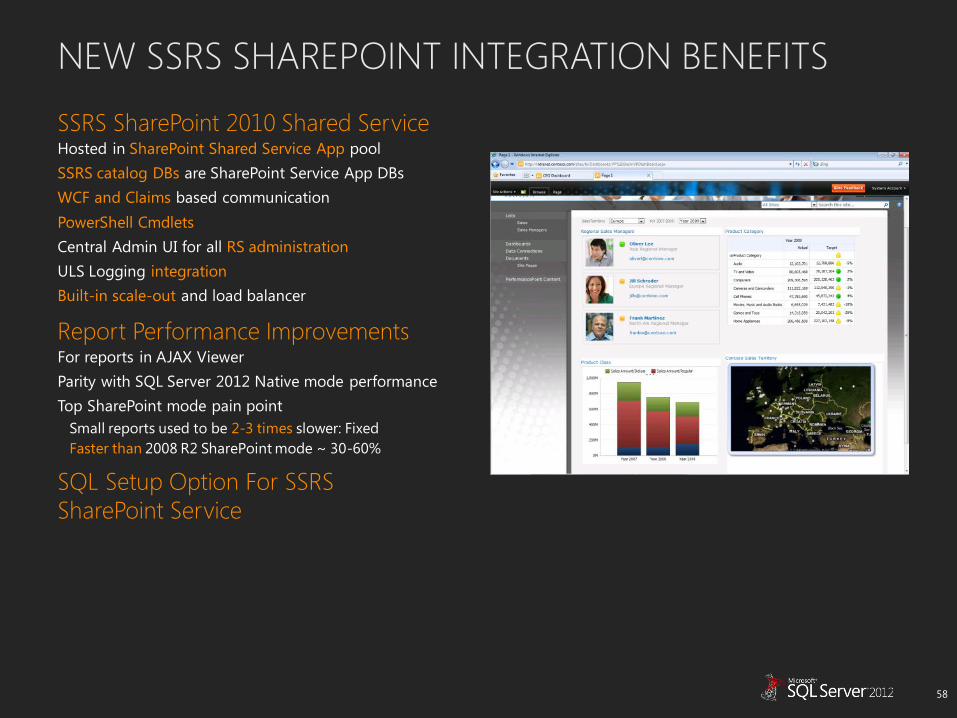
NEW SSRS SHAREPOINT INTEGRATION BENEFITS
SSRS SharePoint 2010 Shared Service Hosted in SharePoint Shared Service App pool
SSRS catalog DBs are SharePoint Service App DBs
WCF and Claims based communication
PowerShell Cmdlets
Central Admin UI for all RS administration
ULS Logging integration
Built-in scale-out and load balancer
Report Performance Improvements For reports in AJAX Viewer
Parity with SQL Server 2012 Native mode performance
Top SharePoint mode pain point
Small reports used to be 2-3 times slower: Fixed
Faster than 2008 R2 SharePoint mode ~ 30-60%
SQL Setup Option For SSRS SharePoint Service
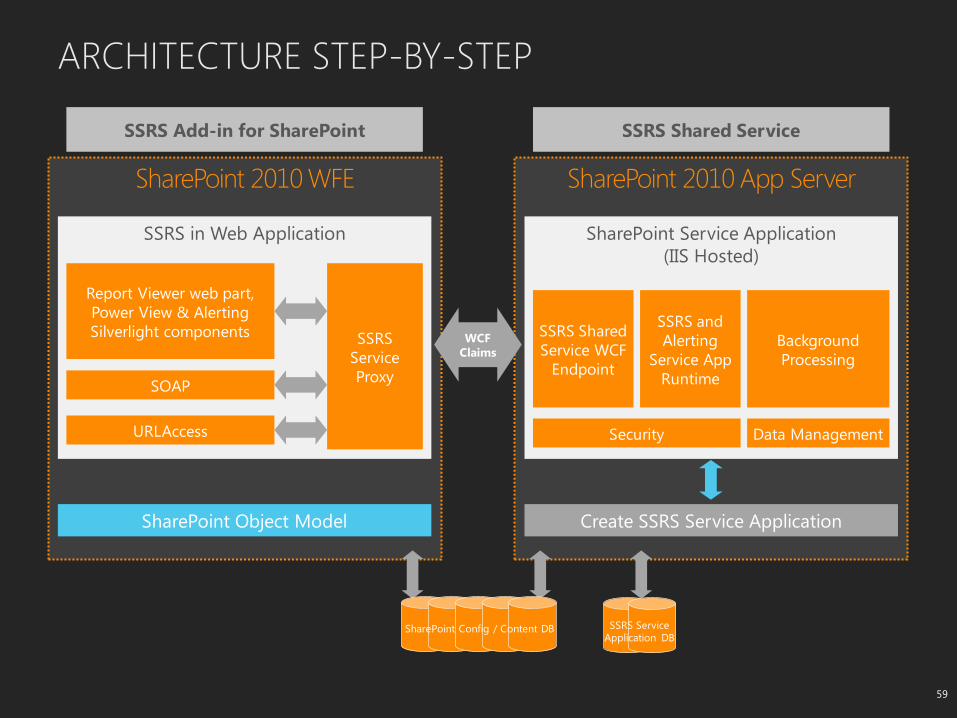
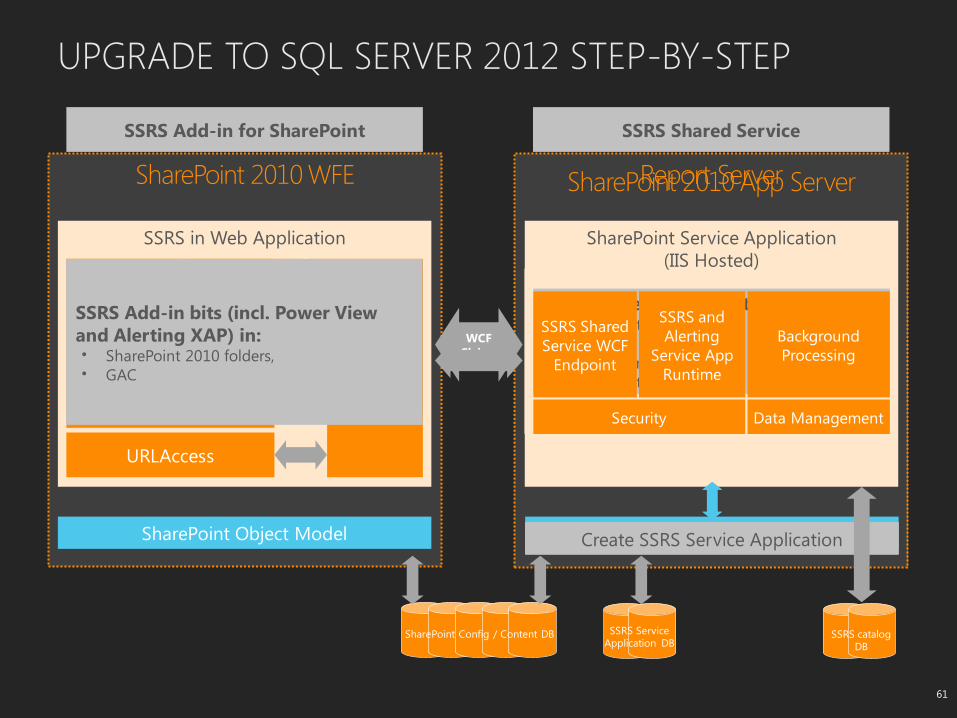
UPGRADE TO SQL SERVER 2012 STEP-BY-STEP
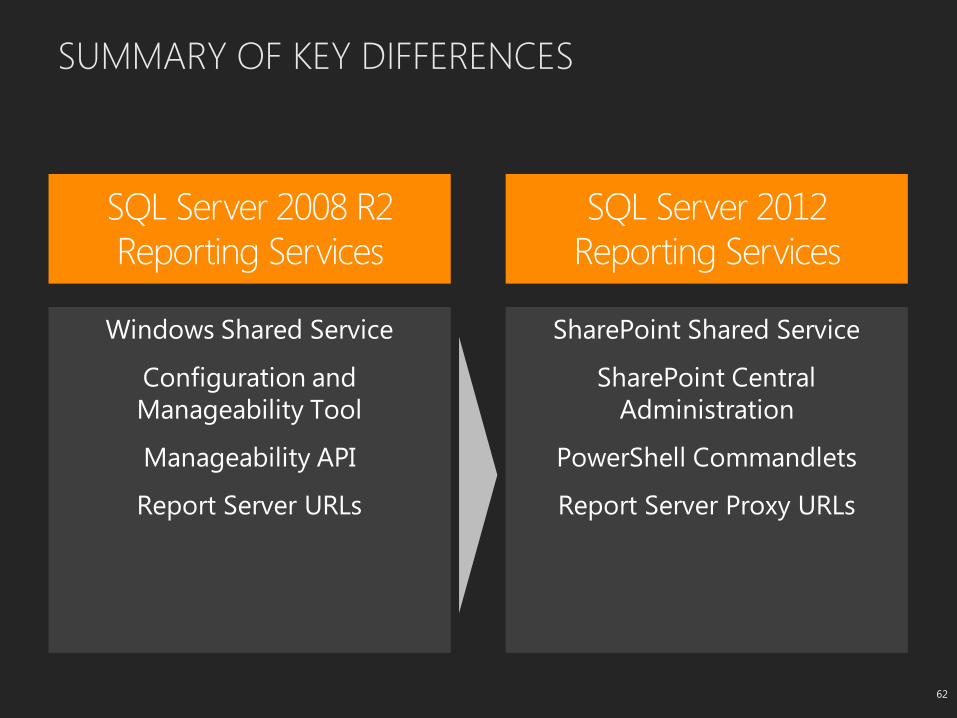
SUMMARY OF KEY DIFFERENCES

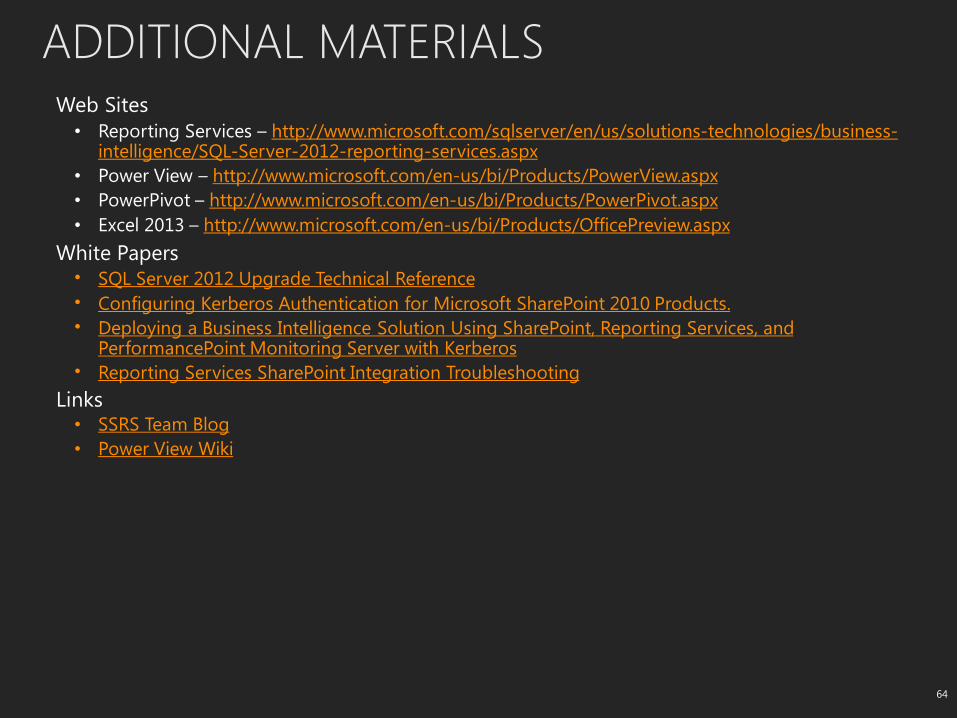
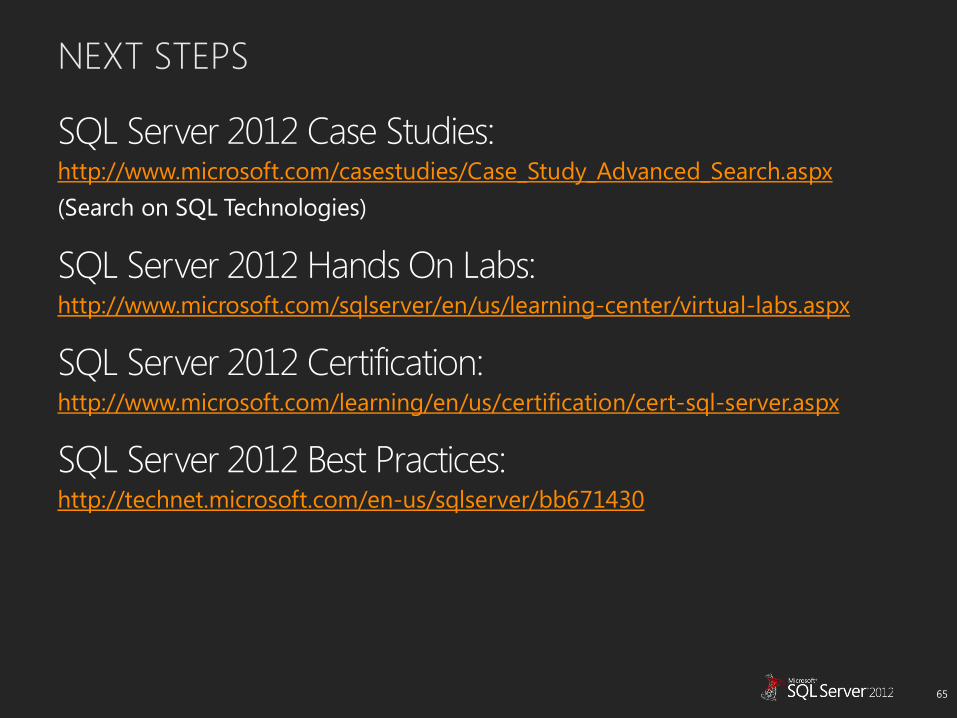
ADDITIONAL MATERIALS Web Sites
• Reporting Services – http://www.microsoft.com/sqlserver/en/us/solutions-technologies/business-intelligence/SQL-Server-2012-reporting-services.aspx
• Power View – http://www.microsoft.com/en-us/bi/Products/PowerView.aspx
• PowerPivot – http://www.microsoft.com/en-us/bi/Products/PowerPivot.aspx
• Excel 2013 – http://www.microsoft.com/en-us/bi/Products/OfficePreview.aspx
White Papers • SQL Server 2012 Upgrade Technical Reference
• Configuring Kerberos Authentication for Microsoft SharePoint 2010 Products.
• Deploying a Business Intelligence Solution Using SharePoint, Reporting Services, and PerformancePoint Monitoring Server with Kerberos
• Reporting Services SharePoint Integration Troubleshooting
Links • SSRS Team Blog
• Power View Wiki
© 2011 Microsoft Corporation. All rights reserved. Microsoft, Windows, Windows Vista and other product names are or may be registered trademarks and/or trademarks in the U.S. and/or other countries.
The information herein is for informational purposes only and represents the current view of Microsoft Corporation as of the date of this presentation. Because Microsoft must respond to changing market conditions, it should not be interpreted to be a commitment on the part of Microsoft, and Microsoft cannot guarantee the accuracy of any information provided after the date of this presentation.
MICROSOFT MAKES NO WARRANTIES, EXPRESS, IMPLIED OR STATUTORY, AS TO THE INFORMATION IN THIS PRESENTATION.


![[MS-SSSO]: SQL Server System Overview...SQL Server 2008, Microsoft SQL Server 2008 R2, Microsoft SQL Server 2012, and Microsoft SQL Server 2014. The specific release is indicated when](https://img.dokumen.tips/doc/110x75/5f77a3d14379c025977fc448/ms-ssso-sql-server-system-overview-sql-server-2008-microsoft-sql-server.jpg)