Embed Size (px)
Citation preview

1
Provide the right support

2 www.discoversharepoint.com/IThelpdesk
Provide the right support
You can create many code-free solutions with SharePoint.
Let’s see how this process works, using help desk tickets as an example.

3 www.discoversharepoint.com/IThelpdesk
Issue a help desk request
Use a custom list to capture requests.
You can customize these requests with a title, priority, and description before submitting it with the Save button.
4 www.discoversharepoint.com/IThelpdesk
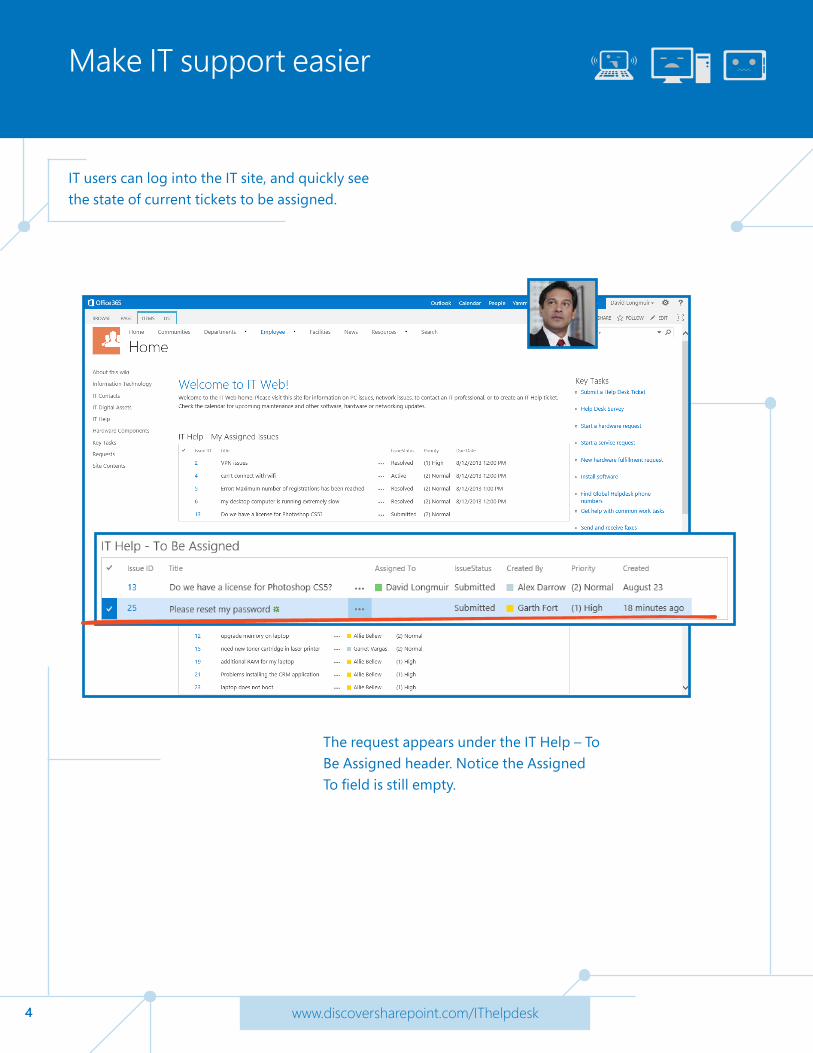
Make IT support easier
IT users can log into the IT site, and quickly see the state of current tickets to be assigned.
The request appears under the IT Help – To Be Assigned header. Notice the Assigned To field is still empty.

5 www.discoversharepoint.com/IThelpdesk
Assign a help desk request
In this example, assigning the ticket is a simple process—just click the request and edit the appropriate fields.

6 www.discoversharepoint.com/IThelpdesk
Reset a password
A workflow associated with the help desk request automatically sends a notification.
Assignees can access the ticket by simply clicking the link in the notification.

7 www.discoversharepoint.com/IThelpdesk
Communicate easily through Lync
Lync integration also facilitates communication about tickets.
Simply click the green Lync presence indicator to open the instant message window.

8 www.discoversharepoint.com/IThelpdesk
Resolve issues quickly
After resolving the issue, just update the relevant fields in the ticket.

9 www.discoversharepoint.com/IThelpdesk
Build dashboards with Excel
You can also create dashboards that visually display data through Excel, and integrate them directly in SharePoint sites.

10 www.discoversharepoint.com/IThelpdesk
Export data to Excel
To generate a dashboard, export data from SharePoint to Excel.
First, navigate to a list that is currently storing data.

11 www.discoversharepoint.com/IThelpdesk
Export list data to Excel
After navigating to the desired list, simply select Export to Excel.
12 www.discoversharepoint.com/IThelpdesk
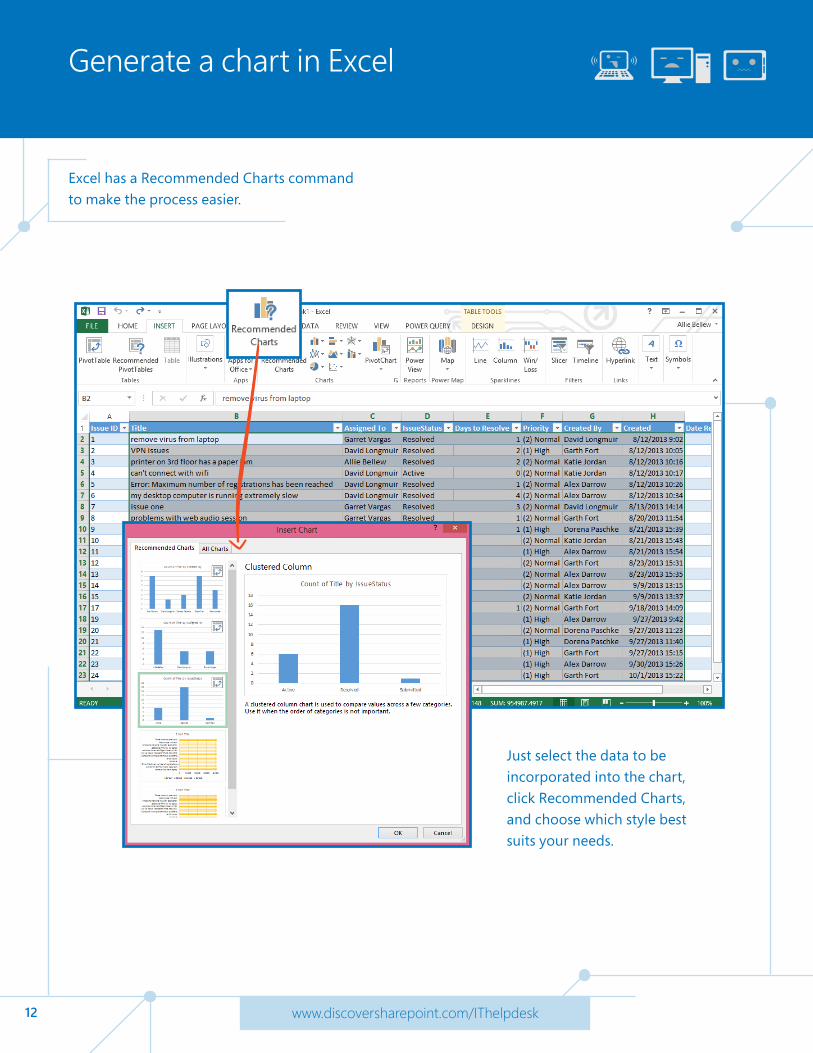
Generate a chart in Excel
Excel has a Recommended Charts command to make the process easier.
Just select the data to be incorporated into the chart, click Recommended Charts, and choose which style best suits your needs.

13 www.discoversharepoint.com/IThelpdesk
Import a chart to SharePoint
Importing the chart to SharePoint is a simple process.
After selecting Save As in Excel, pick a document library in SharePoint and give the Excel workbook a name. The chart is now ready to be placed in an Excel Web Access Web Part on a Web Part page.

14 www.discoversharepoint.com/IThelpdesk
Create a chart page
To display your new chart in SharePoint, first create a new page.
15 www.discoversharepoint.com/IThelpdesk
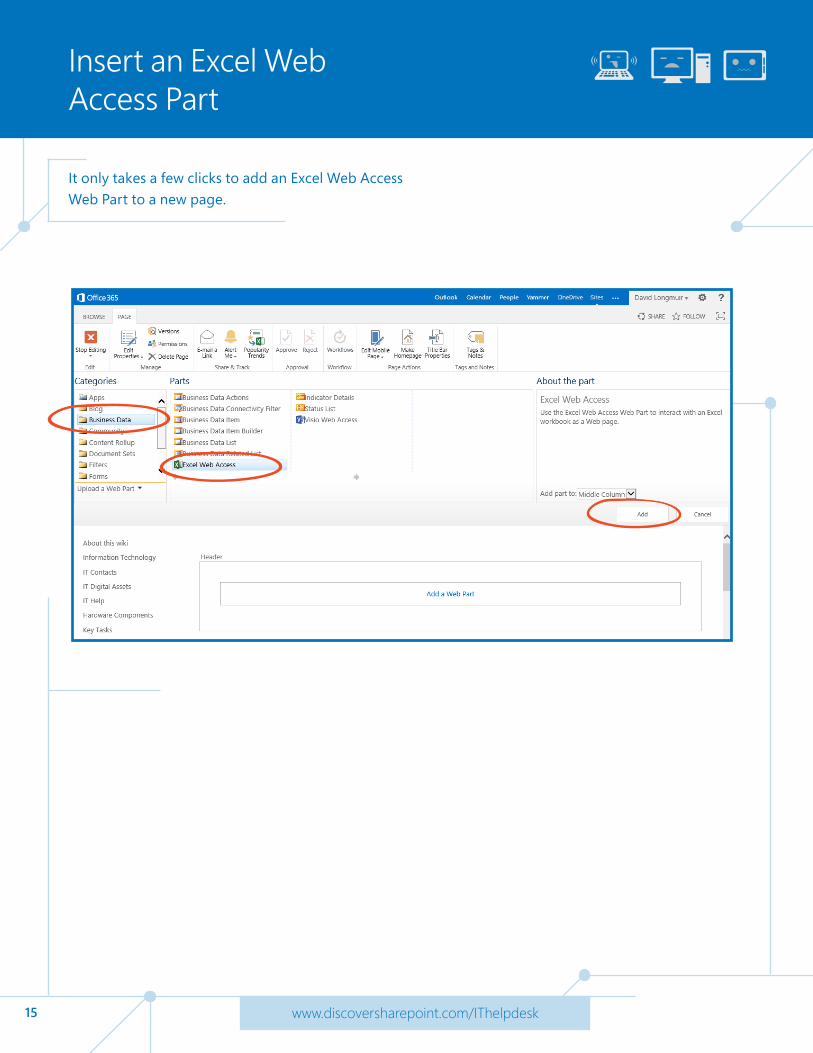
Insert an Excel Web Access Part
It only takes a few clicks to add an Excel Web Access Web Part to a new page.

16 www.discoversharepoint.com/IThelpdesk
Import Excel data
To link your Excel Web Part to its data source, open the tool pane, and then navigate to the workbook by clicking the ellipsis next to the Workbook field.
Select the Excel workbook which contains the data for your chart and insert it.

17 www.discoversharepoint.com/IThelpdesk
Use an Excel chart in SharePoint
Your chart is now integrated into your SharePoint site.

18 www.discoversharepoint.com/IThelpdesk
Create a satisfaction survey
SharePoint includes a Survey Template that allows users to supply questions and various options for responses.
In this example of a help desk survey, go to the Helpdesk Survey list from the IT Web home page.

19 www.discoversharepoint.com/IThelpdesk
Add new questions to a survey
Adding questions to a survey is a simple process.
Here you can see the existing questions on the survey, and add any additional questions.
20 www.discoversharepoint.com/IThelpdesk
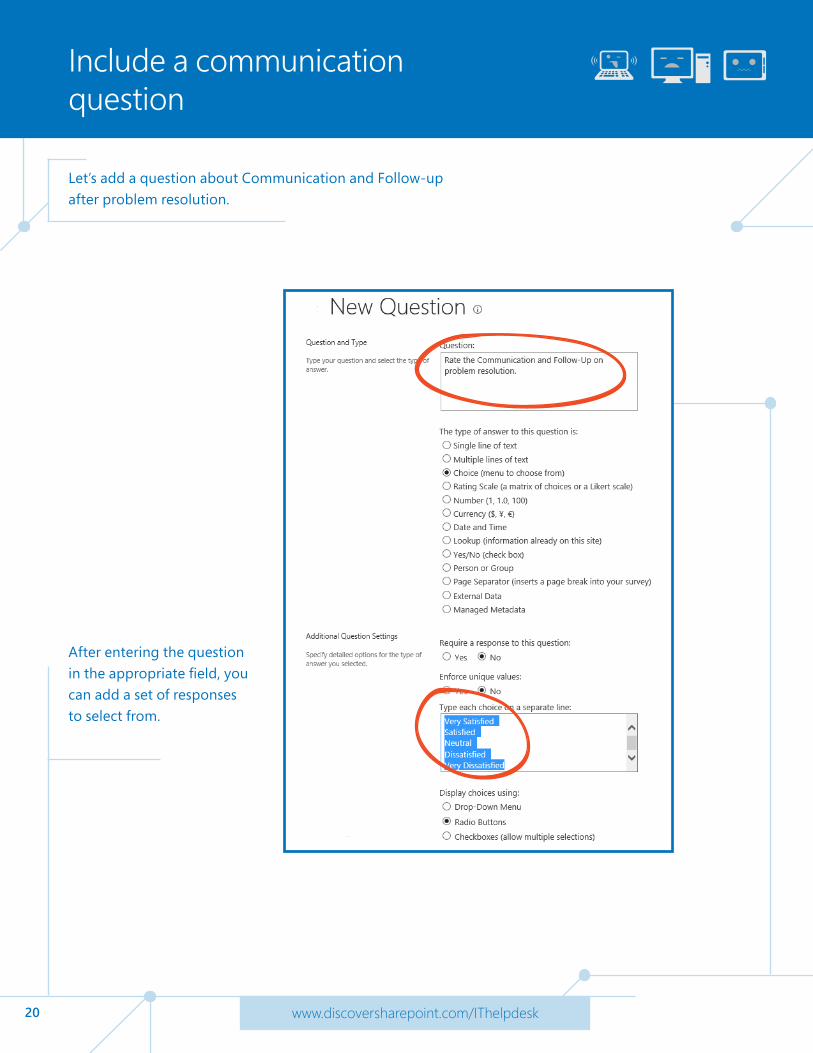
Include a communication question
Let’s add a question about Communication and Follow-up after problem resolution.
After entering the question in the appropriate field, you can add a set of responses to select from.

21 www.discoversharepoint.com/IThelpdesk
Examine survey responses
SharePoint survey responses can be shown in a graphical summary.
Simply click the Show a graphical summary of responses link, and the page displays the results.

22 www.discoversharepoint.com/IThelpdesk
Use Visio in SharePoint
Visio graphic services is another way to visually display data from SharePoint.
In many cases, key performance indicators (KPIs) improve the reaction time needed to support the environment and provide the ability to visually view the status of dynamically changing items.

23 www.discoversharepoint.com/IThelpdesk
Create a Visio diagram
Let’s look at an existing diagram in Visio, one that’s based upon the same diagram that exists in SharePoint.
We can automatically link the Visio diagram to the data stored in SharePoint.
24 www.discoversharepoint.com/IThelpdesk
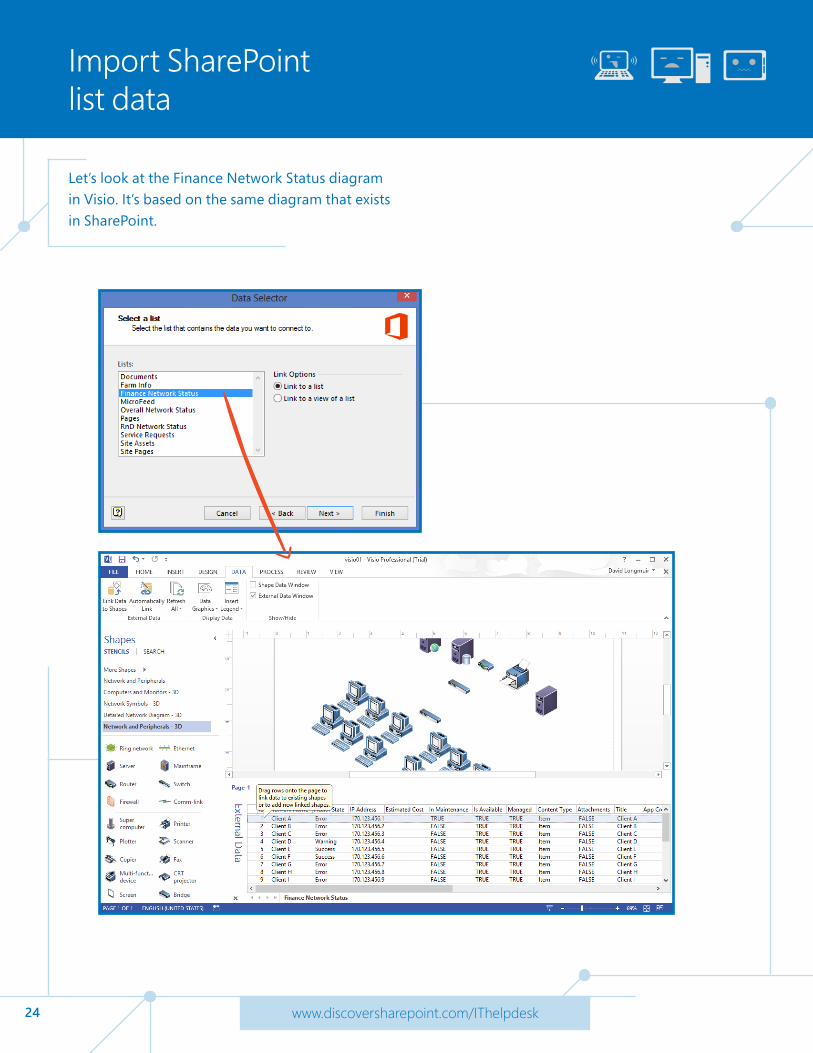
Import SharePoint list data
Let’s look at the Finance Network Status diagram in Visio. It’s based on the same diagram that exists in SharePoint.
25 www.discoversharepoint.com/IThelpdesk
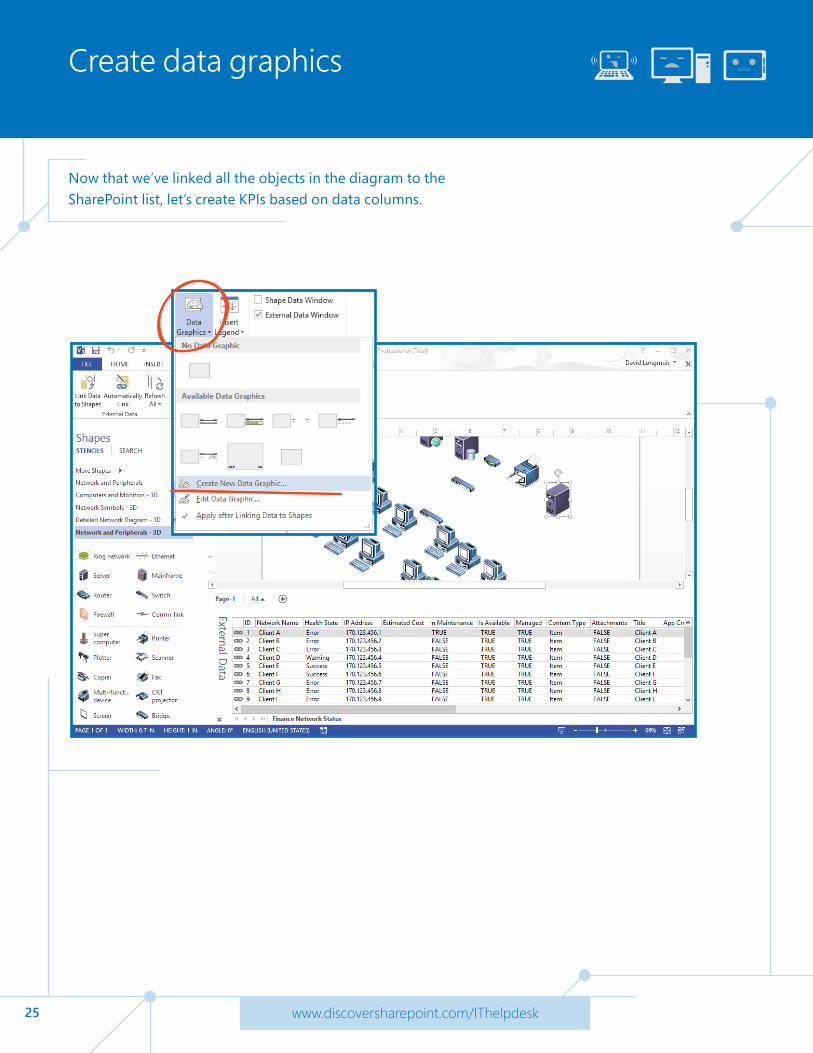
Create data graphics
Now that we’ve linked all the objects in the diagram to the SharePoint list, let’s create KPIs based on data columns.
26 www.discoversharepoint.com/IThelpdesk
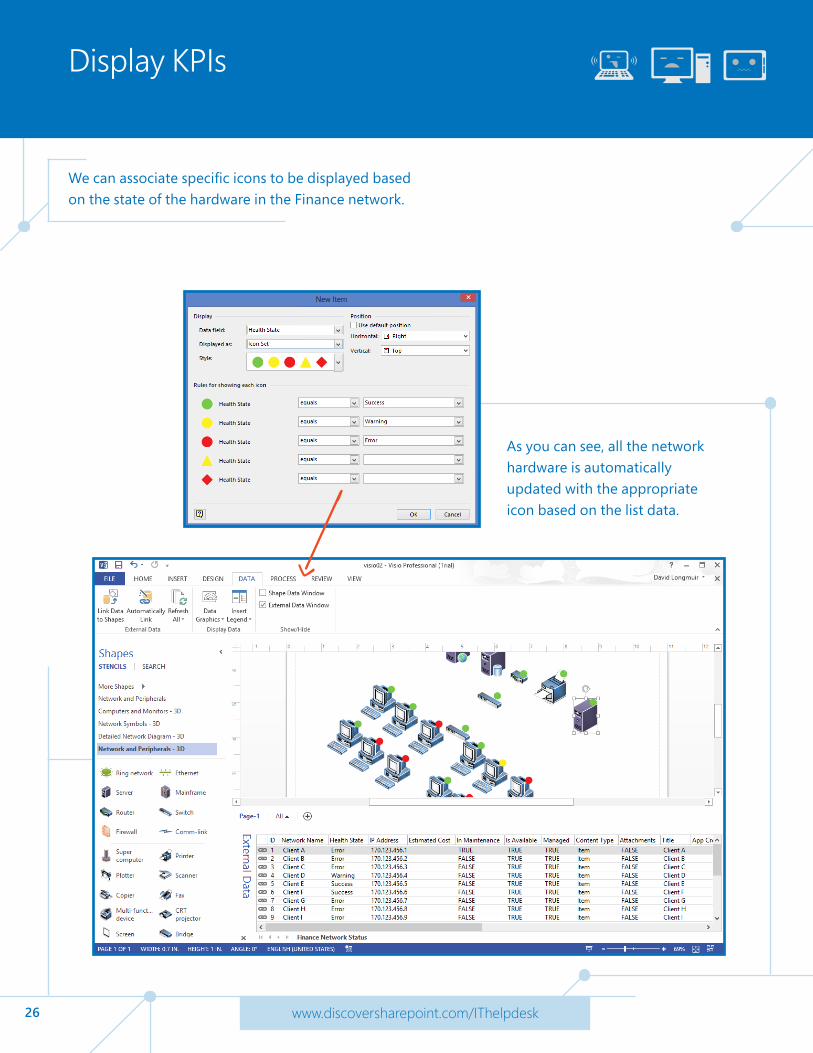
Display KPIs
We can associate specific icons to be displayed based on the state of the hardware in the Finance network.
As you can see, all the network hardware is automatically updated with the appropriate icon based on the list data.

27 www.discoversharepoint.com/IThelpdesk
Learn more
Office 365 for Business Learning Centerhttp://aka.ms/o365learning