Embed Size (px)
Citation preview
Zabbix Tool for Graph Visualization
Serg Mescheryakov, D.Sc., Professor
Dmitry Shchemelinin, Ph.D.
Dmitry Tigrov, M.B.A.
RingCentral Inc., San Mateo, CA, USA
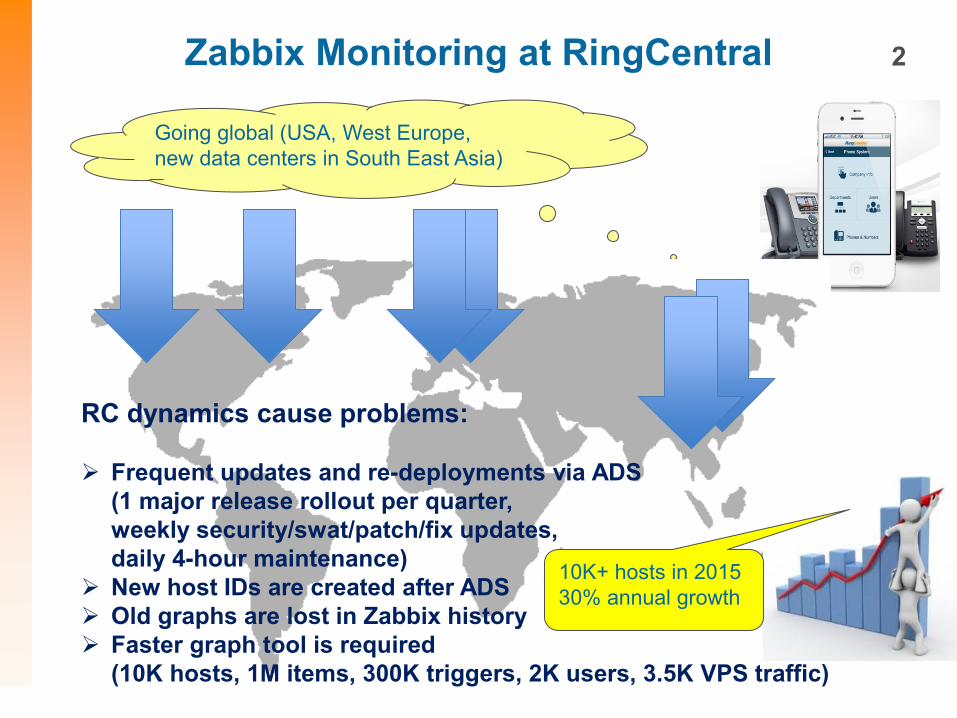
Zabbix Monitoring at RingCentral
Going global (USA, West Europe,
new data centers in South East Asia)
2
RC dynamics cause problems:
Frequent updates and re-deployments via ADS
(1 major release rollout per quarter,
weekly security/swat/patch/fix updates,
daily 4-hour maintenance)
New host IDs are created after ADS
Old graphs are lost in Zabbix history
Faster graph tool is required
(10K hosts, 1M items, 300K triggers, 2K users, 3.5K VPS traffic)
10K+ hosts in 2015
30% annual growth
Background
3
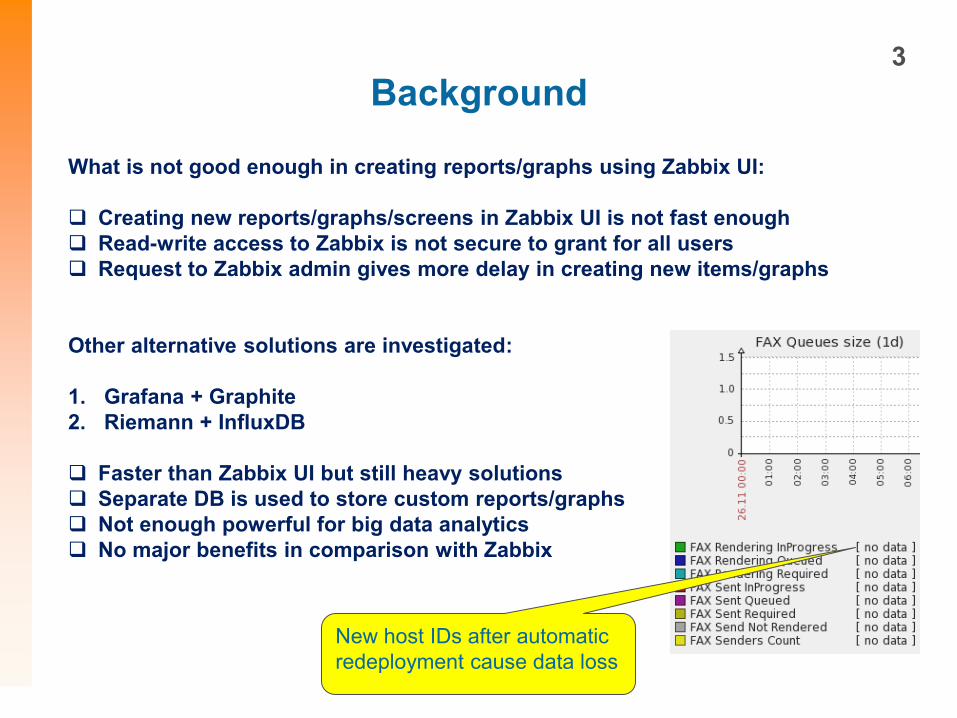
What is not good enough in creating reports/graphs using Zabbix UI:
Creating new reports/graphs/screens in Zabbix UI is not fast enough
Read-write access to Zabbix is not secure to grant for all users
Request to Zabbix admin gives more delay in creating new items/graphs
Other alternative solutions are investigated:
1. Grafana + Graphite
2. Riemann + InfluxDB
Faster than Zabbix UI but still heavy solutions
Separate DB is used to store custom reports/graphs
Not enough powerful for big data analytics
No major benefits in comparison with Zabbix
New host IDs after automatic
redeployment cause data loss
Zabbix Graph Tool Architecture
4
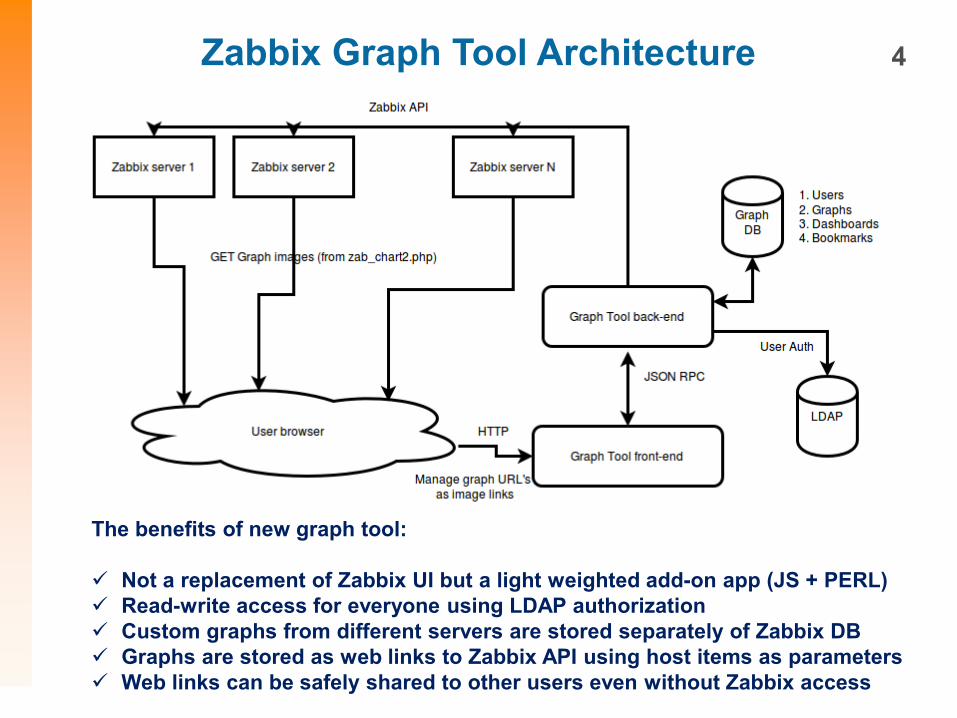
The benefits of new graph tool:
Not a replacement of Zabbix UI but a light weighted add-on app (JS + PERL)
Read-write access for everyone using LDAP authorization
Custom graphs from different servers are stored separately of Zabbix DB
Graphs are stored as web links to Zabbix API using host items as parameters
Web links can be safely shared to other users even without Zabbix access
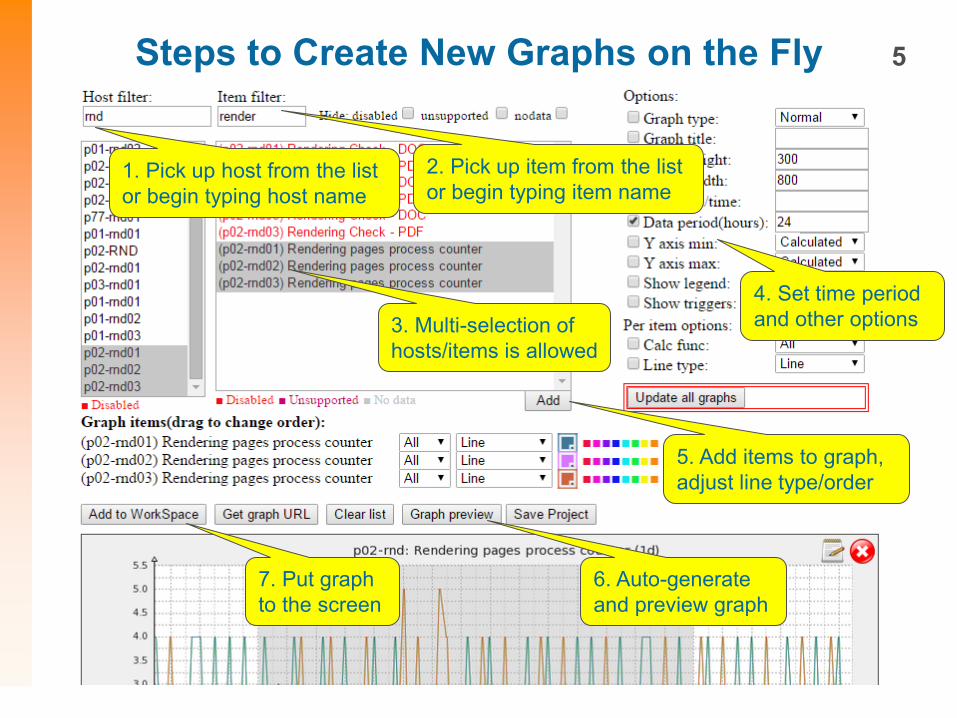
Steps to Create New Graphs on the Fly
5
1. Pick up host from the list
or begin typing host name
2. Pick up item from the list
or begin typing item name
3. Multi-selection of
hosts/items is allowed
5. Add items to graph,
adjust line type/order
6. Auto-generate
and preview graph
7. Put graph
to the screen
4. Set time period
and other options
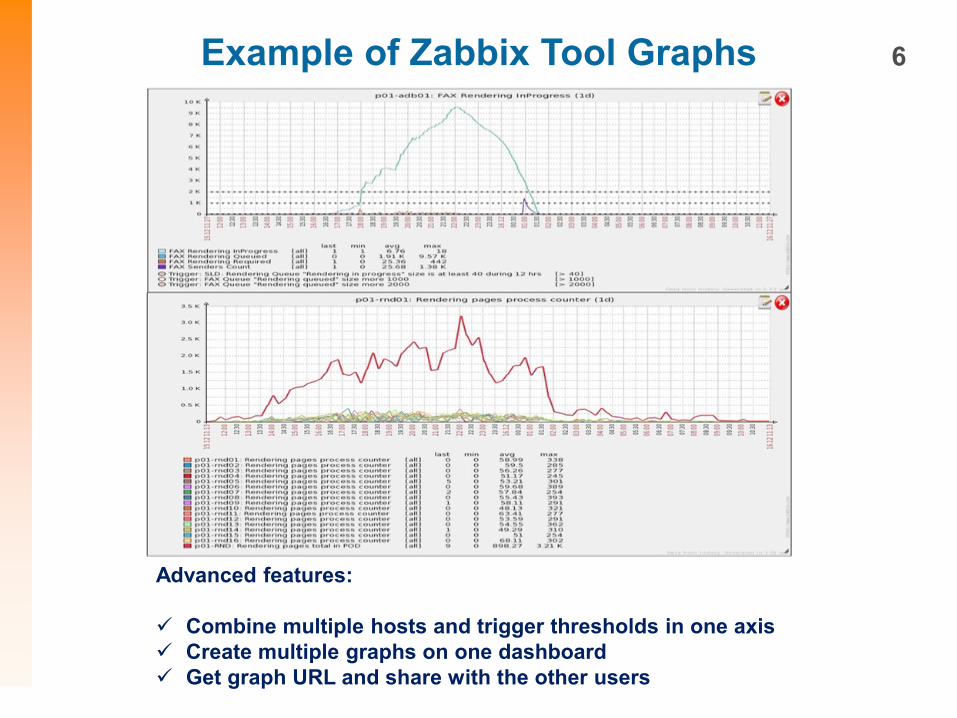
Example of Zabbix Tool Graphs
6
Advanced features:
Combine multiple hosts and trigger thresholds in one axis
Create multiple graphs on one dashboard
Get graph URL and share with the other users
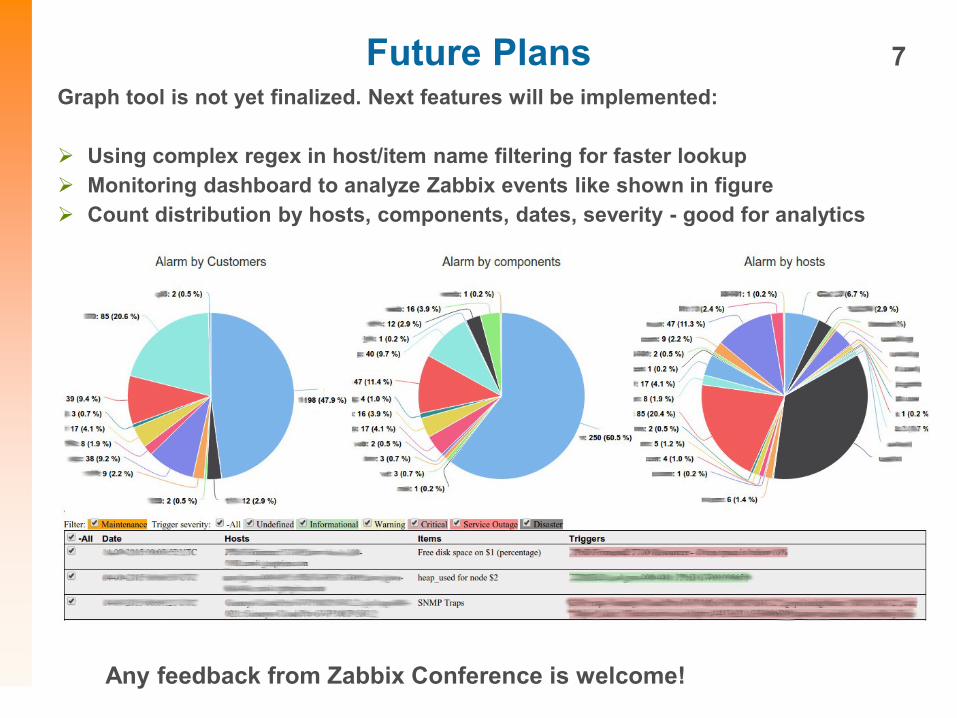
Future Plans
7
Graph tool is not yet finalized. Next features will be implemented:
Using complex regex in host/item name filtering for faster lookup
Monitoring dashboard to analyze Zabbix events like shown in figure
Count distribution by hosts, components, dates, severity - good for analytics
Any feedback from Zabbix Conference is welcome!


![Zabbix & Security · [root@node03 zabbix-4.4.6]# cat /tmp/zabbix_server.log 27439:20201018:231117.705 Starting Zabbix Server. Zabbix 4.4.6 (revision 8cc702429d). 27439:20201018:231117.705](https://img.dokumen.tips/doc/110x75/60bc81e22945260dcd4c9701/zabbix-security-rootnode03-zabbix-446-cat-tmpzabbixserverlog-2743920201018231117705.jpg)


![Zabbix 1.8 Manual [Zabbix]](https://img.dokumen.tips/doc/110x75/543fdd4cb1af9fd9168b4a93/zabbix-18-manual-zabbix.jpg)