Embed Size (px)
Citation preview
Aquilla
Samsung Electronics Results Q1 2015Summary and Commentary
(Based on Samsung’s un-audited earnings release 29th April 2015, in KRW)
Note: Samsung Q1 = Calendar Q1
The following slides are in USD, converted from the KRW results using quarter-end exchange rates. This provides the most relevant comparisons with global technology companies.
(Samsung has not yet released its Dollarised results, which when available may vary depending on the mix of exchange rates and currency hedges employed by the company)
These data are derived from results published by Apple, Inc., from the published results
of other companies, and from assorted independent analysts, as identified in the slides.
The opinions are those of the author, and should in no way be interpreted as
investment advice.
Aquilla
Samsung Electronics
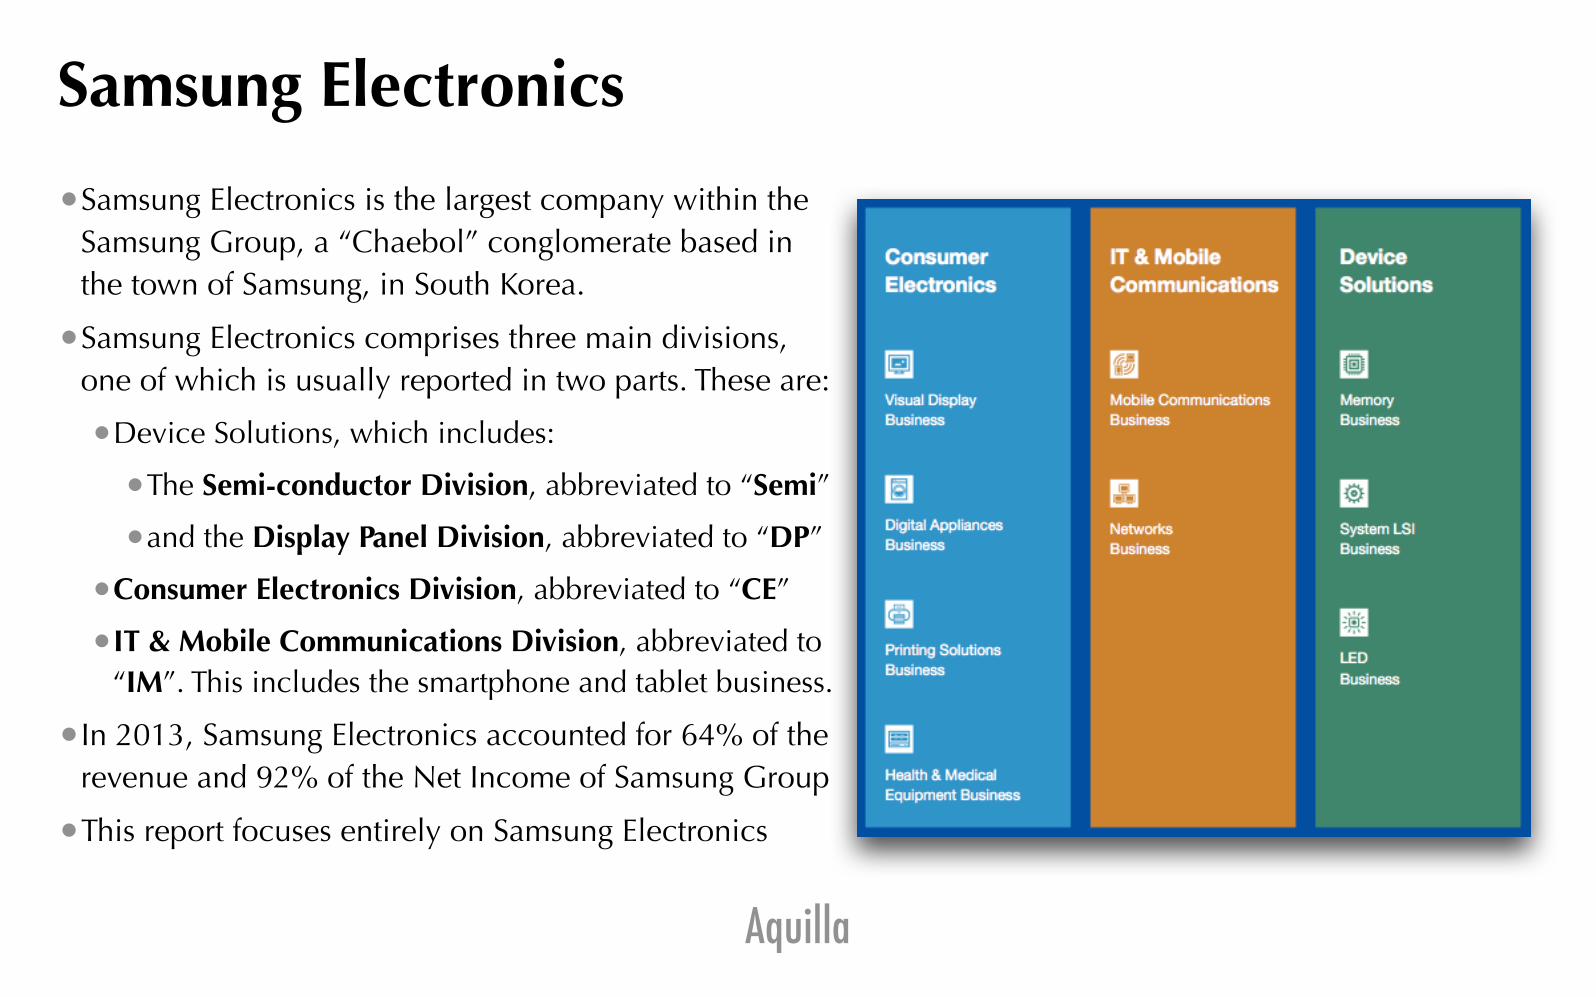
•Samsung Electronics is the largest company within the Samsung Group, a “Chaebol” conglomerate based in the town of Samsung, in South Korea.
•Samsung Electronics comprises three main divisions, one of which is usually reported in two parts. These are:
•Device Solutions, which includes:
•The Semi-conductor Division, abbreviated to “Semi”
•and the Display Panel Division, abbreviated to “DP”
•Consumer Electronics Division, abbreviated to “CE”
•IT & Mobile Communications Division, abbreviated to “IM”. This includes the smartphone and tablet business.
•In 2013, Samsung Electronics accounted for 64% of the revenue and 92% of the Net Income of Samsung Group
•This report focuses entirely on Samsung Electronics
AquillaSource: Samsung Electronics Results
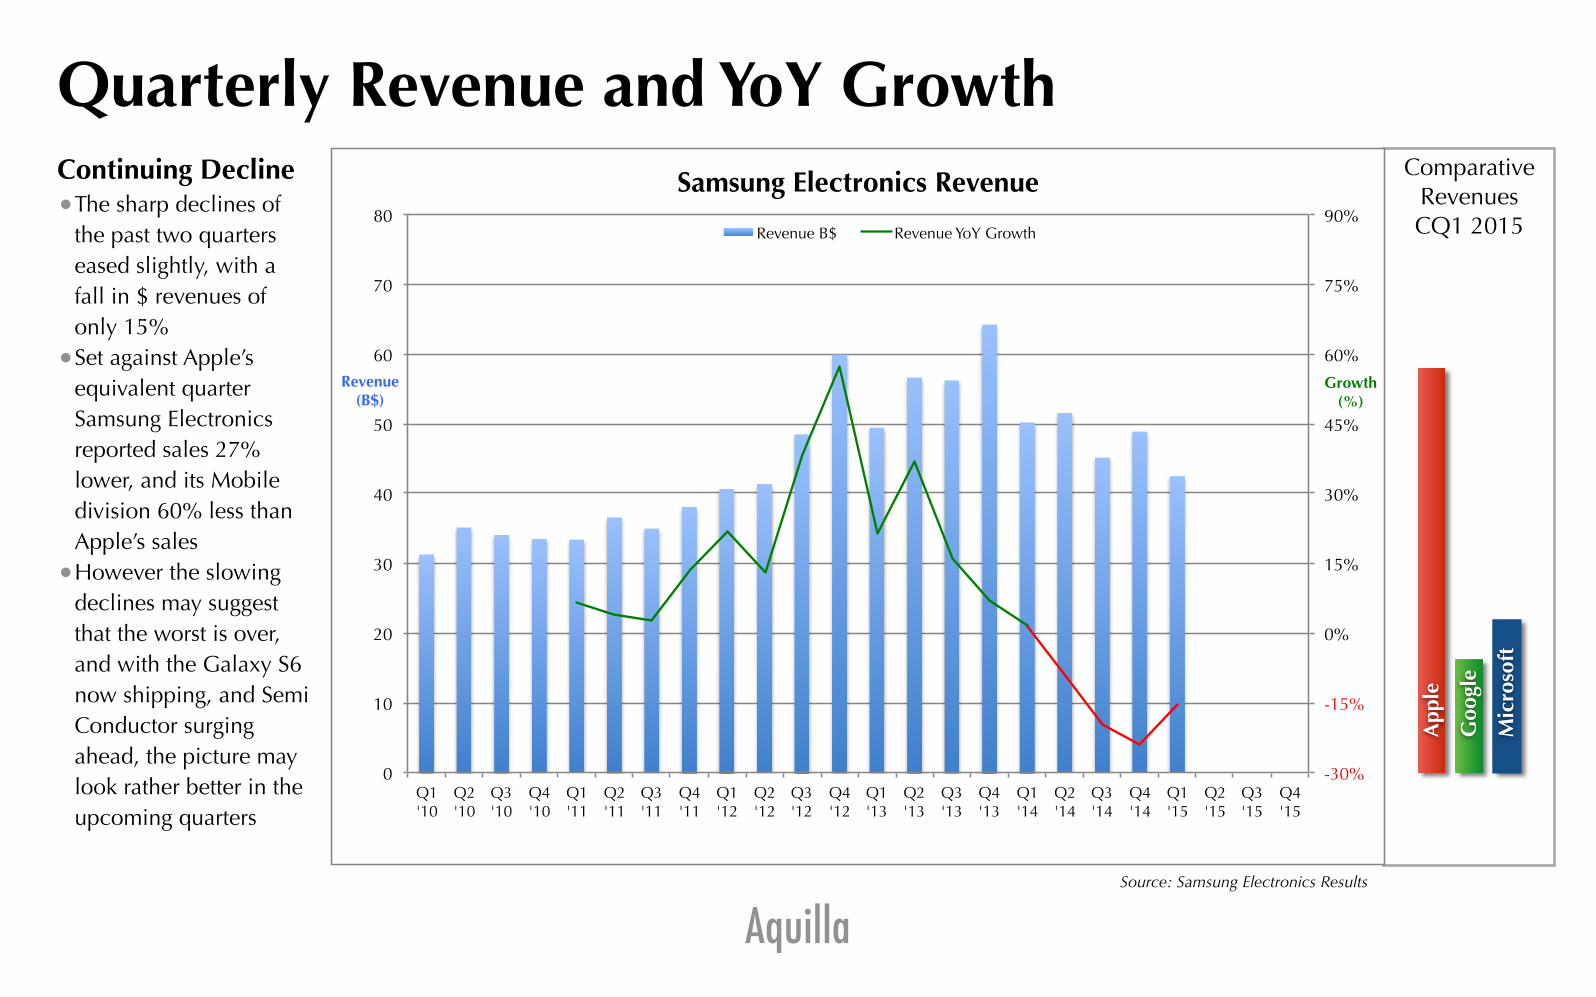
Quarterly Revenue and YoY GrowthContinuing Decline •The sharp declines of
the past two quarters eased slightly, with a fall in $ revenues of only 15%
•Set against Apple’s equivalent quarter Samsung Electronics reported sales 27% lower, and its Mobile division 60% less than Apple’s sales
•However the slowing declines may suggest that the worst is over, and with the Galaxy S6 now shipping, and Semi Conductor surging ahead, the picture may look rather better in the upcoming quarters
Comparative Revenues CQ1 2015
App
le
Mic
roso
ft
Goo
gle
-30%
-15%
0%
15%
30%
45%
60%
75%
90%
0
10
20
30
40
50
60
70
80
Q1 '10
Q2 '10
Q3 '10
Q4 '10
Q1 '11
Q2 '11
Q3 '11
Q4 '11
Q1 '12
Q2 '12
Q3 '12
Q4 '12
Q1 '13
Q2 '13
Q3 '13
Q4 '13
Q1 '14
Q2 '14
Q3 '14
Q4 '14
Q1 '15
Q2 '15
Q3 '15
Q4 '15
Growth (%)
Revenue (B$)
Samsung Electronics Revenue
Revenue B$ Revenue YoY Growth
AquillaSource: Samsung Electronics Results
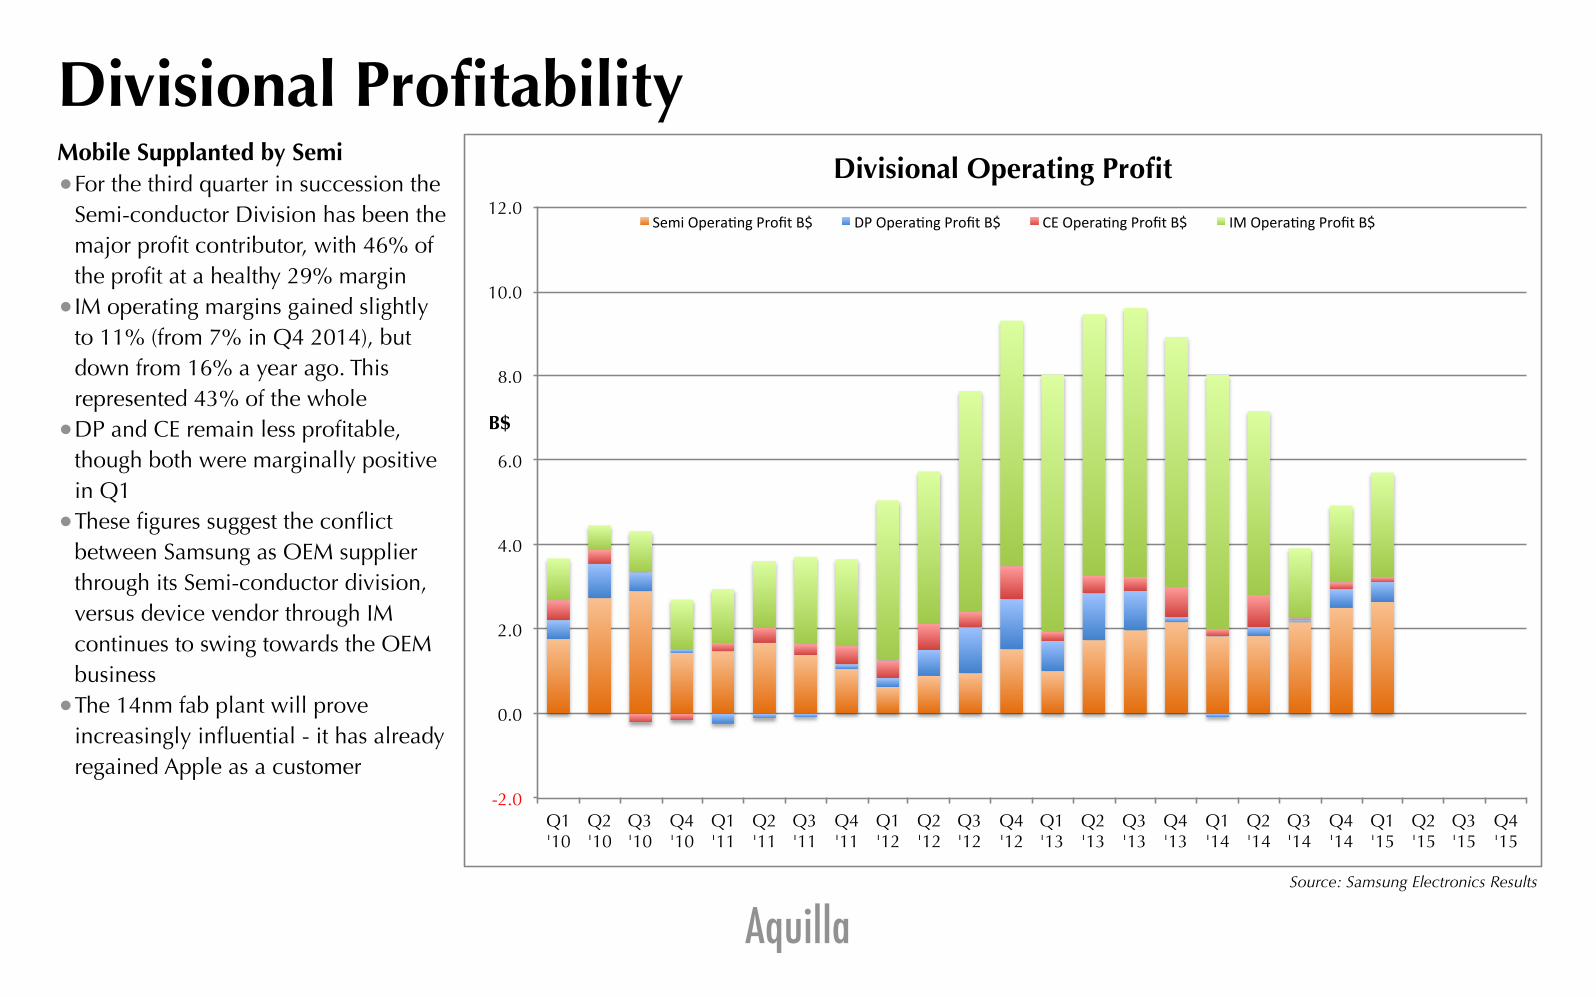
Divisional ProfitabilityMobile Supplanted by Semi •For the third quarter in succession the
Semi-conductor Division has been the major profit contributor, with 46% of the profit at a healthy 29% margin
•IM operating margins gained slightly to 11% (from 7% in Q4 2014), but down from 16% a year ago. This represented 43% of the whole
•DP and CE remain less profitable, though both were marginally positive in Q1
•These figures suggest the conflict between Samsung as OEM supplier through its Semi-conductor division, versus device vendor through IM continues to swing towards the OEM business
•The 14nm fab plant will prove increasingly influential - it has already regained Apple as a customer
-2.0
0.0
2.0
4.0
6.0
8.0
10.0
12.0
Q1 '10
Q2 '10
Q3 '10
Q4 '10
Q1 '11
Q2 '11
Q3 '11
Q4 '11
Q1 '12
Q2 '12
Q3 '12
Q4 '12
Q1 '13
Q2 '13
Q3 '13
Q4 '13
Q1 '14
Q2 '14
Q3 '14
Q4 '14
Q1 '15
Q2 '15
Q3 '15
Q4 '15
B$
Divisional Operating Profit
Semi%Opera*ng%Profit%B$% DP%Opera*ng%Profit%B$% CE%Opera*ng%Profit%B$% IM%Opera*ng%Profit%B$%
AquillaSource: Samsung Electronics Results
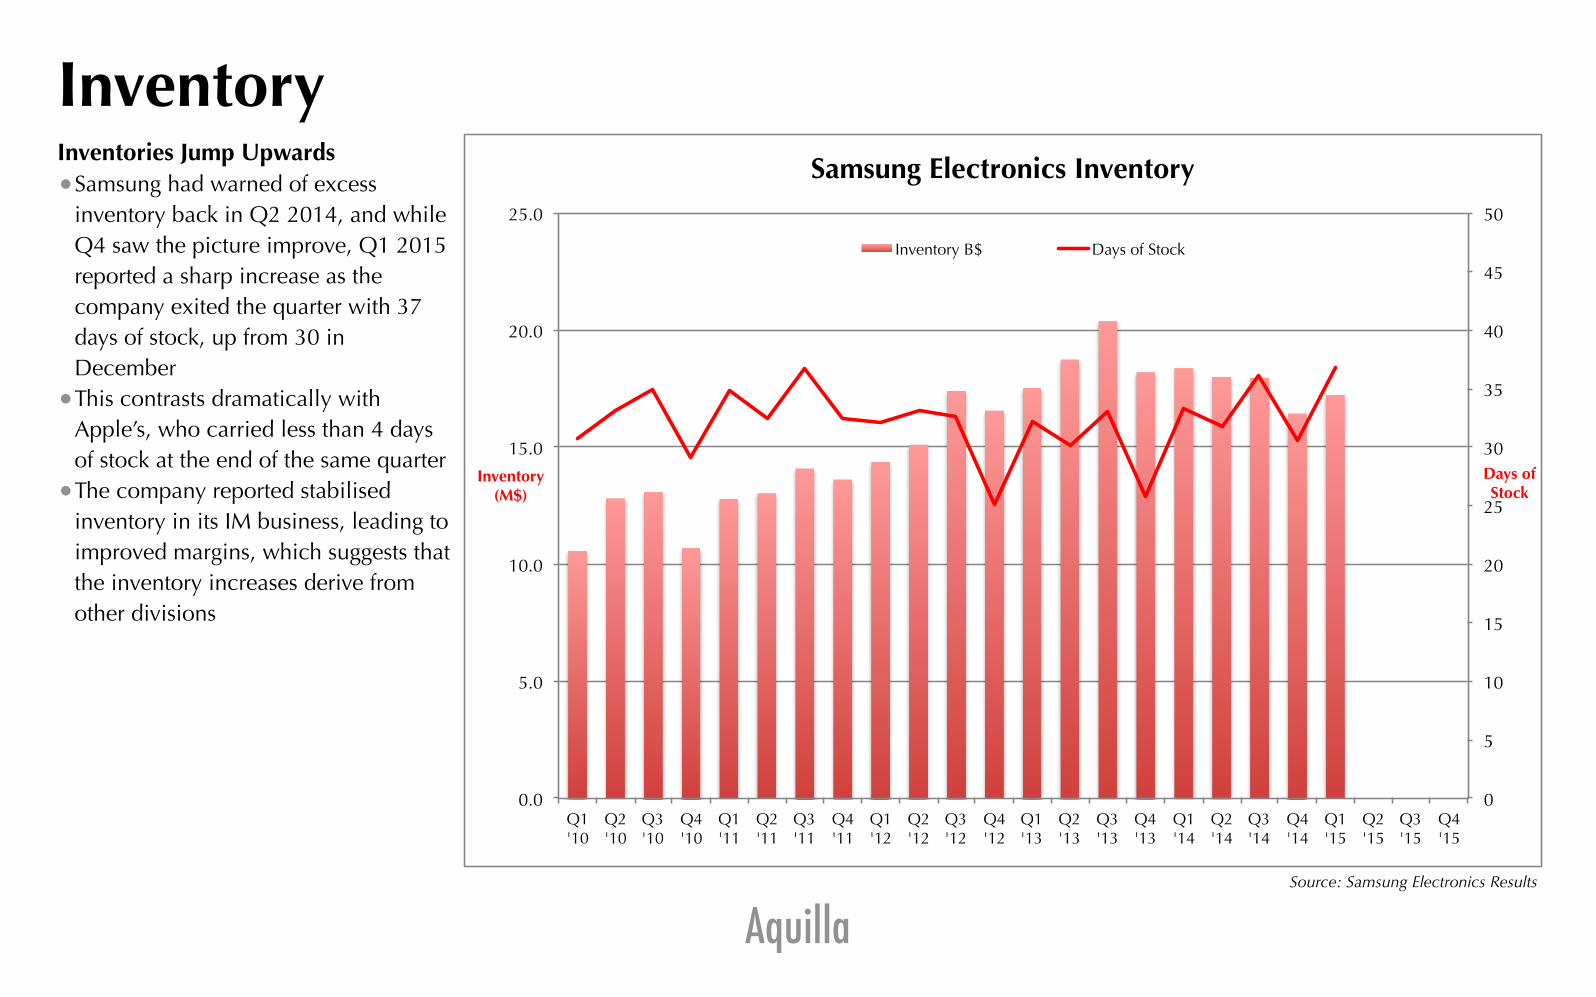
InventoryInventories Jump Upwards •Samsung had warned of excess
inventory back in Q2 2014, and while Q4 saw the picture improve, Q1 2015 reported a sharp increase as the company exited the quarter with 37 days of stock, up from 30 in December
•This contrasts dramatically with Apple’s, who carried less than 4 days of stock at the end of the same quarter
•The company reported stabilised inventory in its IM business, leading to improved margins, which suggests that the inventory increases derive from other divisions
0
5
10
15
20
25
30
35
40
45
50
0.0
5.0
10.0
15.0
20.0
25.0
Q1 '10
Q2 '10
Q3 '10
Q4 '10
Q1 '11
Q2 '11
Q3 '11
Q4 '11
Q1 '12
Q2 '12
Q3 '12
Q4 '12
Q1 '13
Q2 '13
Q3 '13
Q4 '13
Q1 '14
Q2 '14
Q3 '14
Q4 '14
Q1 '15
Q2 '15
Q3 '15
Q4 '15
Days of Stock
Inventory (M$)
Samsung Electronics Inventory
Inventory B$ Days of Stock
Aquilla
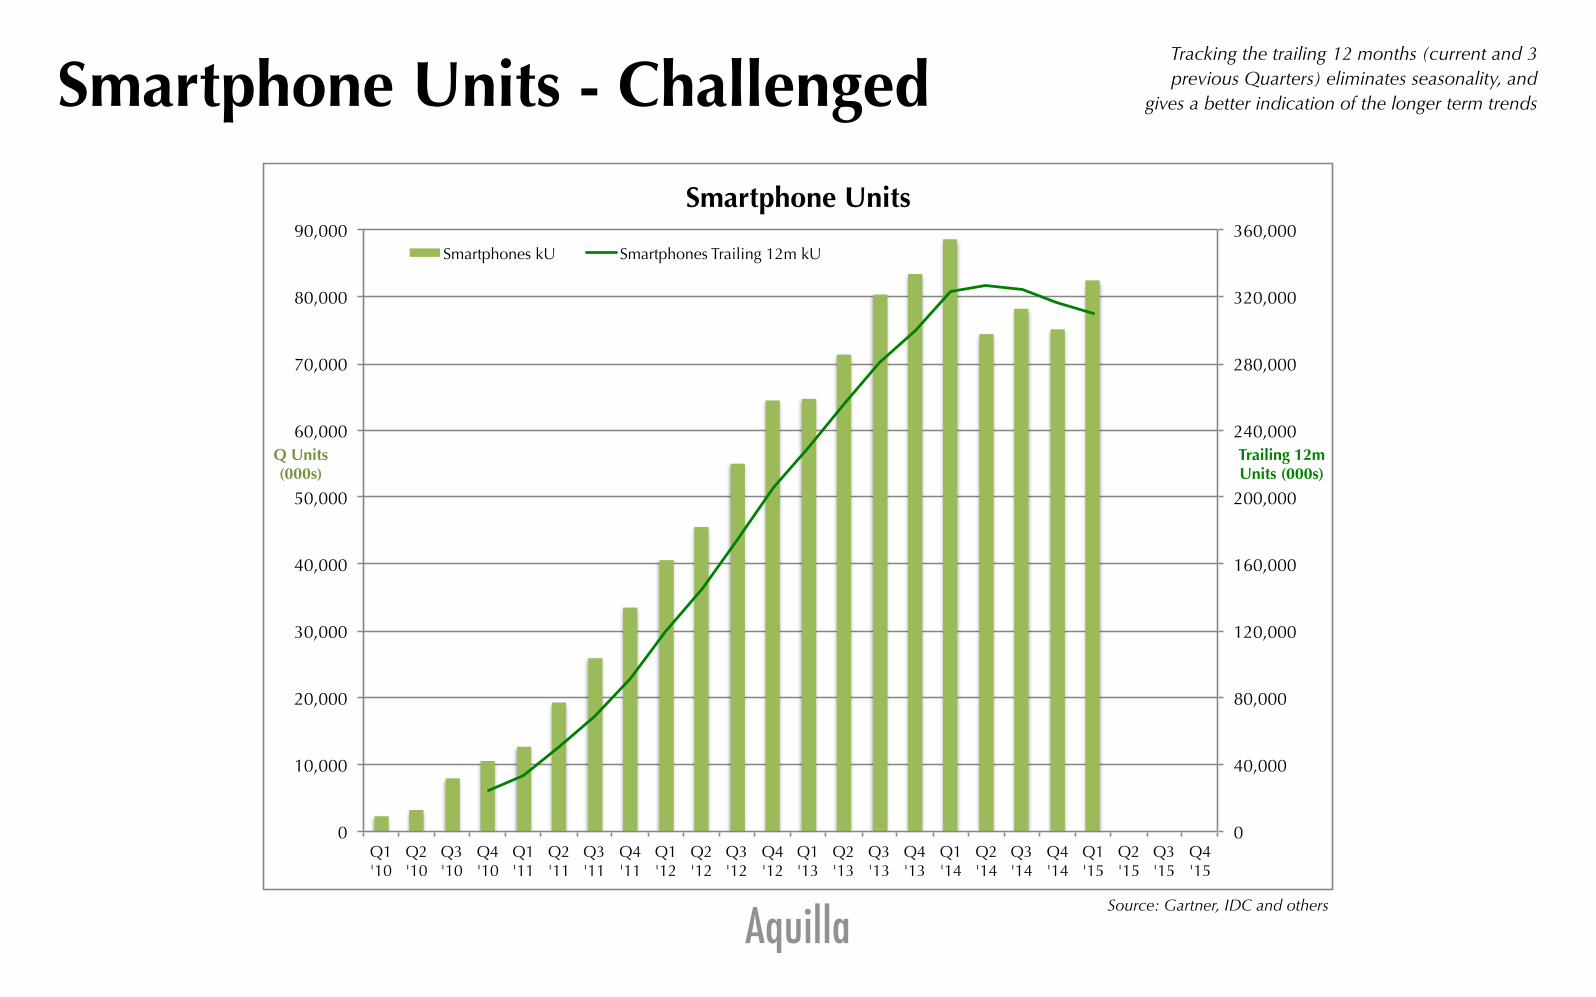
Smartphone Units - ChallengedTracking the trailing 12 months (current and 3
previous Quarters) eliminates seasonality, and
gives a better indication of the longer term trends
Source: Gartner, IDC and others
0
40,000
80,000
120,000
160,000
200,000
240,000
280,000
320,000
360,000
0
10,000
20,000
30,000
40,000
50,000
60,000
70,000
80,000
90,000
Q1 '10
Q2 '10
Q3 '10
Q4 '10
Q1 '11
Q2 '11
Q3 '11
Q4 '11
Q1 '12
Q2 '12
Q3 '12
Q4 '12
Q1 '13
Q2 '13
Q3 '13
Q4 '13
Q1 '14
Q2 '14
Q3 '14
Q4 '14
Q1 '15
Q2 '15
Q3 '15
Q4 '15
Trailing 12m Units (000s)
Q Units (000s)
Smartphone Units
Smartphones kU Smartphones Trailing 12m kU
AquillaSource: Samsung Electronics Results
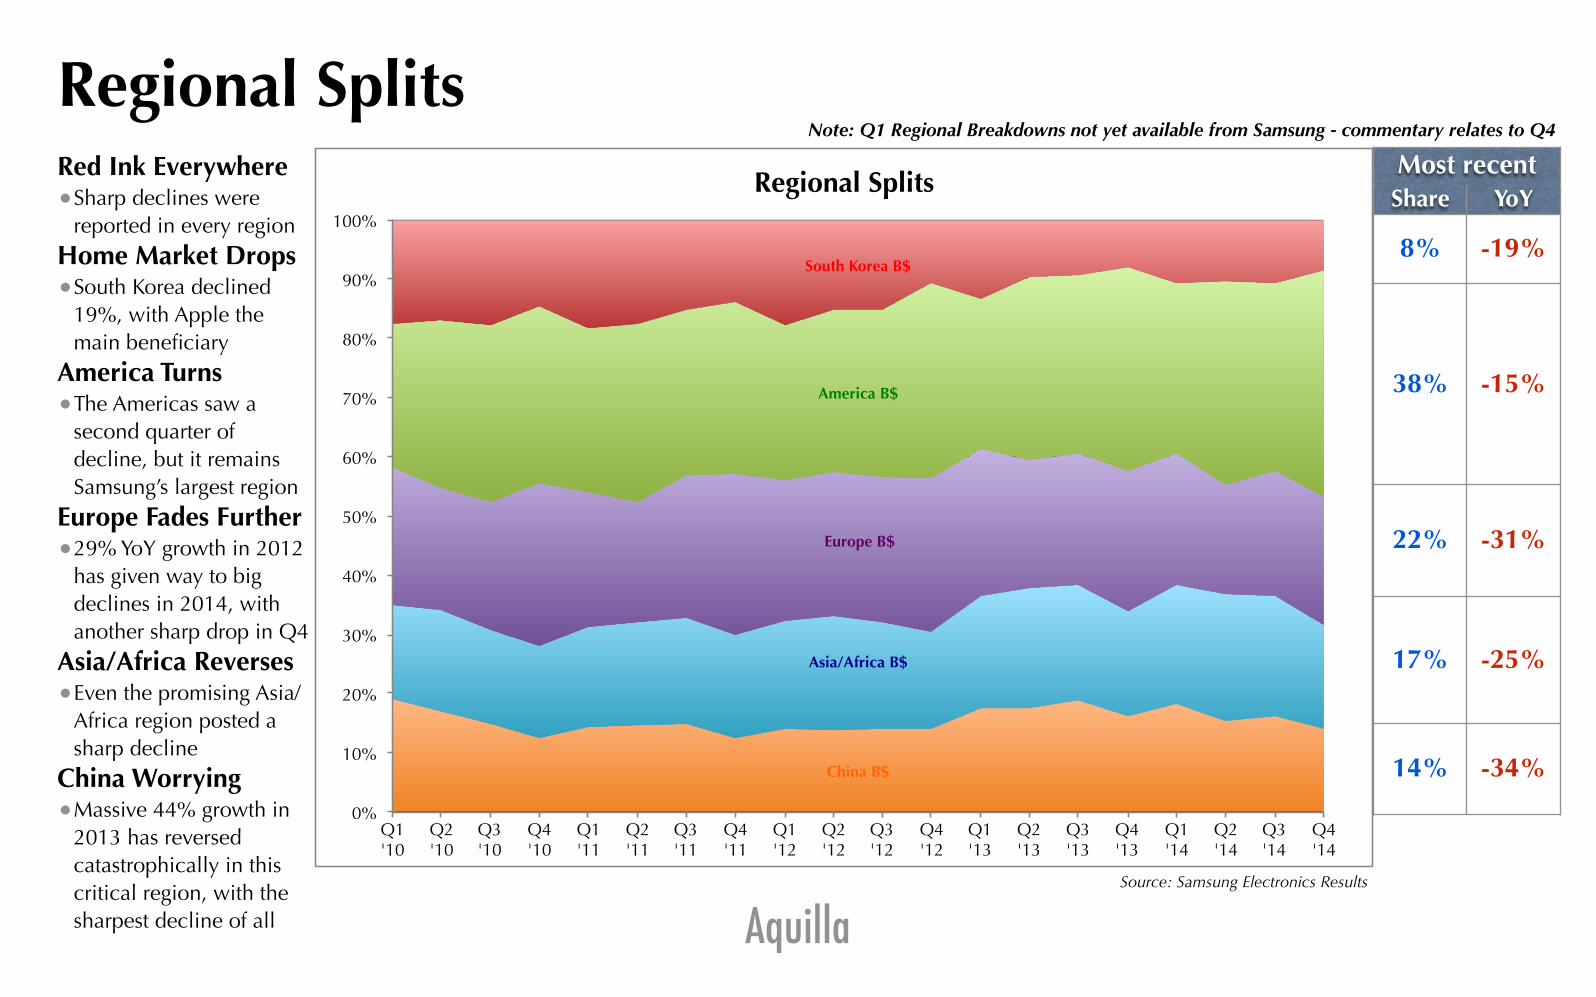
Regional SplitsRed Ink Everywhere •Sharp declines were
reported in every region Home Market Drops •South Korea declined
19%, with Apple the main beneficiary
America Turns •The Americas saw a
second quarter of decline, but it remains Samsung’s largest region
Europe Fades Further •29% YoY growth in 2012
has given way to big declines in 2014, with another sharp drop in Q4
Asia/Africa Reverses •Even the promising Asia/
Africa region posted a sharp decline
China Worrying •Massive 44% growth in
2013 has reversed catastrophically in this critical region, with the sharpest decline of all
Most recentShare YoY
8% -19%
38% -15%
22% -31%
17% -25%
14% -34%China B$
Asia/Africa B$
Europe B$
America B$
South Korea B$
0%
10%
20%
30%
40%
50%
60%
70%
80%
90%
100%
Q1 '10
Q2 '10
Q3 '10
Q4 '10
Q1 '11
Q2 '11
Q3 '11
Q4 '11
Q1 '12
Q2 '12
Q3 '12
Q4 '12
Q1 '13
Q2 '13
Q3 '13
Q4 '13
Q1 '14
Q2 '14
Q3 '14
Q4 '14
Regional Splits
Note: Q1 Regional Breakdowns not yet available from Samsung - commentary relates to Q4
AquillaSource: Samsung Electronics Results
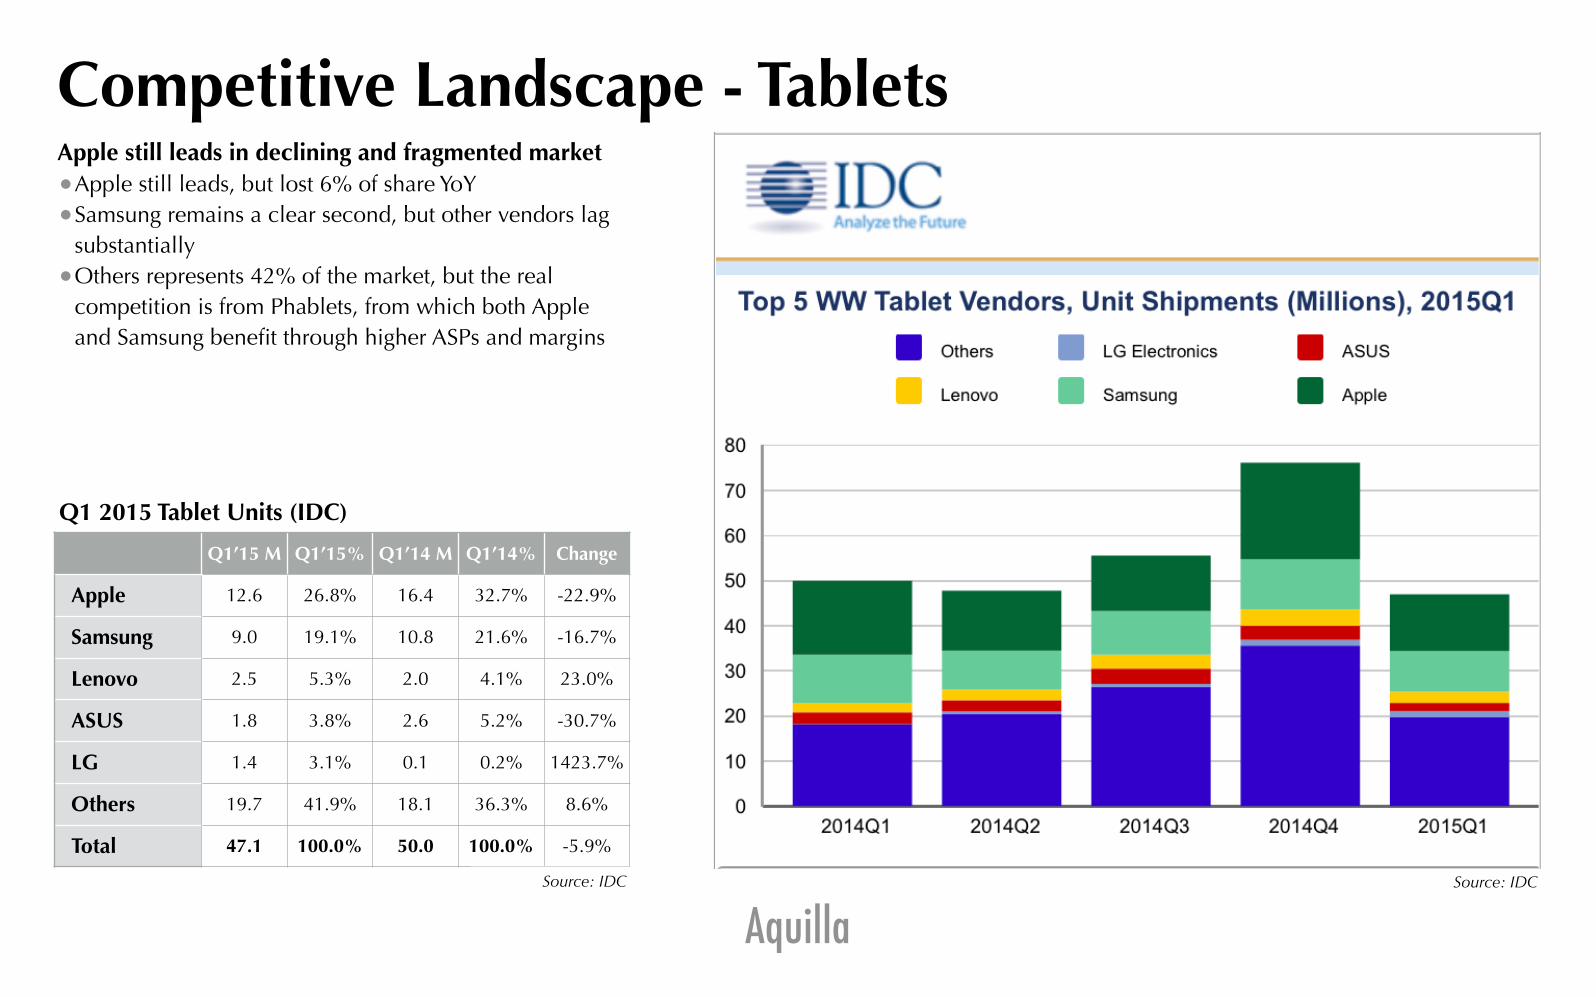
Competitive Landscape - TabletsApple still leads in declining and fragmented market •Apple still leads, but lost 6% of share YoY •Samsung remains a clear second, but other vendors lag
substantially •Others represents 42% of the market, but the real
competition is from Phablets, from which both Apple and Samsung benefit through higher ASPs and margins
Q1’15 M Q1’15% Q1’14 M Q1’14% Change
Apple 12.6 26.8% 16.4 32.7% -22.9%
Samsung 9.0 19.1% 10.8 21.6% -16.7%
Lenovo 2.5 5.3% 2.0 4.1% 23.0%
ASUS 1.8 3.8% 2.6 5.2% -30.7%
LG 1.4 3.1% 0.1 0.2% 1423.7%
Others 19.7 41.9% 18.1 36.3% 8.6%
Total 47.1 100.0% 50.0 100.0% -5.9%
Q1 2015 Tablet Units (IDC)
Source: IDCSource: IDC
Aquilla
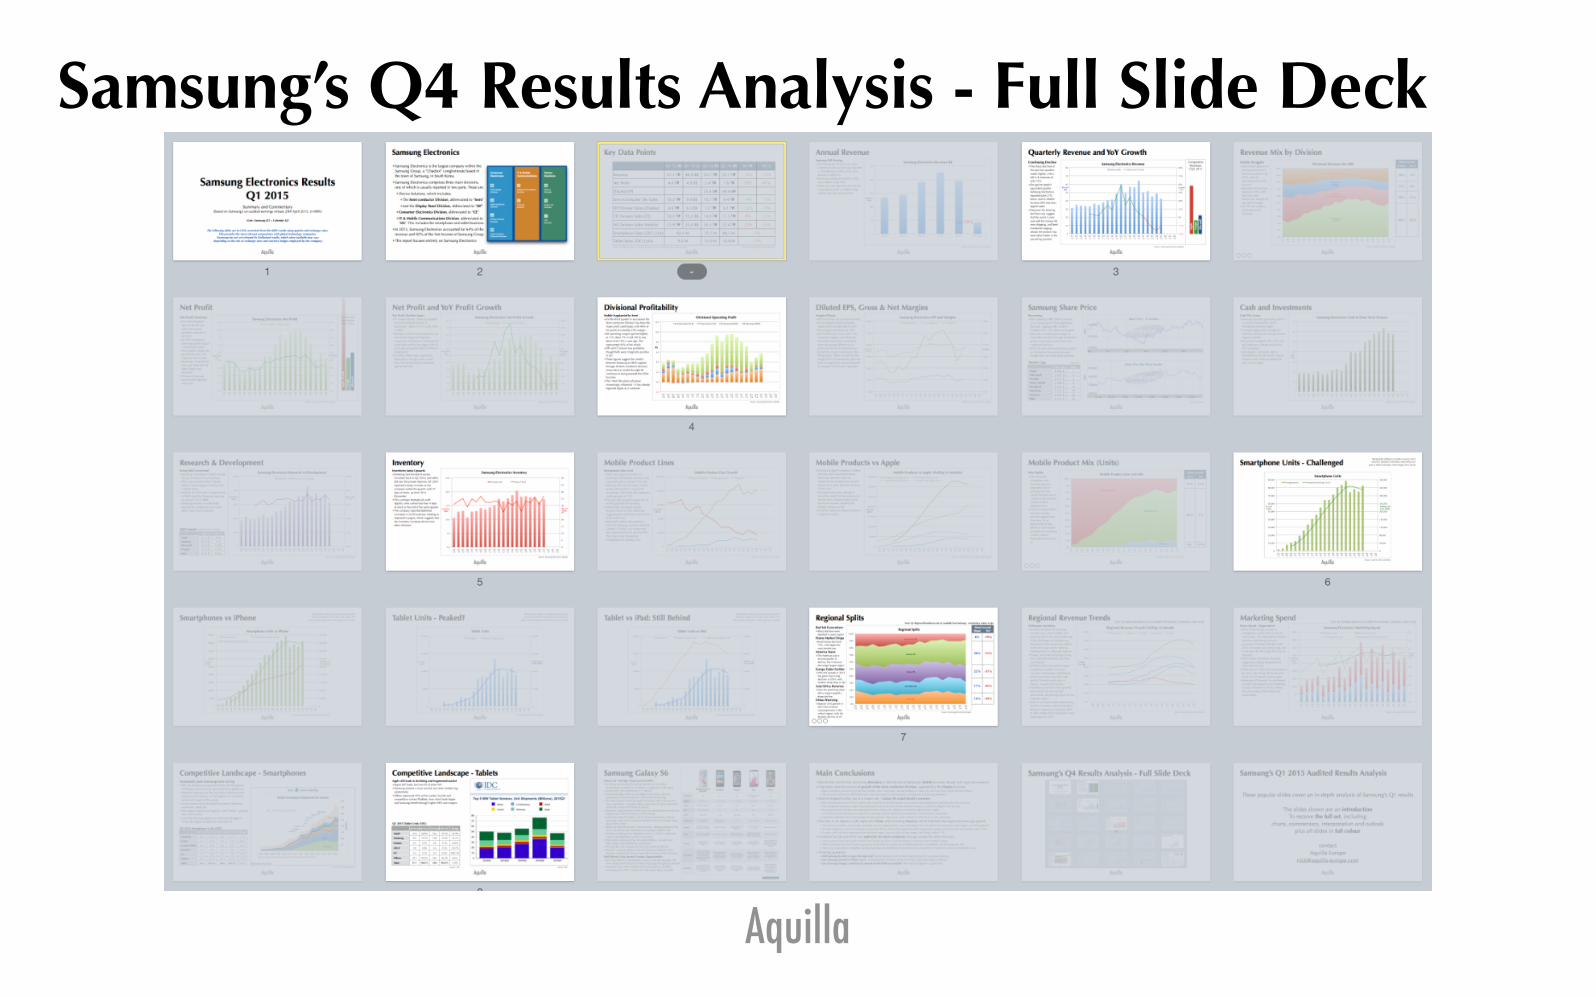
Samsung’s Q4 Results Analysis - Full Slide Deck
Aquilla
Samsung’s Q1 2015 Audited Results Analysis
These popular slides cover an in-depth analysis of Samsung’s Q1 results
The slides shown are an introduction To receive the full set, including
charts, commentary, interpretation and outlook plus all slides in full colour
contact Aquilla Europe
AquillaNick Graves, CEO • [email protected] • +44 780 225 6536
Aquilla Europe Ltd • Kennett Cottage • OX9 3QS • UK • www.aquilla-europe.com