Embed Size (px)
Citation preview

Samsung Device Performance Analysis!San Francisco, October 2013!
Agenda!
Background ß !
Data Analysis!
Next Steps!

Background!
This document provides a high level analysis of device performance metrics pulled from the Crittercism big data platform for August 2013:!• Top 100 Samsung Android devices (based on app loads) !• Installed base of ~250M (Android) devices!• Total of 10B+ app loads!

Key take-aways!Crashes & performance issues affect all devices regardless of app loads, however Samsung tablets (Galaxy Tab) and “phablets” (Galaxy Note) have the highest crash rates, 3-4x the crash rate of the best phones.!Some Samsung devices sold by non-US carriers are experiencing much higher crash rates than their US counterparts, such as the Galaxy S III in both Japan and Korea.!Other “bad offenders” are older models still in use like the Galaxy Y and Galaxy Ace that were shipped with Android versions as old as Froyo and Gingerbread (both originally released back in 2010).!More than 50% of Samsung devices have an average crash rate of greater than 0.25%; in addition, 10 of the top 100 devices account over 60% of total usage, suggesting a Pareto distribution of performance issues. !

Agenda!
Background!
Data Analysis ß !
Next Steps!
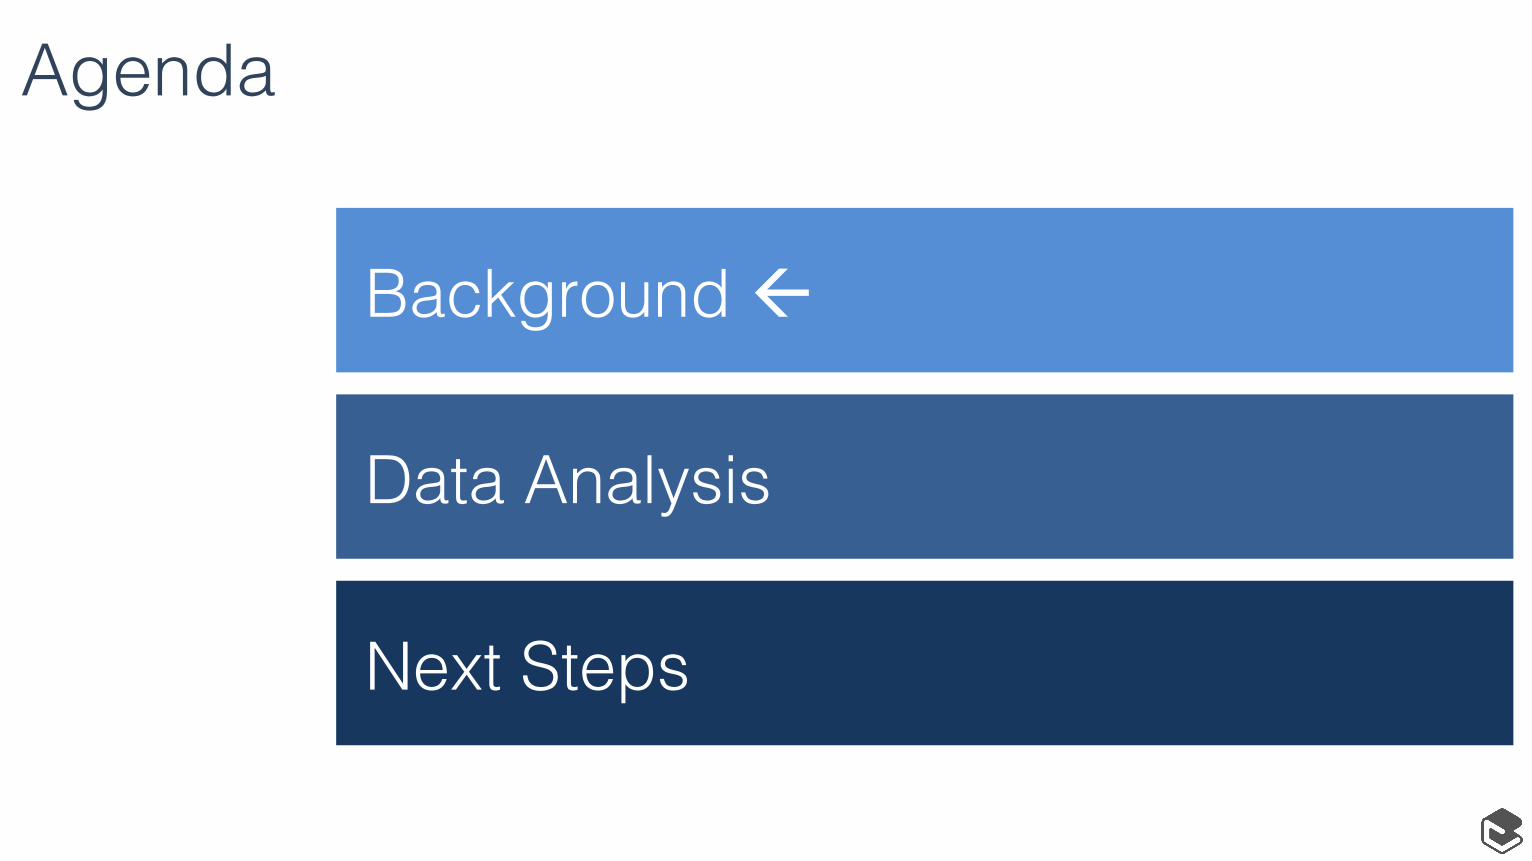
3 orders of magnitude range for crash rates!
0.00%
0.50%
1.00%
1.50%
2.00%
2.50%
3.00%
3.50%
4.00%
4.50%
5.00%
sc-0
6 gt
-n80
00
gt-p
7500
gt
-p62
00
gt-p
6800
gt
-p75
10
gt-s
5360
gt
-p10
00
gt-p
3100
gt
-s55
70
gt-s
6102
gt
-p31
10
gt-s
5660
sh
w-m
250
shv-
e250
gt
-p51
00
sc-0
4 gt
-s58
30
gt-p
3113
gt
-s58
39
sch-
r820
sh
v-e1
20
sc-0
2 sg
h-i9
97
sgh-
t889
sh
v-e2
10
sgh-
t959
sc
h-r5
30
sch-
s720
gt
-s53
02
gt-p
5110
gt
-n71
00
sc-0
3 sc
h-s7
38
gt-s
5300
sp
h-m
930
sgh-
t999
sh
v-e1
60
sch-
i500
sc
h-i6
05
gt-s
7562
sp
h-l9
00
sph-
d700
gt
-s68
02
gt-i9
305
gt-s
5301
gt
-p51
13
gt-i9
003
gt-n
7105
gt
-i900
0 sg
h-i7
47
shv-
e300
sg
h-i3
17
sph-
l710
gt
-i910
5 gt
-n70
00
gt-i9
082
sch-
i535
gt
-i816
0 sc
h-r7
60
gt-s
7560
gt
-s75
00
gt-s
6500
gt
-i950
0 gt
-i907
0 sg
h-i7
77
gt-b
5330
sh
w-m
440
gt-i8
150
gt-i9
100
sph-
d710
gt
-s68
10
sgh-
m91
9 gt
-i919
5 gt
-i900
1 sp
h-l3
00
sch-
r830
sg
h-t7
69
sgh-
t679
sp
h-m
830
gt-i8
190
sph-
l720
sc
h-i5
45
sgh-
i727
sg
h-i5
37
sch-
i510
sc
h-i2
00
sgh-
i547
gt
-i950
5 sc
h-r9
70
sch-
i405
sc
h-i4
15
sgh-
t989
sg
h-t6
99
sph-
m95
0 gt
-i873
0 sg
h-i3
37
gt-i9
300
sgh-
i717
sg
h-i4
37
Lowest! Highest! Mean! Median! Std. Dev.!0.05%! 4.74%! 0.38%! 0.28%! 0.58%!
Crash Rates for Top 100 Samsung Devices (by App Loads)!
3 orders of magnitude!
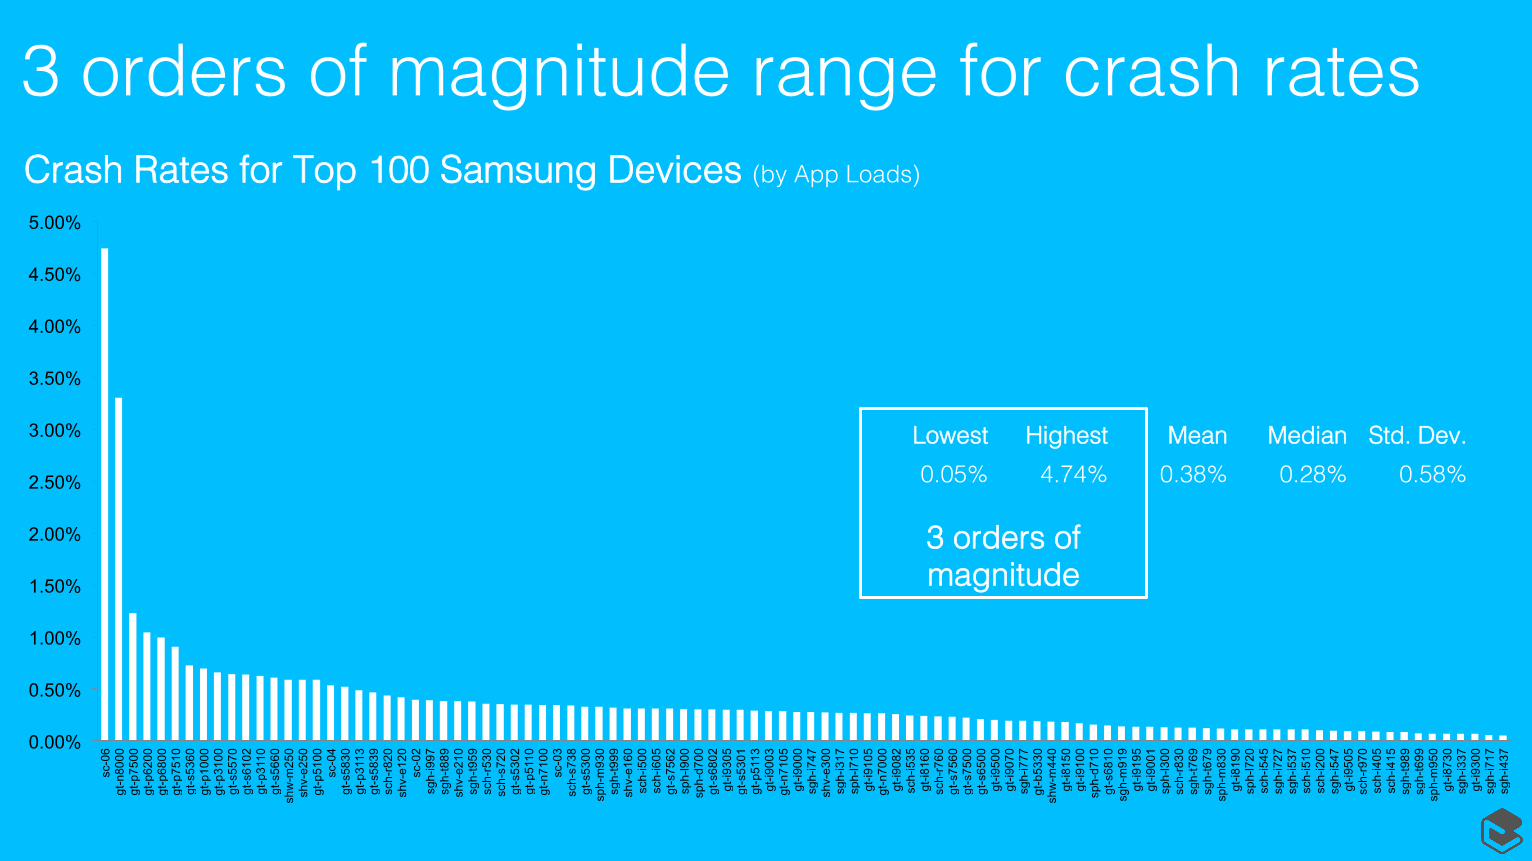
Performance issues affect all devices!
2,953 910
521 426
371 367
288 254 201 184 180 179 174 165 161 148 142 138 130 119 114 98 92 86 83 81 79 77 66 63
gt-i9300
gt-i9505
sgh-t989
gt-n7000
sph-l720
gt-i9500
sch-i545
sph-l710
sgh-t999
gt-i9070
gt-i9001
gt-i9082
sgh-i717
gt-p5100
sgh-i727
0.07% 0.17%
0.10% 0.11%
0.08% 0.14%
0.26% 0.07%
0.11% 0.16%
0.21% 0.35%
0.11% 0.25%
0.27% 0.52%
0.32% 0.28%
0.20% 0.66%
0.14% 0.28%
0.26% 0.35%
0.06% 0.24%
0.59% 0.73%
0.11% 0.23%
App Loads (Millions)! Crash Rate (%)!
R² = 0.01284
-1.00%
0.00%
1.00%
2.00%
3.00%
4.00%
5.00%
- 1,000 2,000 3,000 4,000
Device!
Performance for Top 30 Devices (by App Loads)! Performance Correlation for Top 100 Devices !Million App Loads (x) vs. Crash Rate (y)!
Crashes are independent from app loads, affect all devices!
Crash rates do not correlate with app loads (R2 =0.01) !

Distribution for app loads / crash rates!

Probability distribution (fitted)!Probability Distribution (30 day sample for top 100 devices, 10B+ app loads)!
0.00% 0.50% 1.00% 1.50% 2.00% 2.50% 3.00% 3.50% 4.00% 4.50% 5.00% 5.50%
Lowest Highest Mean Median Std. Dev.
0.05% 4.74% 0.38% 0.28% 0.58%
• More than 50% of Samsung devices have an average crash rate of greater than 0.25%!
• 10 of the top 100 devices account over 60% of total usage, suggesting a Pareto distribution !

Agenda!
Background!
Data Analysis!
Next Steps ß !


![Samsung On Android · According to Google’s own analysis and the report [Android Security 2014 Year in Review] ... Samsung on Android](https://img.dokumen.tips/doc/110x75/5b8bad0f09d3f222638bc3f9/samsung-on-android-according-to-googles-own-analysis-and-the-report-android.jpg)