Embed Size (px)
Citation preview
Rapid Growth Opportunities – Independent Power Producers in South Africa
Gareth Blanckenberg, Research Analyst
Energy & PowerEnergy & Power
September 7, 2011

Functional Expertise
• Experience in analysis and research, including several market and academic research projects.
Industry Expertise
� Experience in the energy and power sector
- Analysis of investment opportunities in Sub-Saharan Africa energy sector
- Energy efficiency research
What I bring to the Team
• General and varied experience
• Financial background
Career Highlights
• Professional Sailor
Today’s Presenter: Gareth Blanckenberg
Gareth BlanckenbergResearch AnalystEnergy and Power Systems
2
Education
• BBusSc in Management Studies from University of Cape Town, South Africa
Systems
Frost & SullivanAfricaCape Town

Key Market Drivers and Restraints
Private Power Generation: Key Market Restraints (South Africa), 2011
Historically Low Tariffs
Uncertainty
Skewed RiskAllocation
3
Private Power Generation: Key Market Drivers (South Africa), 2011
Tariff Increases
Growing Demand
Constraints on Eskom Liberalization of
ElectricityIndustry
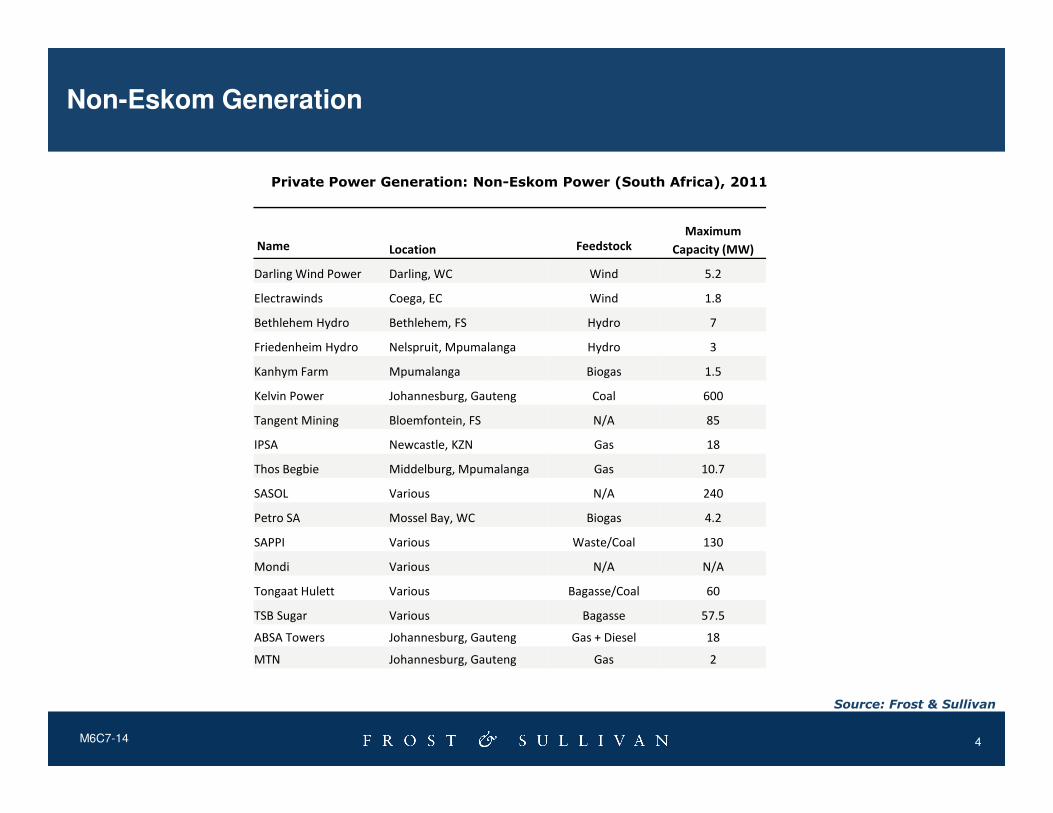
Non-Eskom Generation
Name Location FeedstockMaximum
Capacity (MW)
Darling Wind Power Darling, WC Wind 5.2
Electrawinds Coega, EC Wind 1.8
Bethlehem Hydro Bethlehem, FS Hydro 7
Friedenheim Hydro Nelspruit, Mpumalanga Hydro 3
Kanhym Farm Mpumalanga Biogas 1.5
Kelvin Power Johannesburg, Gauteng Coal 600
Private Power Generation: Non-Eskom Power (South Africa), 2011
4M6C7-14
Source: Frost & Sullivan
Tangent Mining Bloemfontein, FS N/A 85
IPSA Newcastle, KZN Gas 18
Thos Begbie Middelburg, Mpumalanga Gas 10.7
SASOL Various N/A 240
Petro SA Mossel Bay, WC Biogas 4.2
SAPPI Various Waste/Coal 130
Mondi Various N/A N/A
Tongaat Hulett Various Bagasse/Coal 60
TSB Sugar Various Bagasse 57.5
ABSA Towers Johannesburg, Gauteng Gas + Diesel 18
MTN Johannesburg, Gauteng Gas 2

IRP 2010: Capacity Requirements by Technology
New Build Options
Coal CCGT OCGTImport Hydro
Wind Solar PV CSP NuclearTotal New Build
Total System Capacity
2010 0 0 0 0 0 0 0 0 640 44535
2011 0 0 0 0 0 0 0 0 809 45344
2012 0 0 0 0 0 300 0 0 1103 46447
2013 0 0 0 0 0 300 0 0 2901 49348
2014 500 0 0 0 400 300 0 0 3021 52369
2015 500 0 0 0 400 300 0 0 2564 54933
2016 0 0 0 0 400 300 100 0 1432 56365
0 0 0 0 400 300 100 0 2968 59333
Private Power Generation: IRP2010 New Build Analysis (South Africa), 2011
5M6C7-14
2017 0 0 0 0 400 300 100 0 2968 59333
2018 0 0 0 0 400 300 100 0 1523 60856
2019 250 237 0 0 400 300 100 0 2496 63352
2020 250 237 0 0 400 300 100 0 2010 65362
2021 250 237 0 0 400 300 100 0 1212 66574
2022 250 0 805 1143 400 300 100 0 1365 67939
2023 250 0 805 1183 400 300 100 1600 2358 70297
2024 250 0 0 283 800 300 100 1600 2424 72721
2025 250 0 805 0 1600 1000 100 1600 3835 76556
2026 1000 0 0 0 400 500 0 1600 3500 80056
2027 250 0 0 0 1600 500 0 0 2350 82406
2028 1000 474 690 0 0 500 0 1600 1414 83820
2029 250 237 805 0 0 1000 0 1600 2764 86584
2030 1000 948 0 0 0 1000 0 0 2948 89532
6250 2370 3910 2609 8400 8400 1000 9600 45637
Note: All figures are rounded; Source: IRP2010

IPP Procurement Programme
• REFIT scrapped in favour of Competitive Bidding process
Technology Capacity Price Cap
Onshore Wind 1,850 MW R1.15 kWh
Solar PV 1,450 MW R2.85 kWh
CSP 200 MW R2.85 kWh
Biomass Solid 12,5 MW R1.07 kWh
6M6C7-14
• Projects need to be able to feasibly enter commercial operation by June 2014
• CSP by June 2015
Biomass Solid 12,5 MW R1.07 kWh
Biogas 12,5 MW R0.80 kWh
Landfill Gas 25 MW R0.60 kWh
Small Hydro 75 MW R1.03 kWh
Small Projects (<5MW) 100 MW
Other Procurement Programme’s
• Medium Term Power Purchase Programme (MTPPP)
• DoE Peakers Programme
• Municipal Generation
• Multi Site Base Load (MSLB) IPP Programme
Regional Import IPP Programme’s
7M6C7-14
• Regional Import IPP Programme’s

Electricity Tariff Path
Period 07/08 08/09 09/10 10/11 12/13 13/14 14/15 15/16
Private Power Generation: Average Tariff Changes (South Africa), 2011
8M6C7-14
Average Tariff R0.19 R0.25 R0.33 R0.41 R0.52 R0.66 R0.82 R1.03
Rate of Increase 34.2% 31% 24.8% 25.8% 25.9% 25% 25%
CAGR 27.3%
Source: Frost & Sullivan

Opportunity for IPP’s
50,000
60,000
70,000
80,000
90,000
Growth and Mix of Generation Capacity IRP2010
Other
• South Africa is blessed with natural resources for generation utilising all available feedstock.
• Until 2011, market development has been restrained.
• The first round of the IPP
9M6C7-14
-
10,000
20,000
30,000
40,000
50,000
Capacity in 2010 Capacity in 2030
Other
Pumped Storage
Nuclear
Renewables
Hydrocarbons
• The first round of the IPP Procurement Program for Renewables should open the floodgates and pave the way for other projects.
• A DOUBLING of current generation capacity is required, so the opportunity is large.
Source: Frost & Sullivan

Next Steps
� Request a proposal for Growth Partnership Services or Growth Consulting Services to support you and your team to accelerate the growth of your company. ([email protected])
� Join us at our annual Growth, Innovation, and Leadership 2012: A Frost & Sullivan Global Congress on Corporate Growthoccurring 15 – 16 May, 2012 (www.gil-global.com)
10
� Register for Frost & Sullivan’s Growth Opportunity Newsletter and keep abreast of innovative growth opportunities (www.frost.com/news)
Your Feedback is Important to Us
Growth Forecasts?
Competitive Structure?
What would you like to see from Frost & Sullivan?
11
Emerging Trends?
Strategic Recommendations?
Other?
Please inform us by rating this presentation
Frost & Sullivan’s Growth Consulting can assist with your growth strategies
Follow Frost & Sullivan on Facebook, LinkedIn, SlideShare, and Twitter
http://www.facebook.com/FrostandSullivan
http://www.linkedin.com/companies/4506
12
http://twitter.com/frost_sullivan
http://www.linkedin.com/companies/4506
http://www.slideshare.net/FrostandSullivan
For Additional Information
Samantha James
Corporate Communications
Industry
(021) 680-3566
Stephane Gay
Sales Manager
Energy & Power
(021) 680-3286
13
Cornelis van der Waal
Research Manager
Energy & Power
(021) 680-3266