Embed Size (px)
Citation preview

PROJECT IN 315MULTIMEDIA
SUBMMITTED TO:John B. Tadifa
SUBMMITTED BY:Ronalyn Aldabon BSIT3B
Harry John Janolino BSIT3BAntonio Saldevia BSIT3BEdralyn Alegrado BSIT3B
Ryan Belga BSIT3BMary Rose Beronia BSIT3B
BRIEF PROFILE
• Contact number: 333-2905• Email: [email protected]• Brief History• During the Spanish regime, the early settlers procured their basic household necessity, salt from the spring. During sunny days early in
the morning the natives would go to the spring to fill their bamboo troughs with salty water and expose it to sunlight until the water is evaporated. Then, they gather the precious sediment, salt to take home. One day, Spanish soldiers passed by the place where the natives were gathering salt. A soldier inquired with forefinger sign as to the name of the place but because of language barrier they were not able to understand each other. The natives thought that the soldier wanted to know the content of the troughs. They politely responded “may-asin”. From then on, the place was referred to as May-asin. Many years later May-asin was changed to Maasin.
• In 1775, Maasin acquired the status of town with the appointment of Don Agustin Gancia as its first captain. When the Americans came, the town was made arrabal of Cabatuan on April 4, 1903, as it was observed that it could not stand by itself financially. However, the town leaders worked untiringly for the separation of Maasin. Don Vicente Malaga represented the Municipal District to the Council in Cabatuan Maasin regained its old status as an independent Municipality when the late Gov. Gen. Francis Burton Harrison eventually appointed Don Vicente Malaga as its first municipal President on July 25, 1918.
• When the Japanese invaded Panay, Maasin became the sanctuary of evacuees from cities and neighbouring towns. Somewhere in the mountains, Governor Tomas Confesor established his headquarters while directing the Civil Resistance Government against the Japanese Imperial Forces in Panay and Romblon from 1942 to 1945. Documents or surrender of the Japanese to the American Forces were signed in the town Plaza in 1945.
• Since 1903, the highest population growth rate of Maasin was during the intercensal period of 1970-1975 at an annual rate of 3.3% followed 2.46% during the period from 1939-1948. The explanation in the increase of population during those years can be due to the in-migration of people from other places especially those who got married and brought their families home with them from the other places and locality. This could also indicate that during those years that the increase in the population is felt, the economic development in the municipality is also progressing. The lowest was during the period of 1903-1918 and 1960-1970 which give a decrease of 84 and 724 persons respectively with a negative growth rate. The average growth rate of the municipality from 2000-2007 is .77% annually with an increase of .28% when compared to the 1990-1995 growth rate as shown in Table 1. The slow increase in the population in the recent decades can be due to the proper campaign and implementation of the Family Planning in the municipality and the migration in a given period of time.
• Human Resource• Population - Population growth is the most important set of information for development planning perspective. The composition and
distribution of the population is the most essential basis in determining the needs of different public services in order to provide development programs which aims to provide quality living to the people.
• The municipality of Maasin has a total population of 35, 069 or 1.94% of the total 1, 805, 576 population of the Province of the Iloilo excluding that of the Iloilo City with 0.013 growth rate according to the 2010 census of the National Statistics Office (NSO). The Municipality of Maasin is classified as 3rd class municipality in terms of its income classification.
• Out of the 35, 069 total population of Maasin in 2010, 89.87% reside in the rural area while 10.13% are In the urban area. Barangay Dagami has the highest population count of 1, 724 while Barangay Miapa has the lowest population count of 217.

Human Resource• Age Group and Sex – Based on the 2007 population census, the early ages of 0-44
years old, male population is a bit dominant that female population while in the late ages of 45 and up, female population outnumbered the male population. Large part of the school going age population is from the group aging 13 -16 with 3,276 number of population, followed by the group aging 17- 21 and group aging 7-10 with 3, 135 and 3, 011 respectively. Of the total population, 18, 901 belongs to the working age group (15-64) in which number of female is smaller than the number of male. In general, there are more males than females with the sex ratio of 103.76 which means that there are 103 male for every 100 female.
• Household per Barangay – In the year 2007 population census, there are 6, 066 total housing units in the municipality of Maasin. Barangay Ubian marks the highest average household size of 6.3 followed by barangay Tuy-an West with 6.1 average household size. Barangays THT&P, Abilay, Panalian and Trangka have an average household size of 6 while Barangay Burak and Pispis have the lowest average household size of 4.4.
• Labor Force – The labor force population categorized according to sex and employment status for the year 2007 shows that the distribution of the labor force population with regards to sex is almost equal. Of the 21, 307 population aging 15 years and over, the labor force or the working age group has a total population of 18, 901. The employed male counted was 10, 981 while the employed female counted was 6, 788. Of the total labor force population, 94.01% were employed while only 5.99% were unemployed.
Inventory of Tourism Establishments, Year 2011
• Maasin Hymn• Maasin Banwa kong pinili• Gin tao sang mahal nga Dios tanan nga kanami• Ang imo bukid, matinlo nga tubig• Mga kawayan, kahoy kalan-on sang kabuhi• Chorus:• Maasin, amon ka gin pili• Maga puyo kami tubtob kamatayon• Maragtason nga banwa ipa bugal• Sa pungsod kag sa kalibutan• Maasin banwa kong pinili• Ihalad namon ang kapisan kag kabuhi• Sa pag hugpong binuligay kag pag patawhay• Tinguhaon namon nga ikaw pauswagon.• Repeat Chorus

Name of Tourism EstablishmentLocation (Barangay)Area (Hectares)1Type of
AttractionFacilities2Ownership1
• . Paet SpringBrgy. Magsaysay1 hasNatural Private2. Gines Hill Del-Car3 hasMan-madebenchesPrivate3. DamsiteBrgy. Daja2 hasMan-madebenchesMIWD4. Maasin Watershed and Viewing DeckBrgy. Bolo2 hasNaturalN/ADENR5. Puting Bato and Water FallsBrgy. Layog NaturalN/A 6. Villa Teresita Resthauz, Bamboo Resort & Adventure ParkBrgy. Tubang.84 hasMan-madeRest house, swimming pool, cottages, pavilions, Adventure parks, lagoon/fish pond, zip line, wildlife cage & rescue facilitiesPrivate7. Villa Benedicta Inland ResortDelgado St.1.3 hasMan-made Swimming pool, kiddie pool, pavilion, cottages, videoke, shower rooms, toiletsPrivate8. Riverside Inland ResortBrgy. Naslo0.6 hasMan-madeSwimming pool, kiddie pool, pavilion, cottages, videoke, shower rooms, toiletsPrivateSource: Primary Survey
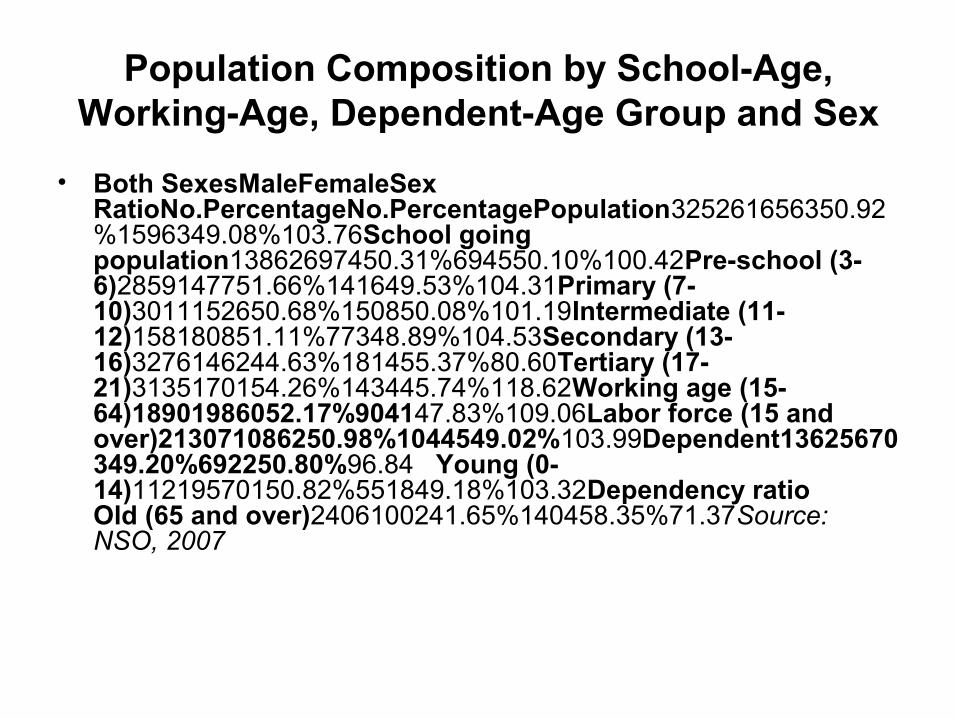
Population Composition by School-Age, Working-Age, Dependent-Age Group and Sex
• Both SexesMaleFemaleSex RatioNo.PercentageNo.PercentagePopulation325261656350.92%1596349.08%103.76School going population13862697450.31%694550.10%100.42Pre-school (3-6)2859147751.66%141649.53%104.31Primary (7-10)3011152650.68%150850.08%101.19Intermediate (11-12)158180851.11%77348.89%104.53Secondary (13-16)3276146244.63%181455.37%80.60Tertiary (17-21)3135170154.26%143445.74%118.62Working age (15-64)18901986052.17%904147.83%109.06Labor force (15 and over)213071086250.98%1044549.02%103.99Dependent13625670349.20%692250.80%96.84 Young (0-14)11219570150.82%551849.18%103.32Dependency ratio Old (65 and over)2406100241.65%140458.35%71.37Source: NSO, 2007

Household Population by Urban and Rural Barangay and Average Household Size
• BarangayPopulationNumber of HouseholdAverage Household SizeA. Urban1. Del-Car6901255.52. AgRoCel6701175.73. THT & P10721915.64. Mab-Riz10121696.0Sub-Total34446025.7 B. Rural1. Abay471875.42. Abilay8191376.03. Amerang344635.54. Bagacay East459845.55. Bagacay West8381645.16. Bug-ot261426.27. Bolo7971435.68. Bulay353615.89. Buntalan7091315.410. Burak4851114.411. Cabangcalan8101465.512. Cabatac6911424.913. Caigon5861224.814. Cananghan430865.015. Canawili257465.616. Dagami16362865.717. Daja10571975.418. Dalusan465925.119. Inabasan8321655.020. Layog13062205.921. Liñagan Calsada329595.622. Liñagan Tacas361685.323. Linab434835.224. Magsaysay7931535.225. Mandog9351715.526. Miapa195414.827. Nagba11252294.928. Nasaka7691445.329. Naslo13372445.530. Nasuli445835.431. Panalian6121026.032. Piandaan East215464.733. Piandaan West348685.134. Pispis5291194.435. Punong212425.036. Sinubsuban407954.337. Siwalo8531605.338. Sta. Rita264535.039. Subog473875.440. Tigbauan9211805.141. Trangka7791296.042. Tubang8911725.243. Tulahong325714.644. Tuy-an East6061274.845. Tuy-an West6071006.146. Ubian7111136.3Sub-Total704913295.3TOTAL3252660665.4

• VISION• We envision Maasin as bamboo healthy municipality
with God-loving and entrepreneurial individual, living happily in a safe and ecologically-balanced community with progressive economy, strongly united in a development-oriented, transparent, participatory and accountable local governance.
• MISSION• To realize this vision, it is the mission of this
administration to create the appropriate environment conducive to the transformation of the Municipality of Maasin into a socially, economically, politically and spiritually vibrant where every member actively participates in its development.
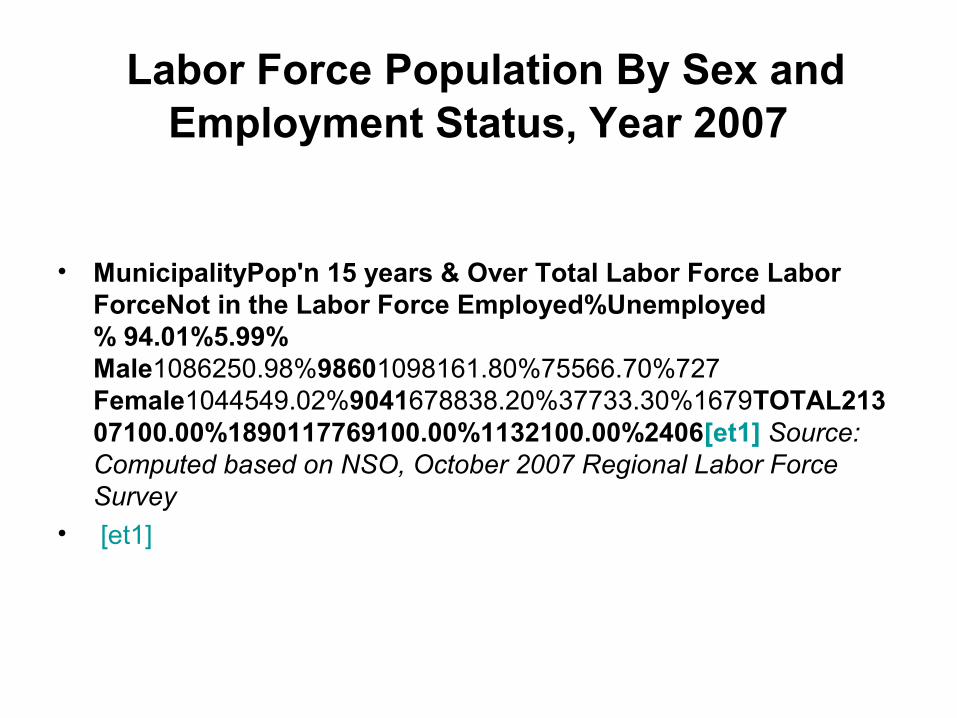
Labor Force Population By Sex and Employment Status, Year 2007
• MunicipalityPop'n 15 years & Over Total Labor Force Labor ForceNot in the Labor Force Employed%Unemployed% 94.01%5.99% Male1086250.98%98601098161.80%75566.70%727 Female1044549.02%9041678838.20%37733.30%1679TOTAL21307100.00%1890117769100.00%1132100.00%2406[et1] Source: Computed based on NSO, October 2007 Regional Labor Force Survey
• [et1]
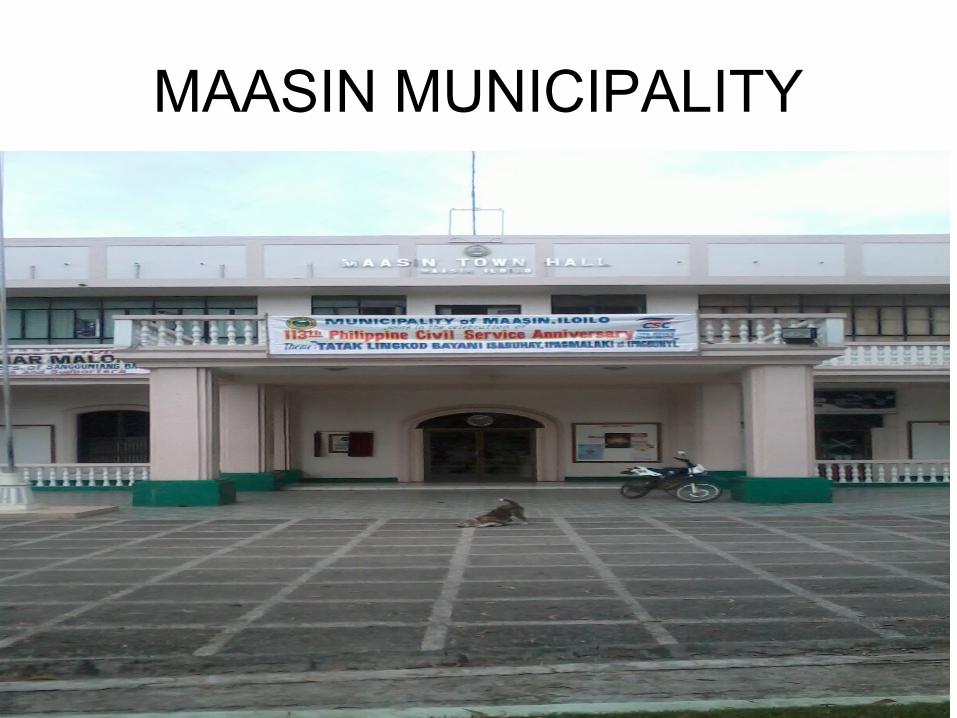
MAASIN MUNICIPALITY

PLAZA
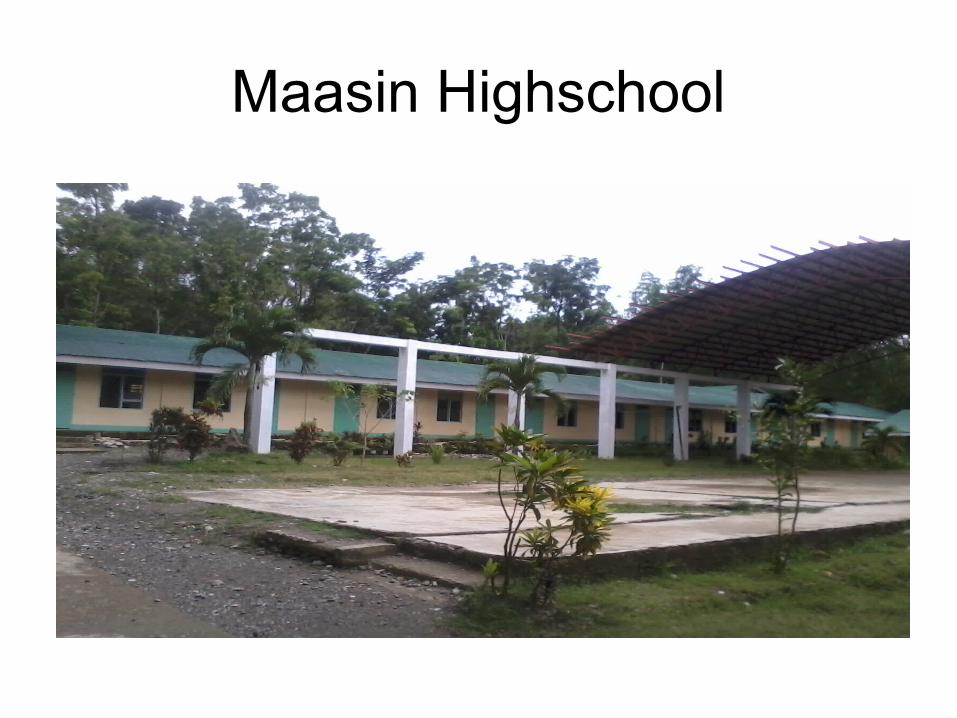
Maasin Highschool

MAASIN CHURCH

PRIVATE SCHOOL

MAASIN ATTRACTIONS

MAASIN DAM

MAASIN LOGO
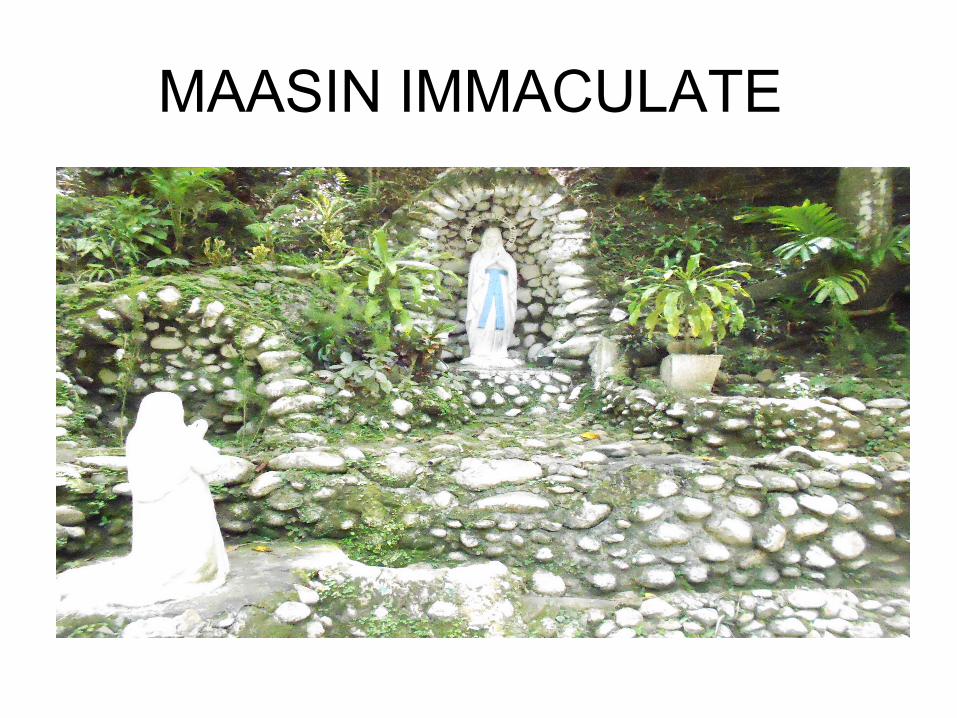
MAASIN IMMACULATE

1HUNDRED FOOT STEPS

THE END