Embed Size (px)
Citation preview
Active Safety-Collision Warning Pilot in Washington State
Rob Huyck, Risk Manager Pierce Transit

Active Safety-Collision Warning Pilot in Washington State – Co Authors
Rob Huyck, Risk Manager Pierce Transit Jerry Spears
Washington Transit Insurance Pool Yinhai Wang
University of Washington Ruimin Ke
University of Washington Benjamin Englander Rosco Vision Systems
Jerome Lutin New Jersey Transit

Pierce Transit
Operating statistics for 2015:
• Unlinked Passenger Trips: Fixed Route 9,104,337, Paratransit 368,411, Vanpool 849,159.
• Revenue Hours: Fixed Route 388,736, Paratransit 166,951, Vanpool 143,234
• Vehicles: 204 Fixed-Route, 100 Paratransit, 380 Vanpool; fixed-route buses operated and maintained for Sound Transit: 124

Innovations Deserving Exploratory Analysis
(IDEA) Project Transit -82
Funding from
• Transportation Research Board
• Washington State Transit Insurance Pool
• Munich Re America
• Alliant Insurance Services, Inc.
• Government Entities Mutual, Inc.
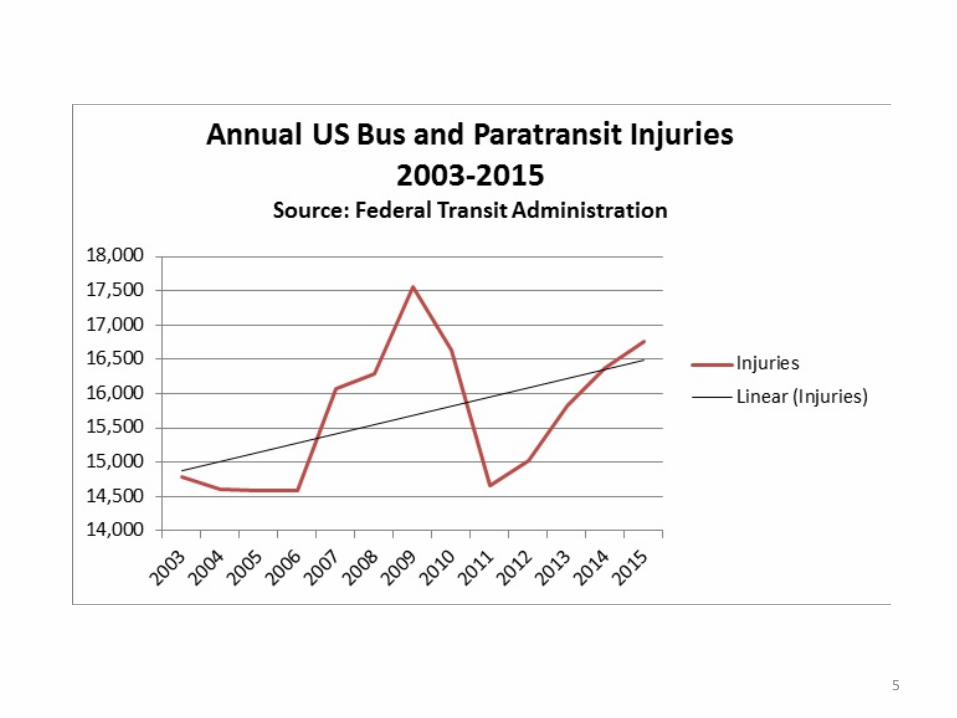
Collision Avoidance – Magnitude of the Problem for Transit
5
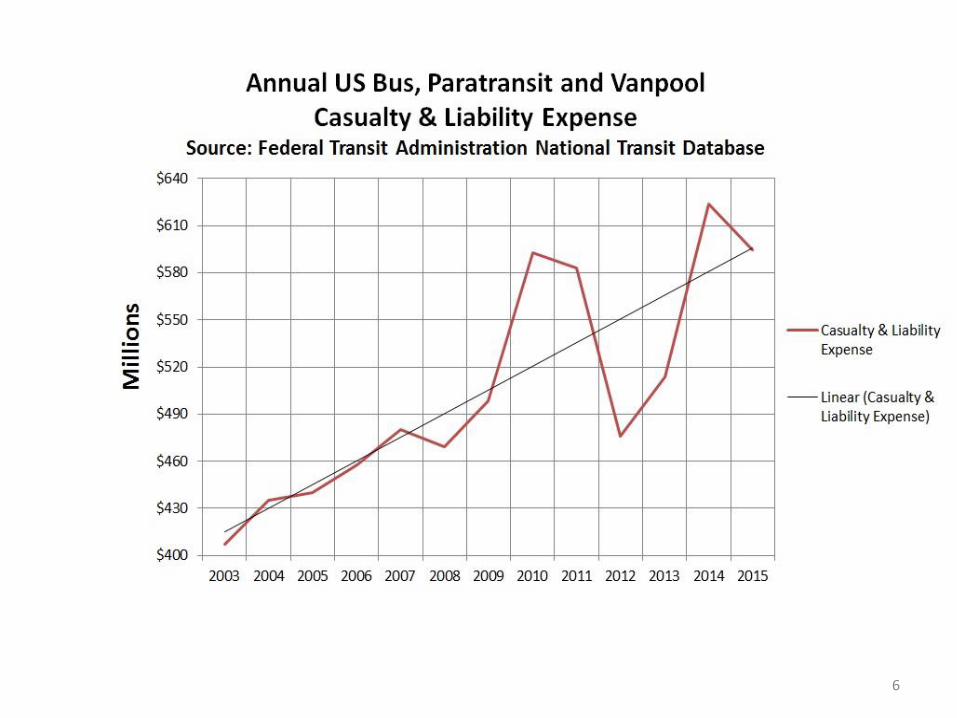
Collision Avoidance – Magnitude of the Problem for Transit
6

Collision Avoidance – Magnitude of the Problem for Transit Collisions, Fatalities, Injuries, Casualty and
Liability Expenses for Bus and Rail Modes
Mode
Reporting Period 2002-2015
Collisions
Fatalities
Injuries
Total Casualty and Liability Expenses by
Mode
Total Bus, Demand
Responsive and Van Pool
90,056 1,442 218,139 $6.96 Billion
Total Rail
6,526 1,453 97,243 $4.38 Billion
7

8
Pierce Transit Claims
• 10 year history • 91 incidents • 109 injuries • $11.1 million in claims
National Transportation Safety Board (NTSB)
2015 - Special Investigation Report – The Use of
Forward Collision Avoidance Systems
to Prevent and Mitigate Rear End Crashes
“currently available forward collision avoidance
technologies for passenger and commercial vehicles … could reduce rear-end crash fatalities.”
Forward collisions reduced 71% for trucks with collision avoidance systems, (CAS) autonomous emergency braking, (AEB) and electronic stability control (ESC)
9
10
NTSB recommendations:
Manufacturers - install forward collision avoidance systems on all newly manufactured passenger and commercial motor vehicles
NHTSA - expand New Car Assessment Program to include graded performance rating of forward collision avoidance systems
NHTSA - expand or develop protocols for assessment of forward collision avoidance systems

• Transit buses are a niche market – little incentive
for OEM’s to invest in R&D
• Agencies required to retain buses for 12 + years
• Years before transit benefits from CAS and AEB on
new buses
• Need to retrofit existing buses with CAS and AEB
• Need standards for CAS and AEB for retrofits and
new buses
Transit May Be Left Behind

Washington State Transit Insurance Pool Safety Pilot Innovations Deserving Exploratory Analysis (IDEA)
TRB grant and funding from insurance companies
• Equipped 35 transit buses at seven member agencies and three buses at King County Metro with CAS
• Comprehensive examination of total costs for most severe and costly types of collisions
• Evaluate potential for CAS to reduce the frequency and severity of collisions, and reduce casualty and liability expenses
• Does not include autonomous braking in this phase
Washington State Transit Insurance Pool Safety Pilot Participating Transit Agencies
• Ben Franklin Transit, Richland, WA
• Community Transit, Everett, WA
• C-Tran, Vancouver, WA
• InterCity Transit, Olympia, WA
• King County Metro, Seattle, WA
• Kitsap Transit, Bremerton, WA
• Pierce Transit, Tacoma, WA
• Spokane Transit, Spokane, WA
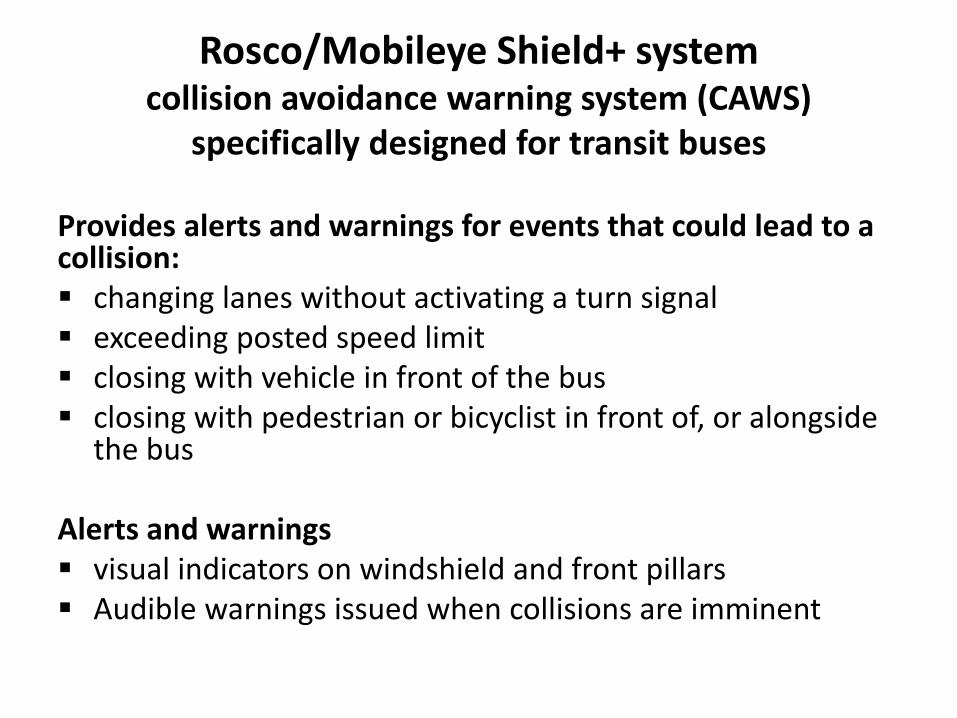
Rosco/Mobileye Shield+ system collision avoidance warning system (CAWS)
specifically designed for transit buses Provides alerts and warnings for events that could lead to a collision: changing lanes without activating a turn signal exceeding posted speed limit closing with vehicle in front of the bus closing with pedestrian or bicyclist in front of, or alongside
the bus Alerts and warnings visual indicators on windshield and front pillars Audible warnings issued when collisions are imminent
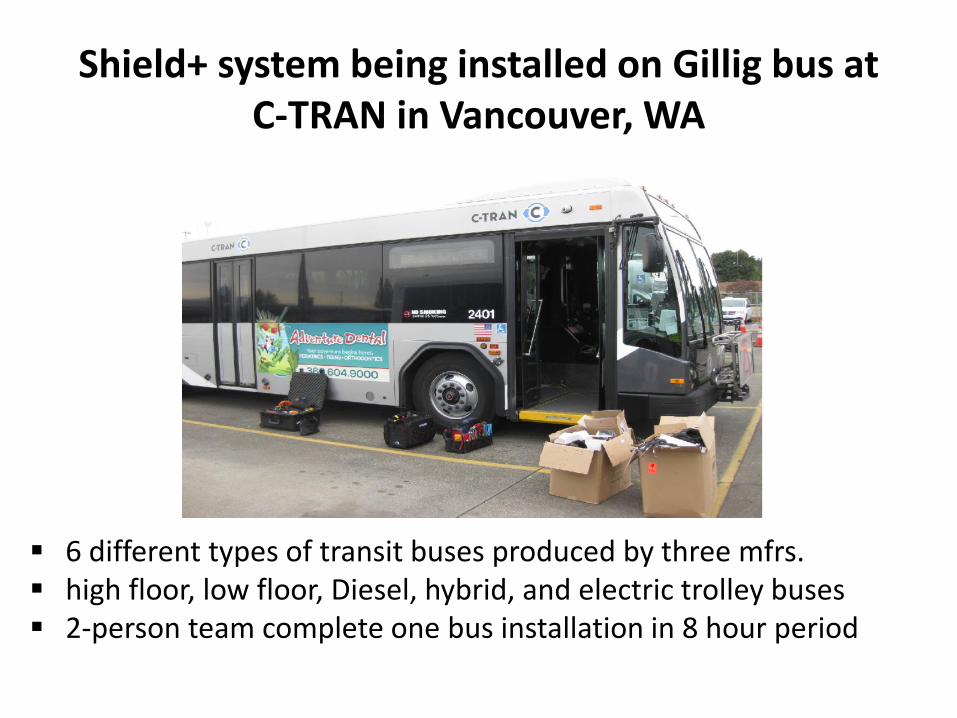
Shield+ system being installed on Gillig bus at
C-TRAN in Vancouver, WA
6 different types of transit buses produced by three mfrs. high floor, low floor, Diesel, hybrid, and electric trolley buses 2-person team complete one bus installation in 8 hour period
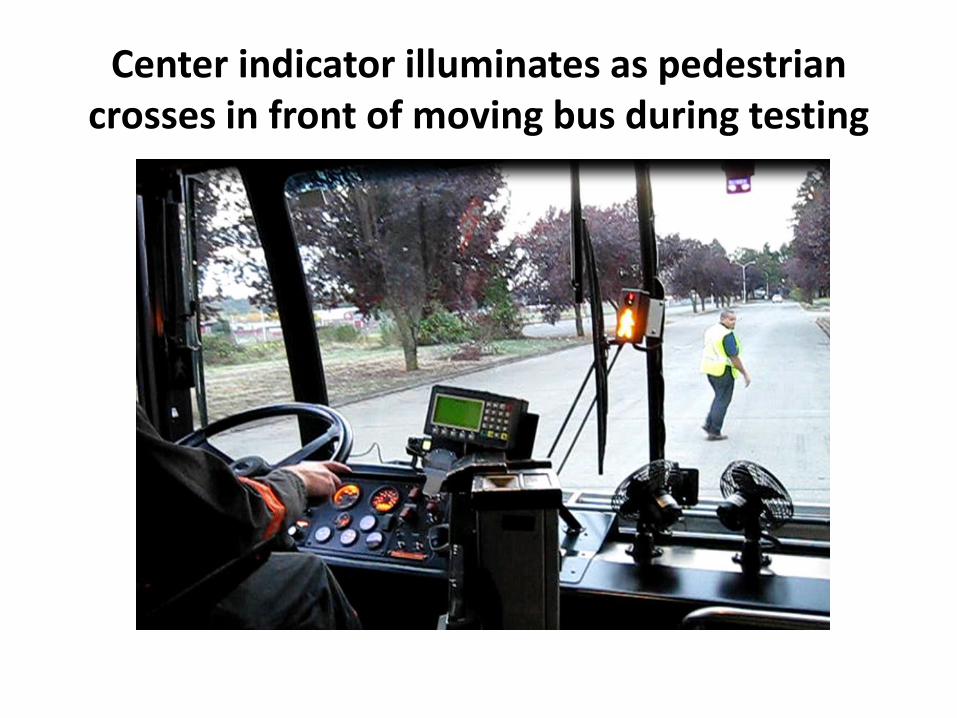
Center indicator illuminates as pedestrian crosses in front of moving bus during testing

Washington State Transit Insurance Pool Safety Pilot
System Configuration
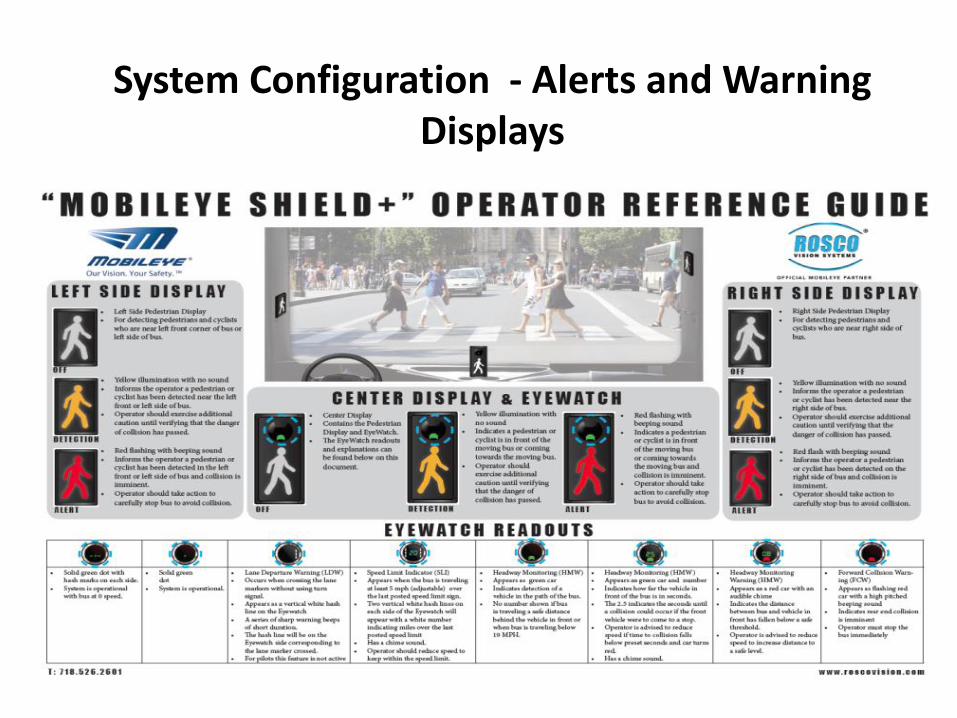
Washington State Transit Insurance Pool Safety Pilot System Configuration - Alerts and Warning
Displays
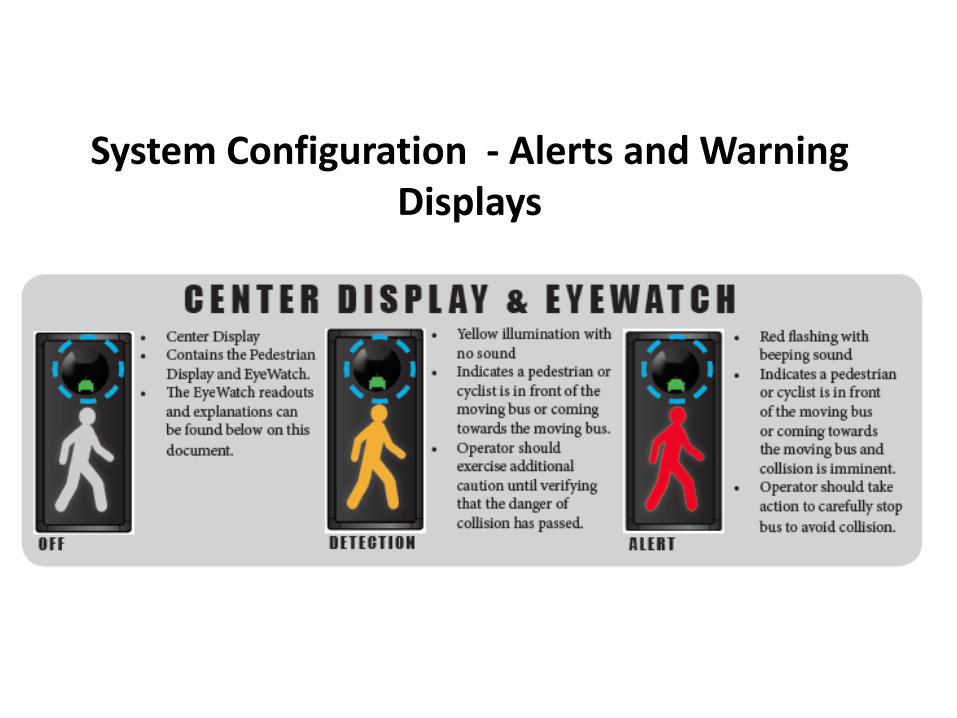
Washington State Transit Insurance Pool Safety Pilot
System Configuration - Alerts and Warning Displays

Washington State Transit Insurance Pool Safety Pilot Telematics - Monitoring System Performance
• The CAS does not record video
• Additional cameras record video of events
• Additional technology is used to generate data that can be used to evaluate the systems’ effectiveness
• Telematics unit captures and transmits data
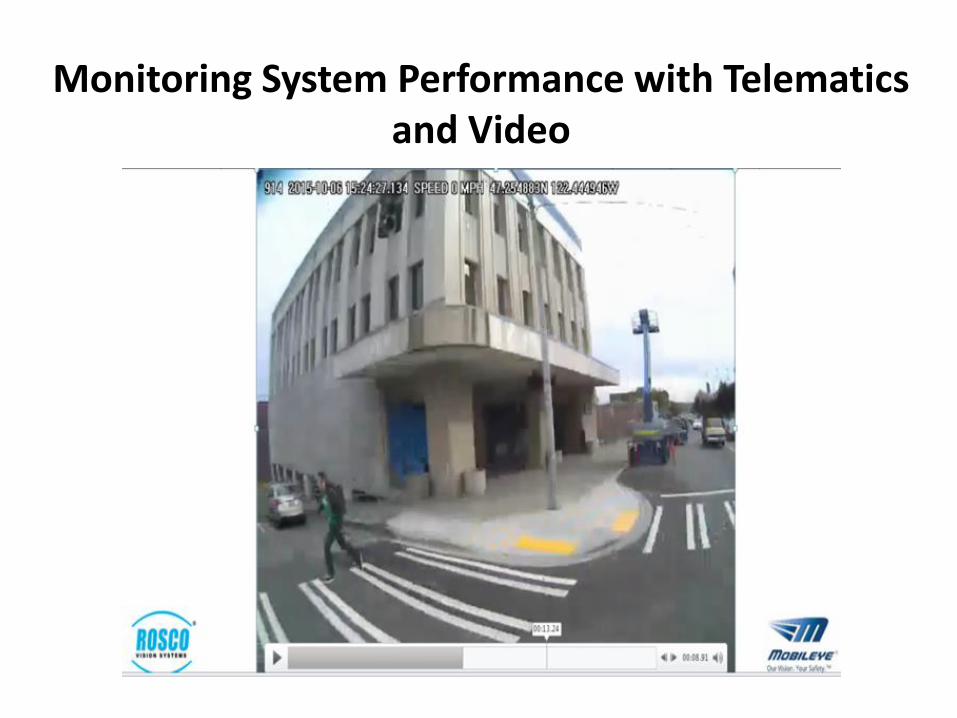
Washington State Transit Insurance Pool Safety Pilot Monitoring System Performance with Telematics
and Video
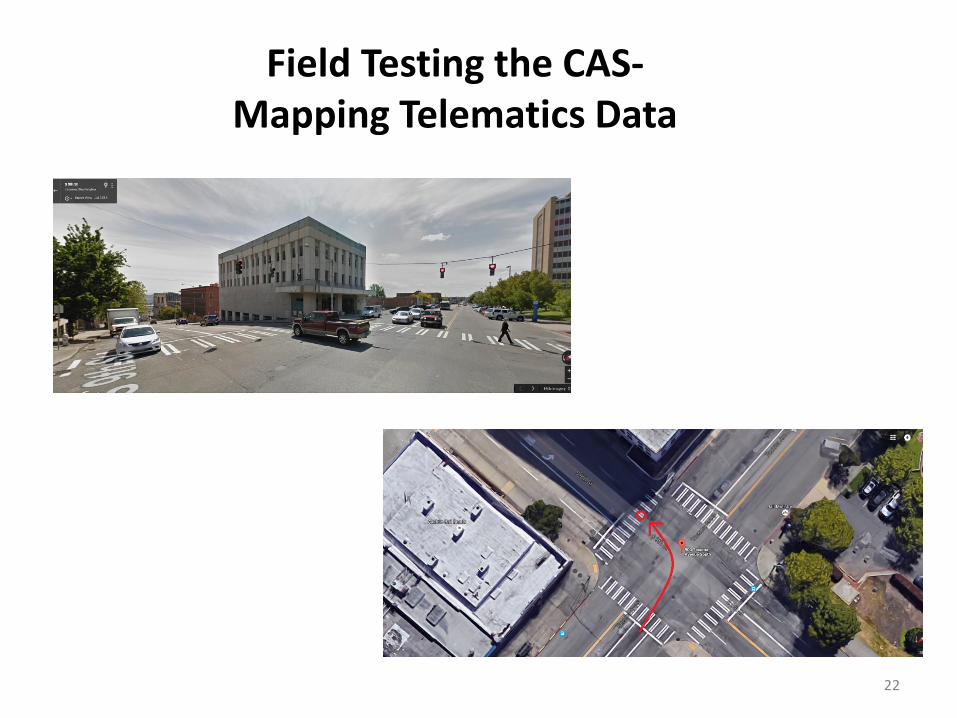
Washington State Transit Insurance Pool Safety Pilot Field Testing the CAS- Mapping Telematics Data
22
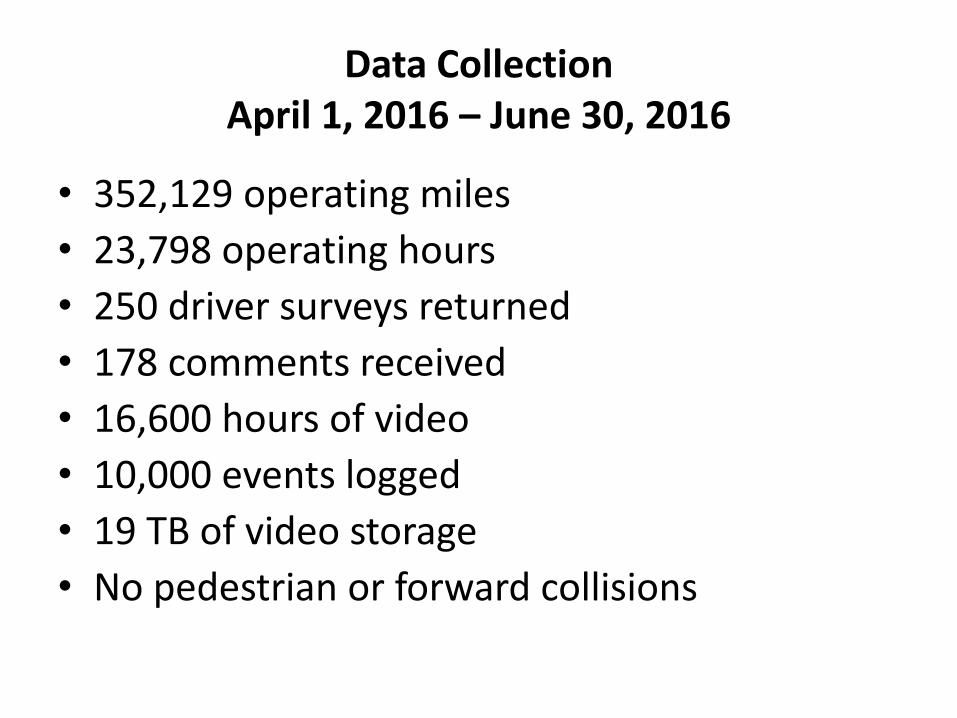
Data Collection April 1, 2016 – June 30, 2016
• 352,129 operating miles
• 23,798 operating hours
• 250 driver surveys returned
• 178 comments received
• 16,600 hours of video
• 10,000 events logged
• 19 TB of video storage
• No pedestrian or forward collisions

Comparing Frequency of Alerts and Warnings with Spokane Transit Control Group
Warning Type Warnings per 1000 miles
Control Group (2 buses 17K mi)
Active Fleet (33 buses, 344K
mi)
Active Fleet Reduction
Speed Limit 16.74 15.39 -8%
Headway (HW) 185.84 50.31 -73%
Forward Collision <19 mph (UFCW)
317.74 96.04 -70%
Forward Collision >19 mph (FCW)
10.99 6.27 -43%
Pedestrian Collision (PCW) 27.67 18.00 -35%
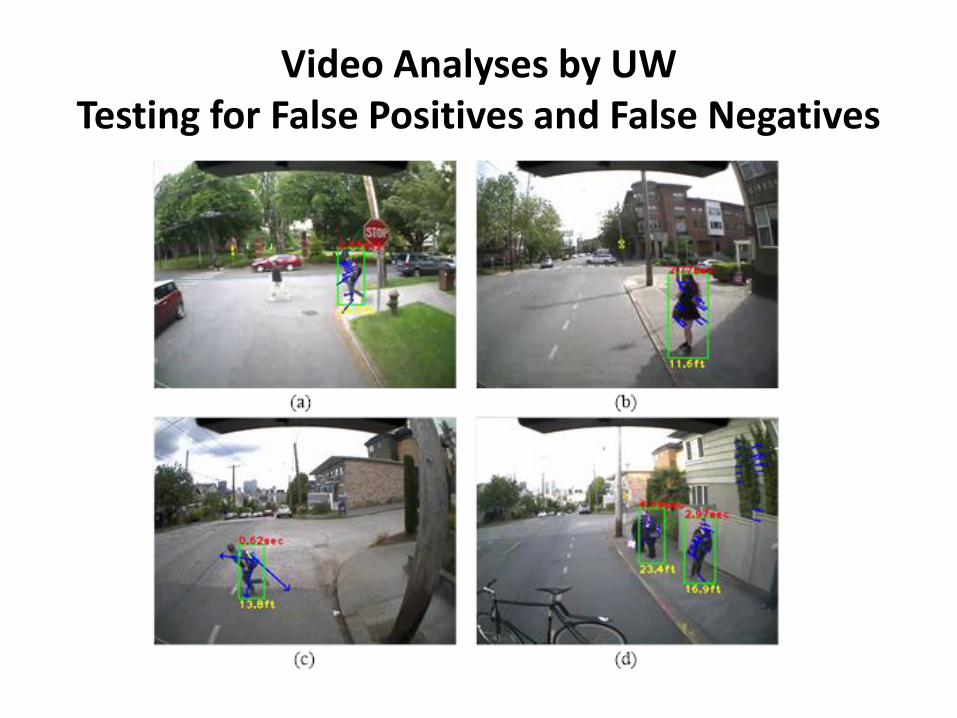
Video Analyses by UW Testing for False Positives and False Negatives

Collision Avoidance – Magnitude of the Problem for Transit Insurance Pool Data - Major Portion of Injuries,
Fatalities, and Claims are Collision Related
Examination of 282 closed claims for Washington State Transit Insurance Pool spanning 2006-2015 • 100% of fatalities (6 total) were collision-related
(vehicle, pedestrian, and bicyclist) • 88% of injuries (335 total) resulted from collisions or
sudden stops • 94% of claims ($24.9 million total) resulted from
collisions or sudden stops
MANY OF THESE COULD HAVE BEEN PREVENTED WITH CAS AND AEB
26

Framework for Estimating Cost Savings
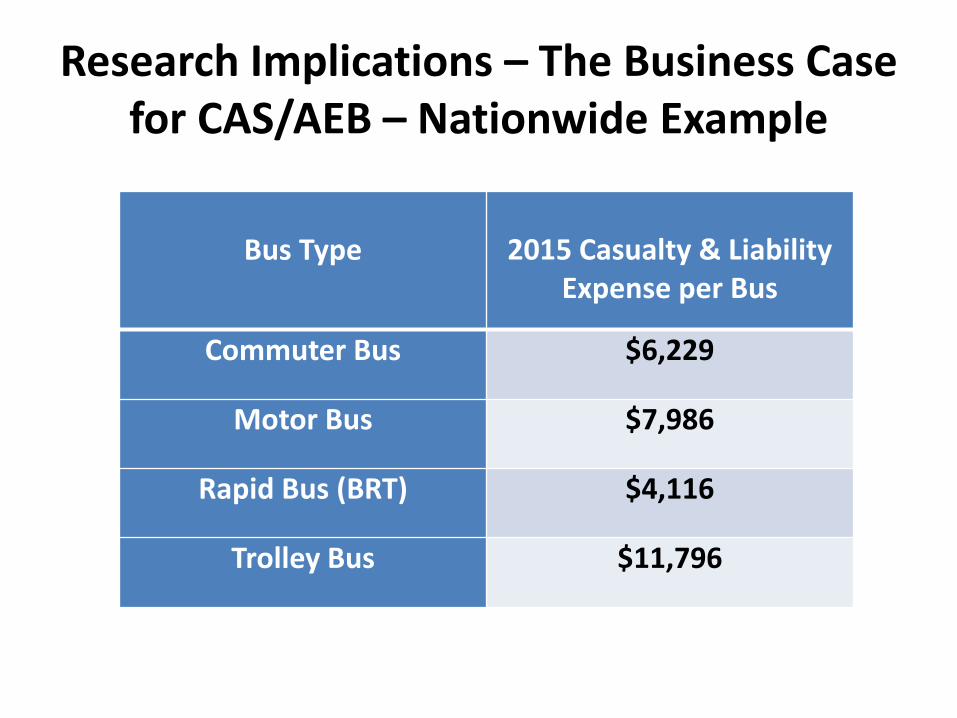
Research Implications – The Business Case for CAS/AEB – Nationwide Example
Bus Type
2015 Casualty & Liability
Expense per Bus
Commuter Bus $6,229
Motor Bus $7,986
Rapid Bus (BRT) $4,116
Trolley Bus $11,796
Autonomous Emergency Braking (AEB) – Need for Standards and Testing
Pierce Transit’s Continuing Research in Collision Avoidance
• Pierce Transit receives $1.66 million grant from Federal Transit Administration (FTA) to install bus safety technology
• 176 buses will be equipped with Shield+ CAWS
• Buses will be operated and data recorded for a full year
• Some buses will also be equipped with Automated Emergency Braking (AEB) for integrated testing


![W3]IDOKRVV]DEENLHV«VH - Yellow Cube · 2017-09-13 · 73]ido 8'3 e\wh * esv 2 g esv * esv *esv *esv *esv *esv *esv *esv ,36 8'3 E\WH 0ESV * ESV 2 ,4 G ESV 3 *ESV 7 *ESV *ESV *ESV](https://img.dokumen.tips/doc/110x75/5f802c15a09b4f733d34aa37/w3idokrvvdeenlhvvh-yellow-cube-2017-09-13-73ido-83-ewh-esv-2-g-esv.jpg)