Embed Size (px)
Citation preview


PHYSICAL TESTING OF RUBBER

PHYSICAL TESTING OF RUBBER
Roger Brown
Springer

Library of Congress Cataloging-in-Publication Data
A CLP. Catalogue record for this book is available from the Library of Congress.
Physical Testing of Rubber, 4* ' Ed., by Roger Brown
ISBN 10 0-387-28286-6 e-ISBN 0-387-29012-5 Printed on acid-free paper. ISBN 13 9780387282862
© 2006 Springer Science-i-Business Media, Inc. All rights reserved. This work may not be translated or copied in whole or in part without the written permission of the publisher (Springer Science-hBusiness Media, Inc., 233 Spring Street, New York, NY 10013, USA), except for brief excerpts in connection with reviews or scholarly analysis. Use in connection with any form of information storage and retrieval, electronic adaptation, computer software, or by similar or dissimilar methodology now known or hereafter developed is forbidden. The use in this publication of trade names, trademarks, service marks and similar terms, even if they are not identified as such, is not to be taken as an expression of opinion as to whether or not they are subject to proprietary rights.
Printed in the United States of America.
9 8 7 6 5 4 3 2 1 SPIN 11054986
springeronline.com

Contents
Preface vii
INTRODUCTION 1
GENERAL CONSIDERATIONS 7
STANDARDS AND STANDARDS ORGANISATIONS 27
PREPARATION OF TEST PIECES 41
CONDITIONING AND TEST ATMOSPHERES 51
TESTS ON UNVULCANIZED RUBBERS 63
MASS, DENSITY AND DIMENSIONS 95
SHORT TERM STRESS - STRAIN PROPERTIES 109
DYNAMIC STRESS AND STRAIN PROPERTIES 173
CREEP, RELAXATION AND SET 201
FRICTION AND WEAR 219
FATIGUE 245

vi Physical testing of rubber
ELECTRICAL TESTS 259
THERMAL PROPERTIES 275
EFFECT OF TEMPERATURE 287
ENVIRONMENTAL RESISTANCE 317
PERMEABILITY 349
ADHESION, CORROSION AND STAINE^G 363
Index 383

Preface
Knowledge of the physical properties of materials is essential for design, specification and quality control, and the particular nature of rubbers demands that specific test procedures, rather than methods for materials in general, are used to measure almost all of the properties. The importance of the subject of rubber testing to industry and to research is witnessed by the large number of national and international standards which have been produced.
A text devoted to the physical testing of rubbers based on experience at Rapra first appeared in 1965 with the publication of the work of the late Dr J R Scott, who was widely regarded as the "father of rubber testing". The first edition of my own book came in 1979 and the second, third and now this fourth edition reflect the continuing technical developments over four decades. There have been many changes in the methods used but, more especially, there have been vast improvements to much of the instrumentation as more modern technologies are adopted by instrument manufacturers and the requirements of industry become more sophisticated. Since the last edition of the book, the majority of International (ISO) and ASTM test methods standards have been revised.
The book collates the many standard methods, comments on their virtues and defects and considers procedures needed for both quality control and the generation of design data. The content owes much to the experience gained due to Rapra's position over many decades as an international centre for rubber research, as a test house with a history of developing test procedures and making a very significant contribution to national and international standardisation. The literature relating to the development and application of rubber test methods has also been reviewed.

viii Physical testing of rubber
The book is primarily intended as a reference for those directly concerned with testing rubbers, whether it be for quality control, evaluation of products, production of design data or research, and for students of rubber technology. However, it is believed that it will also be of considerable value to those indirectly involved in testing such as design engineers and technical specifiers.
Roger Brown

Chapter 1
INTRODUCTION
The aim of this book is to present an up to date account of procedures for testing rubber materials. It intends to be comprehensive in covering the complete range of physical properties and all of the tests in common, and sometimes not so common, use. Inevitably the bulk of methods are the standard ones, often somewhat arbitrary and primarily intended for quality assurance purposes, but in each case the requirements for testing to predict performance and for obtaining meaningful design data are considered.
Knowledge of the physical properties of materials is of critical importance for the design, production, quality control and performance of all products. Consequently, it is not surprising that a vast spectrum of test methods have been devised to measure these properties. Whilst many features of physical testing are common to all materials, the particular characteristics and uses of each group of materials, metals, ceramics, polymers etc, have provided good reason why each group has developed its own procedures. That is not to say that there are also bad reasons, such as insularity, and that there is not room for greater cooperation and, hence, unification of methods.
Rubbers can claim a particularly strong case for needing their own test methods, being complex materials exhibiting a unique combination of properties, whilst a virtually infinite number of rubber compounds, each with their own detailed characteristics, is possible. They differ very considerably from other engineering materials; being extremely highly deformable but exhibit almost complete recovery, and are virtually incompressible with a bulk modulus some thousand times greater than shear or Young's modulus. For the design engineer particularly, it is important that such properties are measured and understood. The fact that so many variations in compounds, and hence properties, are possible simply means that standard grades hardly exist and one must evaluate every rubber compound which is met with. The

2 Physical testing of rubber
basic structure of rubbers and their sensitivity to small compounding or processing changes means that they are prone to unintended variations in properties from batch to batch and present the processor with a difficult quality control problem.
Hence, it is not surprising that with such unusual and complicated materials the procedures used for measuring their physical properties often differ markedly from procedures used for other materials. Methods and philosophies taken from other materials often cannot be simply transferred if meaningful results are to be obtained, so that there is a particular technology of rubber testing. Over the years an enormous effort has been put into developing satisfactory procedures both for quality control and for providing design data, but particularly from the design aspect many procedures remain painfully inadequate. The difficulty of formulating meaningful test procedures for rubbers is due to a number of reasons, some of which are general to testing materials, but some because of the rubber's intrinsic properties. Some aspects of this are discussed in Chapter 2.
Standard tests have the unfortunate habit of not being standard, in that different countries and different organisations each have their own "standards". Fortunately, this tendency has very much diminished in recent times as more countries have the international (ISO) methods. It is perhaps appropriate here to make a plea for the adoption of recognised standards without modification when there is really no strong technical reason for change. It goes without saying that this makes for efficiency because, if we all use the same, well documented method, silly disputes due to the effects of apparently minor differences will be lessened.
The principal standard methods discussed in this book are those of the International Standards Organisation (ISO). Less emphasis is placed on the various national bodies than was the case in earlier works, reflecting the increased importance of ISO, or rather the increased tendency for national methods to be aligned with ISO. However, the equivalent ASTM International and the British Standards Institute (BSI) methods are also considered. Most British standards are now dual numbered so that the national standard is in fact verbatum the same as ISO. In Europe the intention is to align all the national standards by producing European (CEN) standards. This has been done for plastics by adopting the ISO methods but at the time of writing this process has not been carried through for rubbers as it is found easier to reference the ISO methods directly. Unfortunately for the cause of universal standardization, ISO methods are not widely adopted in the United States of America and ASTM methods are mostly not directly technically equivalent to the ISO ones. Generally, test methods peculiar to particular commercial companies have not been considered at all.

Introduction 3
It is inevitable that between writing and publication there will have been new editions of standards produced. To counteract this as far as possible the likely trends in test methods have been estimated from the current drafts in circulation and the known activities of relevant committees.
The dividing line between what to include and what to omit is inevitably a little blurred. Firstly, there is bound to be some overlap between rubbers and other polymers, particularly with plastics. In this context it is useful to refer to complementary books. Handbook of Plastics Test Methods^ is now out of print but the part on short term mechanical tests has been updated^ (with a slightly misleading title). The Handbook of Polymer Testing^ covers rubbers, plastics, cellular materials, composites, textiles and coated fabrics. There is in particular the question of thermoplastic elastomers and this has been given a section in Chapter2.
Cellular rubbers have been deliberately omitted as they are a very distinct class of materials that should be treated separately, both rubbers and plastics being considered together. Similarly, tests on latex have also been omitted although products made directly from latex, by for example by dipping, will have many properties tested in the same way as for those formed from solid rubber. Ebonite has not been included as it was accepted some years ago by ISO TC 45 and TC 61 that it should be treated as a thermosetting plastic. Some tests on simple composites have been included, e.g. rubber/metal and rubber fabric, although the majority of tests on coated fabrics have not been considered as, once again, this particular product type can be considered as a special subject in its own right.
Comment is made, as appropriate, about testing finished products but a separate chapter on this has not been written, simply because such procedures are too specialised for general treatment. It is apparent, however, that increasingly specifications include tests on the complete product as in many cases this is the best or the only way of being sure that the product will perform satisfactorily. A short discussion of when to test products is given in chapter 2.
I have lost no sleep in debating what is physical - if popular opinion treats tests as part of the physical spectrum (e.g. ageing tests) then they are physical. Not surprisingly, chemical analysis is excluded but it can be noted that the thermal analysis techniques straddle both camps and they have been included or excluded depending on their purpose. The intention has been to include every type of physical test and, hopefully, this has been, in the main, achieved. However, three areas immediately come to mind which do not have their own section, acoustic properties, optical properties and nondestructive testing.
There are no test methods specific to rubber for acoustic properties and procedures for materials in general would be applied. A section on optical

4 Physical testing of rubber
properties would also be rather thin, rubbers usually being opaque and their reflective properties and colour are very rarely of consequence. Optical properties have been covered for polymers generally^. Particular uses of microscopy, for example for dispersion, have been mentioned in the appropriate chapter and it is recognised that the microscopist often has a very important role to play in one of the very important reasons for testing -failure analysis. However, microscopy as a subject in its own right is beyond the scope of this work.
It is perhaps less easy to excuse the lack of a chapter on non-destructive testing. The reason is a mixture of the fact that the major NDT techniques are, in the main only applied to a few particular rubber products and the realisation that to properly describe all methods would require a book, not a chapter. It is, however, worth remembering that it is not only ultrasonics, radiography, holography and so on which are non-destructive. A number of the more traditional rubber tests, for example electrical properties, many dynamic tests, hardness and dimensional measures leave you with the product intact. There are text books which deal with NDT techniques generally and. a comprehensive review of NDT of polymers by Gross in Handbook of Polymer Testing^.
The layout of subject matter in a book on testing is inevitably to some extent subjective. The form adopted has remained essentially the same from the first edition and it is hoped that it is found to be logical and clear. The order is shown below going clockwise with chapter numbers in brackets.
Miscellaneous (17-18) /
Effect of / Environment 1 (15-16) \
Physical \ Properties (13-14)
Matters (1-3)
Mechanical Properties (8-12)
Preparation \ (4-5)
1 Processability 1 (6)
/ Dimensions (7)
Figure 1-1. Chapter order

Introduction 5
A number of subjects common to all areas of physical testing have been addressed in chapter 2. These include discussion of the reasons for testing, the trends in test development, the use of statistics and quality control of laboratories. Whilst these matters are not unique to rubber testing, it is most important that they are fully appreciated in the context of our particular test procedures and class of materials.
The greatest change in test laboratories in recent times, and rubber is no exception, is the improvements made to apparatus by the introduction of more advanced instrumentation and automation, in particular the application of computers both to control tests and to handle the data produced. These developments can and do influence the test techniques which are used and this is discussed in Chapter 2 Section 6. Also, whenever appropriate, comment is made on the form of apparatus now available for any particular test and there is a guide to test equipment for rubbers and plastics in a test equipment suppliers directory" .
REFERENCES
1. Brown R P (Ed.). Handbook of Plastics Test Methods, Longmans Scientific, 1988. 2. Brown R P (Ed) Handbook of Polymer Testing: Short Term Mechanical Tests, Rapra
Technology, Shawbury, 2002 3. Brown R P (Ed). Handbook of Polymer Testing, Marcel Dekker, New York, 1999. 4. Polymer Test Equipment and Services Directory, Rapra Technology, Shawbury, 2002.

Chapter 2
GENERAL CONSIDERATIONS
1. PHILOSOPHY
When a product fails unexpectedly, experience has shown that in almost every case the problem can be traced back to lack of, or inadequate, testing, which in turn resulted from an attempt to save money. It has to be admitted that testing can be very expensive in both time and money; so why is it essential? Put simply, men and women make mistakes, machines go wrong and we don't know enough.
If people are going to make mistakes we have to check their production. Similarly, if machines can vary in their performance we have to check their output. Generally, we don't have enough knowledge to make a product and be sure that it will work. The customer is unlikely to believe us if we said we did and expects us to test to prove fitness for purpose. Demands for greater quality assurance and consumer protection, together with improved performance, are likely to result in more testing rather than less.
We certainly don't know enough to design a new product without making use of material property data, and as new materials are continually developed there is an ongoing need to test their properties. As design methods become more sophisticated and expectations of performance increase we need better data even for established materials. In this context, because rubbers are such complex materials the demands on testing are perhaps particularly onerous.
When things go wrong we often do not know why. If we did we probably would have stopped it happening. Hence, we may also test to fathom out the reasons for failure.

8 Physical testing of rubber
From this reasoning as to why testing is necessary, the purposes of testing can be summarised:-• Quality control • Predicting service performance • Design data • Investigating failures
Before considering which properties to measure and which methods to use it is essential to clearly identify the purpose of testing because the requirements for each of the purposes are different. This may be an obvious point, but failure to appreciate what purpose the results must satisfy easily leads to unfortunate choice of method and conditions. Also, lack of consideration of why another person is testing and what they need to get from their tests frequently leads to poor appreciation of the merits and limitations of a particular test and inhibits communication between, for example, the university researcher and the factory floor quality controller.
There are a number of general requirements for a test method; it must have adequate precision, reproducibility etc. There are, however, particular attributes related to the purpose of testing:-
For quality control: the test should preferably be as simple, rapid and inexpensive as possible. Non-destructive methods and automation may be particularly attractive. The best tests will additionally relate to product performance.
For predicting product performance: The essence of the test must be that it relates to product performance - the more relevant the test to service conditions the more satisfactory it is likely to be. Extreme speed and cheapness are less likely to be important but there is a need for test routines which are not excessively complex. Non-destructive methods may be acceptable.
For producing design data: The need is for tests which give material property data in such a form that they can be applied with confidence to a variety of configurations. This implies very considerable understanding of the way material properties vary with geometry, time etc. Extreme speed and cheapness are of relatively minor importance, there is little interest in nondestructive methods. For complex and long running test automation may be desirable.
For investigating failures: Having estabhshed what to look for, the need more than anything is for a test which discriminates well. There is often little need for absolute accuracy or in some cases even relevance to service.
There is of course nothing black and white about attributing these requirements to the purposes of testing but they indicate the emphasis which usually applies in each case.

General considerations 9
Tests are usually classified by the parameters to be measured -mechanical, thermal, electrical etc. These can be sub-divided to list the actual properties so that under mechanical, for example, there are strength, stiffness, creep etc. This form of classification will be used in this book because of its convenience. However, in terms of the purposes of testing discussed above and considering what is required of the results from a particular method, this classification is not particularly useful. A more generahsed way of classifying tests is to consider:-• Fundamental properties or tests • Apparent properties or tests • Functional properties or tests
Regardless of the type of property or particular parameter chosen, this classification can be helpful when considering what is needed from the result and, hence, which test method should be used. Taking the example of strength, the fundamental strength of a material is that measured in such a way that the result can be reduced to a form independent of test conditions. The apparent strength of a material is that obtained by a method which has completely arbitrary conditions and the data cannot be simply related to other conditions. The functional strength is that measured under the mechanical conditions of service, probably on the complete product.
This classification can be loosely linked to the purposes of testing. For quality control, fundamental properties are not needed, apparent properties will usually be acceptable, although functional properties would certainly be desirable. For predicting service performance, the most suitable properties would be functional ones. For design data, fundamental properties are really needed, although considerable help can often be got from functional properties. For investigating failures, the most useful test will depend on the individual circumstances but it is unlikely that fundamental methods would be necessary.
When looked at in this way, the gaps in readily available methods become obvious: most measures of mechanical properties yield apparent properties and there is a need for fundamental methods, whereas most dimensional methods and many thermal and chemical tests give fundamental properties. Overall, there is a dearth of fundamental tests. It is worth noting that when measuring the effects of environment, weathering for example, for use as design data, it may not be necessary to use a method giving absolute results to monitor changes with time. An apparent method may suffice because the change in property need only be comparative.
It becomes clear that there can never be one direction for the development of test methods and apparatus. The perceived deficiencies in the existing methods are viewed differently according to the particular purpose under consideration and, hence, development effort is targeted
10 Physical testing of rubber
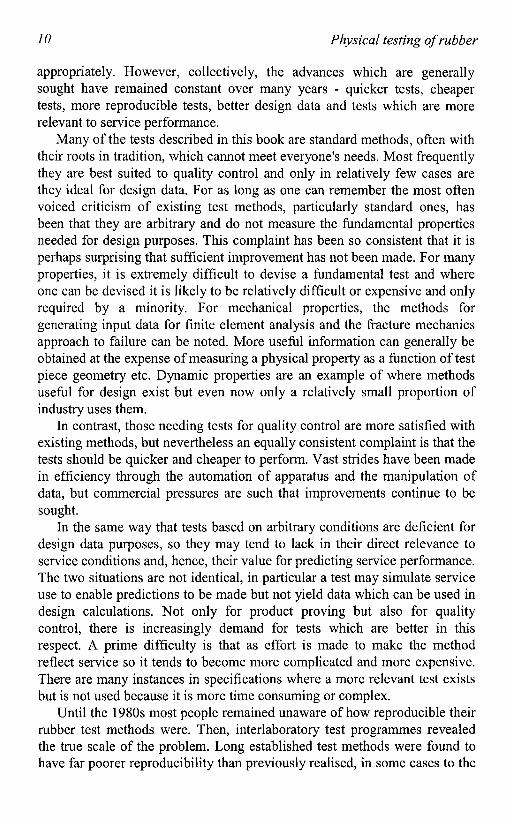
appropriately. However, collectively, the advances which are generally sought have remained constant over many years - quicker tests, cheaper tests, more reproducible tests, better design data and tests which are more relevant to service performance.
Many of the tests described in this book are standard methods, often with their roots in tradition, which cannot meet everyone's needs. Most frequently they are best suited to quality control and only in relatively few cases are they ideal for design data. For as long as one can remember the most often voiced criticism of existing test methods, particularly standard ones, has been that they are arbitrary and do not measure the fundamental properties needed for design purposes. This complaint has been so consistent that it is perhaps surprising that sufficient improvement has not been made. For many properties, it is extremely difficult to devise a fundamental test and where one can be devised it is likely to be relatively difficult or expensive and only required by a minority. For mechanical properties, the methods for generating input data for finite element analysis and the fracture mechanics approach to failure can be noted. More useful information can generally be obtained at the expense of measuring a physical property as a function of test piece geometry etc. Dynamic properties are an example of where methods useful for design exist but even now only a relatively small proportion of industry uses them.
In contrast, those needing tests for quality control are more satisfied with existing methods, but nevertheless an equally consistent complaint is that the tests should be quicker and cheaper to perform. Vast strides have been made in efficiency through the automation of apparatus and the manipulation of data, but commercial pressures are such that improvements continue to be sought.
In the same way that tests based on arbitrary conditions are deficient for design data purposes, so they may tend to lack in their direct relevance to service conditions and, hence, their value for predicting service performance. The two situations are not identical, in particular a test may simulate service use to enable predictions to be made but not yield data which can be used in design calculations. Not only for product proving but also for quality control, there is increasingly demand for tests which are better in this respect. A prime difficulty is that as effort is made to make the method reflect service so it tends to become more complicated and more expensive. There are many instances in specifications where a more relevant test exists but is not used because it is more time consuming or complex.
Until the 1980s most people remained unaware of how reproducible their rubber test methods were. Then, interlaboratory test programmes revealed the true scale of the problem. Long established test methods were found to have far poorer reproducibility than previously realised, in some cases to the

General considerations 11
extent that it could be questioned whether the tests were are worth doing and whether specifications based on them are vahd. Hence, there was greatly increased interest in improving reproducibility, although this has more often been focused on better standardisation of the test and calibration of the test parameters than on new methods.
A somewhat paradoxical situation has arisen in more recent years because of the increased interest in comparative data and databases. Some of the pressure for better design data and the criticism of the standardised methods has been turned to a demand for very tightly standardised data. To be comparable, data in a database needs to be all produced in exactly the same way and the development of standards to offer a choice of method and several choices of conditions for the same property is not compatible with this need. Consequently, there has been a lobby for what might be termed extreme standards which are specifically intended to yield completely comparable data very efficiently, but possibly at the expense of other attributes.
2. TEST PIECE HISTORY
The properties of a material and, hence, the test results obtained will depend on the processing used to produce the test material or product. Frequently, this is beyond the control of the tester and he or she is only required to characterise the samples received. Nevertheless, if any controlled comparison is to be made it is essential that the test material is produced in exactly the same way. Similarly, any preparation which is performed on the material to produce the test pieces is hkely to influence the results. Consequently, it is highly desirable that preparation is standardised and comparisons only made between test pieces produced in the same way, including the direction within the sheet that test pieces were cut. Standard procedures are discussed in chapter 4.
The history of a material or product between manufacture and testing can clearly affect its properties, although the history may not be known to the tester. Normal practice is to adopt standard conditioning procedures to bring the test pieces as far as possible to an equilibrium state, although this will not generally compensate for any degradative influences to which the material may have been exposed. In rubber testing, conditioning usually only involves temperature but if the material or property is sensitive to moisture then the conditioning atmosphere should include a standard humidity. Occasionally, mechanical conditioning is used in an attempt to reach equilibrium of the transient structure of the material. Conditioning is dealt with fully in chapter 5.

12 Physical testing of rubber
These comments make it clear that any result is not material specific but relates to the particular sample of material, the manner in which it was processed and what has happened to since it was formed. In an ideal world the test result would be accompanied by statements covering test piece history but frequently this is not possible.
3. TEST CONDITIONS
Whilst the fact that changing the test conditions will almost certainly change the result obtained is generally appreciated, it is not always strictly taken notice of There are plenty of good reasons for using different conditions - to better simulate service, to use geometries which can yield design data, to obtain data as a function of temperature, to allow tests on irregular shaped products and so on. There are also plenty of opportunities to vary the conditions unintentionally.
Many test results are sensitive to the geometry of the test piece and many of the geometries used are arbitrary so that a specified geometry should, where possible, be adhered to and it must be appreciated that it may not be simple to convert results to a different geometry. The classical example is assuming that a property is proportional to thickness when in a great many cases, for various reasons, it is not. Generally, it is necessary to have data as a function of geometry or to know the relationship between the two before conversion is attempted.
Even standard methods of test often allow alternative test pieces or procedures and these may not yield equivalent results. Hence, it is important to clearly define which procedure has been followed and, when a standard has been used, to identify any deviations made from the set procedure. Test procedure requires careful attention to detail as small, apparently innocent changes can produce significant deviation in results. Equally, it is essential that that test conditions are accurately set and maintained, which is really just one aspect of quality control considered in more detail in Section 7.
These comments on factors affecting test results may seem extremely obvious but it is a simple fact that failure to pay sufficient attention to them is the main cause of the poor reproducibility that has been found when comparisons between laboratories have been made, and the reason for most disputes over test results.
General considerations 13
4. STATISTICS
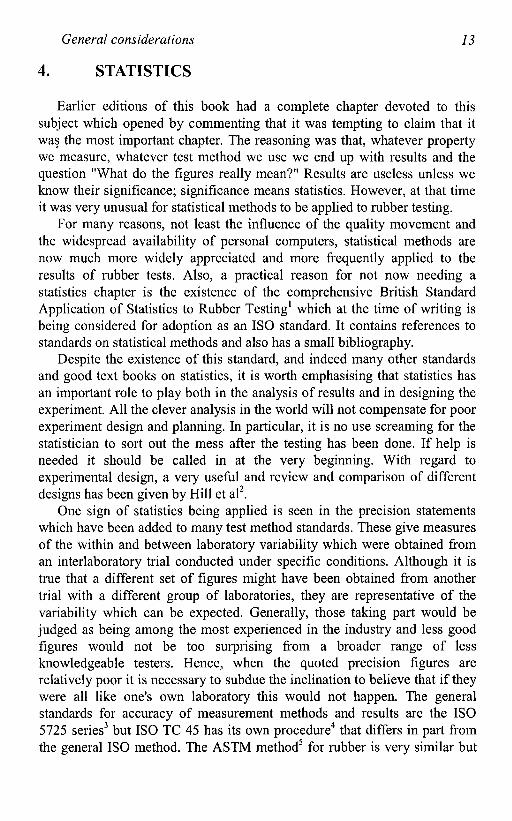
Earlier editions of this book had a complete chapter devoted to this subject which opened by commenting that it was tempting to claim that it was the most important chapter. The reasoning was that, whatever property we measure, whatever test method we use we end up with results and the question "What do the figures really mean?" Results are useless unless we know their significance; significance means statistics. However, at that time it was very unusual for statistical methods to be applied to rubber testing.
For many reasons, not least the influence of the quality movement and the widespread availability of personal computers, statistical methods are now much more widely appreciated and more frequently applied to the results of rubber tests. Also, a practical reason for not now needing a statistics chapter is the existence of the comprehensive British Standard Application of Statistics to Rubber Testing* which at the time of writing is being considered for adoption as an ISO standard. It contains references to standards on statistical methods and also has a small bibliography.
Despite the existence of this standard, and indeed many other standards and good text books on statistics, it is worth emphasising that statistics has an important role to play both in the analysis of results and in designing the experiment. All the clever analysis in the world will not compensate for poor experiment design and planning. In particular, it is no use screaming for the statistician to sort out the mess after the testing has been done. If help is needed it should be called in at the very beginning. With regard to experimental design, a very useful and review and comparison of different designs has been given by Hill et al .
One sign of statistics being applied is seen in the precision statements which have been added to many test method standards. These give measures of the within and between laboratory variability which were obtained from an interlaboratory trial conducted under specific conditions. Although it is true that a different set of figures might have been obtained from another trial with a different group of laboratories, they are representative of the variability which can be expected. Generally, those taking part would be judged as being among the most experienced in the industry and less good figures would not be too surprising from a broader range of less knowledgeable testers. Hence, when the quoted precision figures are relatively poor it is necessary to subdue the inclination to believe that if they were all like one's own laboratory this would not happen. The general standards for accuracy of measurement methods and results are the ISO 5725 series^ but ISO TC 45 has its own procedure"^ that differs in part from the general ISO method. The ASTM method^ for rubber is very similar but

14 Physical testing of rubber
the UK has not adopted the TC 45 standard, beheving that the general ISO method should be used.
Another statistical measure increasingly being used in connection with results is the estimate of uncertainty. No measurement is exact; there is always some uncertainty as to the trueness of the figure obtained. It is possible to make estimates of the likely uncertainty by considering the uncertainties introduced by each factor involved in the measurement. This includes, for example, the accuracy of calibration of each instrument used and the variation in applying the procedure. Note that uncertainty and accuracy are not the same thing - accuracy of an instrument is just one factor in the uncertainty of the measurement result. Accredited calibration laboratories have for a long time been required to make uncertainty estimates for all their measurements and the same practice is now applied to test results. The generally accepted procedures are given in Guide to the expression of uncertainty in measurement (GUM)^ and there is also an ISO technical specification that deals with uncertainty estimates from precision results^. Estimating uncertainty is not an easy matter and some assistance is available in the form of a practical guide to application of the GUM methodology^. One of the problems with estimating uncertainty from combining the contributing factors is that it is extremely difficult to get a measure for some of the factors. ISO TC 45 is currently considering the production of a guide to how to deal with this situation which, if successful, should be extremely useful.
TC 45 has also recently produced a standard for the evaluation of the sensitivity of test methods^, sensitivity being defined as a derived quantity that indicates the level of technical merit of a test method from the ratio of the test discrimination power or signal to the noise or standard deviation of the measured property. There is a very similar ASTM method^^ but, again, the UK argued that such a method should be produced by ISO TC 69 for test methods in general as there is nothing in the standard that is specific to rubber.
5. SAMPLING
The significance of test results depends to a considerable extent on how the physical sample was obtained. Whatever the purpose of testing, it is necessary to question whether the samples tested adequately represent the population being investigated. In many cases, one is limited by the amount of material available, there may be only one product or batch to be evaluated, but in routine quality control there is the added dimension of needing to sample repetitively in time. This means that a good measure of

General considerations 15
the population mean and variance is obtained eventually but there is need for a long term sampling plan and a continuous method for assessing the results.
The nature and size of a sample and the frequency of sampling obviously depend on the circumstances. First, the number of test pieces or repeat tests per unit item sampled must be decided. Our current standard methods are not consistent, ranging from one to ten or more, and it is usually argued, although open to challenge, that the more variable a test the more repeats should be made. There is no doubt that financial considerations have played a large part in the deliberations, witnessed by certain very variable but long-winded methods calling for one test piece only. There is no doubt that to use one test piece only is rarely satisfactory but testing very large numbers will not yield a proportional increase in precision. There is a trend towards five as the preferred number and this has a lot to recommend it for the more reproducible tests, being just about large enough to make reasonable statistical assessments of variability. An odd number of tests is advantageous if the median is to be extracted. In a continuous quality control scheme the number of test pieces at each point is usually rather less important than the frequency of sampling, i.e. it might be better to use one test piece but check five times more often.
Efficient sampling really boils down to selecting small quantities such that they are truly representative of the much larger whole. The necessity for sheets to be representative of batches and for batches to be representative of the formulation is self evident. The direction of test pieces relative to the axes of the sheet and randomisation of their position in the sheet are also important if the sheet cannot be guaranteed homogeneous and isotropic.
When powders are sampled, devices must be used to take representative from the sack, drum or other container, bearing in mind that coarse particles tend to separate out.
In the rubber factory, sampling is very much influenced by the fact that rubber production is a batch process and that for moulded products each heat (or lift) constitutes a batch (in a different sense). A common procedure is to sample each batch of compound mixed, but by the time the finished product is rolling off the lines several batches may well be intermixed. Good quality control schemes will enable batch traceability to be achieved. The selection of discrete products should preferably be randomised and certainly care must be taken that the sampling procedure is not biased, for example, by sampling at set times which might coincide with a shift change or other external influence. A book of random numbers (a set of tables designed to to pick numbers at random without the risk of unconscious bias) is invaluable. Sampling is very much part of quality control and information, particularly from a statistical point of view, can be found in BS 903-2^ and in quality control text books.

16 Physical testing of rubber
6. LIMITATIONS OF RESULTS
It becomes clear from the discussion of the previous sections that any test result is not absolute but is hmited by a variety of factors. Before testing starts there are limitations arising from how the material was produced, how it was sampled and how the test pieces were formed. The results are further limited by the form of test piece, the selection of the test method and the exact test conditions adopted. The actual results obtained are then subject to uncertainty limits that arise from such factors as natural material variation, tolerances on the accuracy of test instruments and tolerances on test conditions.
When an estimated uncertainty of a result is quoted it refers to the uncertainty associated with that particular measurement. It can be used to demonstrate significance of the result, for example whether it is significantly different from another result or whether it is significantly above a specification level. However, it tells us nothing about the significance of the result in terms of whether it is typical of the day's production or how different it might be from a result obtained in another laboratory. These further uncertainties can only be estimated by carrying out tests on a number of batches of production, using different test machines, etc. Although these uncertainties are real, in practice they are often overlooked because assumptions are made, such as assuming that the sample tested was typical of the whole population. This may be expedient but don't bank too heavily on getting the same results next time.
Significance in the statistical sense refers to what reliance can be placed on a result taking account of experimental error, or the extent to which the result is typical for the material. Significance can also refer to the relevance of a result in terms of material or product performance. A result might be proven to be highly significant statistically, typical of the material and exhibiting low uncertainty, but if it is of minor importance to the product performance it would not be significant in practical terms.
7. QUALITY SYSTEMS
Quality assurance is concerned with maintaining the quality of products to set standards. This embraces the control of incoming materials, the control of compounds produced, the control of manufacturing processes and guaranteeing as far as possible the quality of the final product. Quality assurance schemes utilise physical testing methods as a most important part of their system. In fact most of the standardised test methods are principally

General considerations 17
intended for quality control use and probably, in terms of quantity, the majority of testing carried out is for quality assurance purposes.
Taking quality assurance in a wide sense, it is necessary to consider specifications, the relevance of test methods, the accuracy of test methods and the statistically based control schemes which make up the discipline of the quality engineer. This is a specialised subject that happens to involve testing and it is not appropriate to consider here quality assurance of the production of rubber products.
However, in the same way that we expect factory production to be subject to a quality assurance system, so the test laboratory needs its own quality procedures. To keep apparatus, procedures and people in the best condition to produce reliable results requires systems and control. Almost certainly, the best way of achieving this in a testing laboratory is to be subjected to the disciplines of a recognised accreditation scheme. The 1809001^^ standard is commonly applied in industry and the laboratory will be included in that system. However, more rigorous and focused schemes for test and calibration laboratories have been standardised in ISO/IEC 17025*^ which requires procedures for everything from the training of staff and the control of test pieces to, most importantly, the calibration of equipment. To maintain the requirements, which are given in deceptively short form in the standards, is both time consuming and difficult but anything less than these standards is not ensuring the highest possible quality in the output of the laboratory - the results. Many countries have a national body entrusted with accreditation of laboratories to this standard (for example The United Kingdom Accreditation Service, UKAS) and they interact through such bodies as the International Laboratory Accreditation Conference (ILAC). Some of these bodies have mutual recognition agreements.
Whilst all aspects of a laboratory's operation require systematic control, it is the calibration of test equipment which gives rise to most problems and which is also the most expensive. All test equipment and every parameter of each instrument requires formal calibration. For example, it is not good enough to calibrate the force scale of a tensile machine, there are also requirements for speed of traverse, etc. plus associated cutting dies and dial gauges.
Calibration is based on the principle of traceability from a primary standard through intermediate standards to the test equipment, with estimates of the uncertainty which increases at each step in the chain. Wherever possible, bought in calibrations should be carried out by an accredited laboratory. It is perfectly acceptable for the test laboratory to do its own calibration but then they must maintain appropriate calibration standards and operate a measurement management system in accordance with ISO 10012^ . One factor which has hindered full appreciation of the detailed needs of

18 Physical testing of rubber
adequate calibration is the lack of definitive guidance. The position ha been greatly improved with the publication of ISO 18899 " , Rubber - Guide to the calibration of test equipment, and the adoption of the practice of adding a calibration schedule to all ISO rubber test methods. The guide outlines the requirements for calibration and procedure to be used for each parameter and is intended to assist test laboratories who are not experienced in calibration. The schedules list all the parameters and the associated tolerances for the test method in question and are intended as advice to the calibration laboratory.
Another area which has tended to be overlooked is the validity of manipulations made on the test data. It is probably reasonable to trust a calculator to perform a simple arithmetic operation - although that may not always be the case with the operator. However, increasingly data is being manipulated by a computer to automatically produce the test result involving quite sophisticated operations. This includes such things as area compensation, modulus calculation and curve fitting. If you carry out these tasks by hand any abnormalities are likely to be apparent but a computer will happily carry on regardless. As they say, rubbish in, rubbish out. It is essential to verify any software used to ascertain that it will produce valid results under all circumstances. A particularly obvious example is to account for offset zero points but others can be quite subtle. A computer will apply a strict formula to deriving figures from a stress-strain curve whereas a human will make judgments based on knowledge and experience. However, there appears to be little international standardization of guidance on software verification.
The object of quality control procedures in the laboratory is to produce correct and reproducible results. Up until the 1980s, although good reproducibility was desired and it was known that some tests were better than others, it was assumed that for most properties the level of agreement between laboratories was reasonable. There was not a wealth of published data to support or contradict this complacent state but the scattered accounts which could be found almost always revealed large discrepancies. One must surmise that that these did not raise great concern because of a general attitude that when there was disagreement the other chap had done something wrong!
When ASTM, followed by ISO and others, started conducting systematic interlaboratory trials to obtain precision data for test methods, the true state of affairs became apparent . For many standards the variability was worse than realised and in some cases was so bad as to question whether the tests were worth doing at all or whether specifications based on them could be considered valid. The general advance of the quality movement prompted these investigations and have ensured that reproducibility has continued to occupy one of the top spots for attention in recent years.

General considerations 19
There are a number of reasons for excessive scatter of results found between laboratories - wrong calibration, incorrect apparatus, misinterpretation of the standard, deviation from the procedure, operator mistakes etc. They reduce in the end to either the standard being too lax in its specification and tolerances or somebody is doing something wrong. An interlaboratory comparison tells you the magnitude of the scatter but not which of the possible causes is responsible. That requires further and probably very expensive investigation.
As mentioned in Section 4, interlaboratory comparisons organised by ISO committees are conducted with what are reckoned to be good quality laboratories so that they might be expected to represent an optimistic situation. However, there is some unpublished evidence that a comparison within a closer group, for example all UKAS accredited, produces better results. This would tend to indicate that more fault lies with mal-practice than with the quality of standards. On the other hand, the few investigations of the uncertainty of standard methods have found areas where the tolerances need to be tightened. The third factor, the variability of the material tested, needs to be kept in mind because there is a limit to the useful tightening of test equipment tolerances. In fact, for most tests the calculation of an uncertainty budget reveals that by far the largest factor is the material variability.
There have been various initiatives to investigate the causes of variability and make improvements but financial restrictions have kept the scale of these modest in relation to the size of the problem. One of the earlier ones was initiated by the UK Ministry of Defence^ . There are essentially three approaches:- a) interlaboratory trials with the organiser visiting each laboratory and probing into the apparatus and procedure used; b) normalising the consistent bias of each laboratory against an arbitrary "standard" laboratory and on-going monitoring of changes in the level of bias; c) systematic investigation and quantification of the possible effect of each parameter and, hence, identifying those that require closer tolerance and deriving the theoretical level of variance to be expected.
The first approach is that classically employed and in relatively small groups has had notable success. There has been a concerted effort made in Sweden for several physical tests along these lines ' . A very carefully designed and researched proposal for the second approach known as Intercal was made and a prototype run by the USA'^ but, unfortunately, it has not been further developed. An example of the third is given by a Rapra analysis of hardness^^. The functions of interlaboratory testing as a quality assurance tool in the rubber industry have been examined by Leete^^ whilst Koopman considered the idea of comparing test methods by their sensitivity^^.

20 Physical testing of rubber
Interlaboratory trials with the organiser making detailed assessments of the laboratories is clearly particularly suited to helping individual laboratories and will at least qualitatively indicate the parameters requiring attention. This approach is, however, very expensive in total effort. The Intercal approach does not identify the causes of variability immediately but certainly alleviates the effect and, because trials are on-going, allows improvement to be monitored. Systematic quantification of the effect of individual parameters is probably the most cost effective approach and is the most useful for aiding standards committees to improve the specification of methods, but is of less direct help to individual laboratories.
Any shortcoming in a standard can only be put right after analysis has pinpointed the problems. Hence, standards committees cannot act quickly if an interlaboratory trial reveals excessive variability. It is highly unlikely that faults in standards account for the majority of variance, although clearly it is important that any that do exist are identified and action taken.
The most powerful tool to minimise the component of variance due to error in the laboratory is the discipline which recognised accreditation schemes bring. They encompass all the likely areas which produce mistakes, documented procedures, training, checking procedures, control of samples, monitoring conditions, formal audits and perhaps above all calibration. The general quality movement has produced pressures to make laboratory accreditation commonplace and as more laboratories reach this status it must be expected that reproducibility will improve. In the current economic climate, a problem is finding sufficient laboratories able to devote sufficient time to precision trials.
8. TEST EQUIPMENT
The basic requirement for test equipment is that it is adequate for its purpose - it needs to comply exactly with any standard test method being used, be in good working order and be properly calibrated. However, there is then scope for a considerable range of level of sophistication, ease of use etc.
Going back in time some 50 years, laboratory equipment was almost all manually operated and often very dependent on the skill of the operator. The greatest change in test laboratories since then, and the rubber laboratory is no exception, is the improvements made to apparatus by the introduction of automation and, in particular, the application of computers to control tests and handle the data produced. These developments can and do influence the test techniques which are used, for example by allowing a difficult procedure to become routine and, hence, increase its field of application. However, advances in instrumentation and data handling are primarily noticed as

General considerations 21
improvements in efficiency or accuracy rather than intrinsically improving the relevance of tests to product performance. That is, the technical developments more often change the way the test is performed rather than change the basic concept. It is not practical to include a chapter on instrument hardware and software but, wherever appropriate, comment is made in later chapters on the form of apparatus now available for any particular test.
It is worthwhile to bear in mind the ways in which instrumentation advances have been advantageous, and also their less desirable aspects. Automation in particular is first thought of as saving time and, hence, money. If the test can be left to measure itself and an operator's time is saved, there is a particularly attractive cost benefit. However, automation is also frequently very important in improving accuracy, reproducibility or making a procedure possible.
Some processes are taken for granted, for example no one is on record as having sat up all night adjusting the controls of an ageing oven, and to manually maintain a temperature ramp on a temperature retraction test, although attempted, is the next thing to impossible. Thermal analysis techniques such as DSC only became feasible with developments in instrumentation, tailored dynamic loading cycles needed the introduction of servo-hydraulic machines and many other examples could be cited where we could not have the test without the instrumentation.
Automation frequently aids accuracy and/or reproducibility by being more consistent than humans. Non-contact extensometers ensure no unwanted stresses on the test piece and any automatic extensometer will be less subjective than a technician with a ruler. Digital thermometers, load cell balances and many other apparatus introductions have made measurements easier and less prone to operator error.
Time and cost saving has been most notable in the logging and processing of results where computerisation has amounted to nothing less than a revolution. Around 1970 it was estimated that a rubber testing laboratory could spend half its time processing results and presumably quite a bit more in recording them in the first place. That time is probably now only a few percent. It is also significant how views have changed. Then, it was widely held that direct links between test machine and computer were only justified in a few cases. Now, any major equipment is likely to be operated via the keyboard.
The automation of sample handling has not taken off as some predicted in the nineteen sixties when the first automatic systems were developed for tensile machines and hardness and density apparatus. Robots are rare alongside the test rig and the reason is doubtless to do with volume, as such

22 Physical testing of rubber
automation only becomes worthwhile when a very large number of identical tests have to be made.
Advances in instrumentation have not been without their disadvantages. On a pure time saving basis, tests would now be remarkably cheap but the cost advantage has been counteracted by the fact that more sophisticated apparatus costs more money and is likely to be outmoded more quickly, leading to much higher capital costs. Although development should make equipment more reliable it can be generalised that more complicated and advanced equipment requires more maintenance by highly skilled and highly paid people. The cost side of the equation has also been added to by rising standards of calibration and laboratory quality control generally. In this context, it should be noted that expensive, sophisticated equipment is all very well when a large volume of testing is needed but cannot be justified for occasional use.
The calibration of more sophisticated apparatus has also been fated with additional problems arising from the difficulty of directly reaching the actual measured values. The software which so efficiently transforms the data can give rise to concern as to what has happened between the transducer and the final output. As mentioned earlier, the software itself requires verification which is often not an easy task.
When technology allows it, there is a natural tendency to specify lower and lower tolerances on equipment parameters but this does not necessarily bring significant advantage because, for many properties, the contribution to uncertainty from material variability far outweighs that from machine accuracy. When reduced tolerances cannot be fiiUy justified there is an unreasonable cost burden to be borne by the laboratory.
9. THERMOPLASTIC ELASTOMERS
Thermoplastic elastomers are, by definition, not a conventional rubber nor a typical thermoplastic. Consequently, there has been a long and unfinished debate as to how they should be tested. A long time ago a paper considering their particular requirements' concluded that for most physical properties the methods used for vulcanised rubbers were suitable, and as a generality that is probably still true. Very significantly, ISO TC 45 decided to add thermoplastic elastomers to the scope of rubber test methods wherever the method was thought suitable, so that now the majority of ISO physical test methods for rubber include thermoplastic in the title. Consequently, although thermoplastic elastomers are not necessarily specifically mentioned in each chapter of this book, with few exceptions it is

General considerations 23
assumed that both vulcanised and thermoplastic materials are covered in the accounts of physical tests.
This is not of course the complete story. Most often, thermoplastic elastomers are processed on plastics machinery and it will be convenient, and sensible, that test pieces are produced in the same way. The thermoplastics processability tests are also likely to be more relevant and, certainly, curemeter tests are irrelevant.
The most suitable physical properties are likely to depend on the particular material, with plastics test methods being used for the harder elastomers (where the title elastomer may not even seem appropriate) and rubber methods for the less hard and more elastic materials. Where thermoplastic elastomers are to compete with conventional rubbers then clearly rubber test methods will be expected. On the other hand, where they are being compared to normal thermoplastics it would seem reasonable to use appropriate plastics test methods.
It is unfortunate that test methods for soft plastics and for rubbers, although very similar, are not identical, for example differences in tensile stress strain, tear and hardness methods. If they were aligned, much of debate about which method to use would be ehminated. For some properties, there is a distinct difference in approach. For example, glass transition temperature is frequently determined for plastics whilst various low temperature tests have been specifically developed for rubbers.
Some of the conditions used in rubber test methods may need modifying for application to thermoplastic elastomers because of their intrinsic thermoplastic nature. If the temperatures generally used in ageing and compression set tests on thermosetting rubbers were applied to thermoplastic materials they could appear to perform extremely badly. Whether this was significant would depend on the service temperature. Data sheets need to be checked as those for thermoplastic elastomers may have used much lower temperatures that would be found for conventional rubbers, and it is only too easy to get a misleading impression of performance.
At the time of writing, there is a proposal in ISO TC 61 for a standard on Acquisition and presentation of comparable data for thermoplastic elastomer materials along the lines of those already in existence for thermoplastics. The first draft is rather different from documents on the same theme proposed in TC 45 for rubbers generally and it is to be hoped that either the two committees can cooperate on the production of a thermoplastic rubber document or the idea is dropped.

24 Physical testing of rubber
10. PRODUCT TESTING
If our knowledge of the properties and behaviour of rubbers, and hence our design rules, were such that we could predict the performance of the product accurately from tests on laboratory test pieces, then perhaps product testing would be rarely needed. The serious problem of the changes which the manufacturing process introduces can be overcome by obtaining test pieces from the product as discussed in chapter 4. However, the fact is that our understanding of the properties of rubber is simply not good enough to make performance predictions reliably in a great many cases, even if the test pieces come from the product. Hence, there will often be need to test the whole product to be sure that it will perform satisfactorily.
In the case of a new design it can be more expedient, and certainly effective, to subject prototypes to real service rather than to develop simulation tests. However, there are many cases when this is simply not sensible for time, cost or safety reasons. So, when real service trials have to be ruled out and prediction from laboratory material tests cannot be relied upon then there must be whole product testing.
It can be extremely difficult and/or expensive to devise tests to simulate service adequately and the justification for investment will be in proportion to the importance of the product in risk and/or sales terms. There is clearly much skill in designing rigs and test schedules which maximise information gained at minimum cost. In practice, there is danger of spending very large amounts and still not getting the simulation accurate enough, but most commonly the pressure is to under design the apparatus and to curtail the test programme to cut costs. By far the most difficult factor is when assessing durability and there are a number of degradative agents and some form of acceleration is required to reduce the time scale.
The same principle applies to quality control testing, but here there is much greater probability that the experience gained from proving the product initially will allow the quality of subsequent production to be reliably judged on the basis of tests on test pieces or the product test procedure can be simplified.
Sometimes a product test will give more valuable assessment of quahty for the same testing cost as needed for test pieces. This would be true, for example, for compression testing of a simple engine mounting (Figure 2.1) because the cost of moulding test pieces would be little different from the value of the mounting and the testing costs would be equal. It would be pretty pointless to go to the trouble of cutting test pieces from the mounting. When the value of the product is high, it is again a matter of judging whether control on test pieces gives sufficient confidence to reject the costly

General considerations 25
alternative of product tests. In this situation, non-destructive tests become particularly attractive.
MOULD TEST PIECES
CUT TEST PIECES
TEST TEST TEST
Figure 2-1. Choices for compression testing an engine mount
For both quality control and design or performance evaluation purposes, it is relatively clear when whole product testing is desirable. The question then becomes one of whether it is considered essential and, if so, how sophisticated the experiment should be. This can only be answered, albeit with great difficulty, by weighing the cost against the risks and values involved. It should not of course be forgotten that, although we may not know fully how to make predictions from material tests, for many products experience will have shown what level of material properties will be satisfactory. It would probably be fair to say that in the past the tendency has been to be somewhat frugal with product tests. There now seems to be a trend towards more product tests being specified in standards. Generally, more people want to see evidence of fitness for purpose and CEN, for example, have a policy of producing performance rather than construction/material standards.
On first reaction, this would seem to be wholly good in that logically performance tests on the product should give the greatest certainty that it will be satisfactory in service. However, it is extremely difficult and expensive in most cases to devise adequate simulation rigs. The pressures of standardisation are to demand that they are produced quickly and almost inevitably without any obvious source of funding. The most expedient route often has to be taken and rarely are there the resources to properly evaluate and refine the methods decided on.

26 Physical testing of rubber
The result can be methods which do not adequately fulfill their objectives in properly simulating service or are unnecessarily complex and unworkable within reasonable cost. Reproducability of rigs can be very bad. There is a world of difference between a rig for development purposes in one laboratory and multi laboratory product certification. If new methods are introduced which are ambiguously written or without full interlaboratory comparisons then problems and disputes are likely to follow. It can be concluded that it would be better to rely on material properties than on inadequate or ill-defined product tests but a well designed product test provides the best proof of fitness for purpose.
REFERENCES
1. BS 903 Part 2,1997. Guide to application of statistics to rubber testing. 2. Hill A, Buchholz H-V and Wenzel K. ACS Rubber Division 147* Spring Meeting,
Philadelphia, May 2-5, 1995, Paper 56. 3. ISO 5725, in 6 parts, 1994, 1998. Accuracy (trueness and precision) of measurement
methods and results. 4. ISO TR 9272, 2005. Rubber and Rubber Products - Evaluating precision for test methods. 5. ASTM D4483, 2003. Standard practice for evaluating precision for test method standards
in the rubber and carbon black industries. 6. Guide to the expression of uncertainty in measurement (GUM),
BIPM/IEC/IFCC/ISO/IUPAC/IUPAP/OIML, corrected and reprinted 1995. 7. ISO/TS 21748, 2004. Guidance for the use of repeatability, reproducibility and trueness
estimates in measurement uncertainty estimation. 8. BS PD 6461-4,2004. Practical guide to measurement of uncertainty. 9. ISO 19004, 2004. Evaluation of the sensitivity of test methods. 10. ASTM D6600, 2000. Standard practice for evaluating test sensitivity for rubber test
methods. 11. ISO 9001, 2000. Quality management systems - Requirements. 12. ISO/IEC 17025, 2000. General requirements for the competence of testing and calibration
laboratories. 13. ISO 10012, 2003. Measurement management systems - Requirements for measurement
processes and measuring equipment. 14. ISO 18899,2004. Rubber- Guide to the calibration of test equipment. 15. Veith A G. Polym. Test., 7,4, 1987. 16. White 1. Eur. Rubb. J., 175, No. 2, 1993, p 10. 17. Spetz G. Polym. Test., 12,4, 1993. 18. Spetz G. Polym. Test., 13, 3, 1994. 19. Veith A G. Polym. Test., 12, 2, 1993. 20. Brown R P, Soekamein A. Polym. Test., 10,2, 1991. 21. Leete J L. ACS Rubber Division 155 '' Spring Meeting, Chicago, Paper 9, 1999. 22. Koopmann R K. ACS Rubber Division 143 Spring Meeting, Denver, Paper 44, 1993.

Chapter 3
STANDARDS AND STANDARDS ORGANISATIONS
1. STANDARDS - TEST METHODS AND SPECIFICATIONS
It does not take much imagination to appreciate the importance of standards to trade and the exchange of information. Fortunately, rubber technologists had a strong sense of order and from the early days of the industry have supported the development of standard test procedures and the use of these in product specifications. The development of standards is ongoing and, because of increased demand for product reliability and fears of liability legislation, they are probably even more important today. National Governments have expressed their commitment to standards and there has been much discussion of the role of standards in industrial strategy. Nevertheless, in the highly competitive economic conditions of recent times standardisation has been struggling to receive the funding and the priority that it really merits.
Standards is a general term covering the documents published by a standards making body, such as the International Standards Organisation (ISO). The word specification is reserved for those standards which specify minimum requirements for materials or products. Other types of standard include Methods of Test, Glossaries of Terms, Guides and Codes of Practice. It follows that a specification may refer to several methods of test and that a commercially written specification can refer to nationally or internationally standardised test methods.
In terms of trade, it is ultimately specifications which are important, with

28 Physical testing of rubber
test methods acting as building blocks. For this reason, it made chronological sense for the test method standards to be developed first, and indeed this was generally the case in practice. Now that test methods are well developed at the national and international level, it could be argued that most of the effort available should be put into specifications, especially in the current economic climate where less money than before is available. However, the suggestion made in 1984' that progress of rubber testing is slow and barely in the right direction still has some truth today. The discussion in the previous chapter of the requirements for physical testing of polymers considered the different needs for test methods together with the particular role of standards, and it becomes clear there has been a continued need for improvement in rubber test procedures. Indeed, it will be apparent throughout this book that considerable activity in test method standardisation is still taking place. Nevertheless, there is no case for using the limited standards development resource on standard test methods which are of academic interest only and unlikely to be generally used. This does not mean that such methods should not be developed but that not all justify the standardisation process.
As a general point, it should be noted that references to standards given in this book were correct at the time of writing but because of the on-going revision process the relevant standards catalogue (web site) should be consulted to find the latest edition.
1.1 Test Methods
In this book we are concerned with methods of test and only indirectly with specifications. Leaving aside for the moment the various sources of standard test methods, one can recognise different styles or types of published methods. This is not a matter of accident but rather one of progression; the most obvious yardstick being the number of options left open to the user. In the simplest case, a particular apparatus is specified, one set of mandatory test conditions given and no choice allowed as to the parameters to be reported; this is the form in which the specification writer needs a test method. Unfortunately for those who want a quiet life, many national and international test methods have become rather more complex. This is partially a result of compromise but, more importantly, because the measurements being described are not intrinsically simple and the method will be required for a number of different purposes and, probably, for many different end products. The specification user must, therefore, select the particular conditions which best suit his or her individual purposes. In practice, they frequently fail to do this either because they omitted to read the standard carefully enough or because their understanding of it was somewhat limited. As more advanced concepts were introduced into test

Standards and standards organisations 29
method standards, there was an increase in the practice of including explanatory notes, although unfortunately these do not always achieve their desired aim.
We can conveniently distinguish four different circumstances in which a standard method is used: (a) purely for quality control, (b) as a performance requirement, (c) for development purposes and (d) for input to data sheets and databases. In the first case, the prime consideration is that precisely the same procedure is always used and also that this procedure is relatively simple and rapid. The test conditions may be completely arbitrary but one set of conditions and one set only is required. If the test is intended, apart from a quality control function, to be a measure of the performance of the product then test conditions will be chosen which have some relevance to the product end use. For development work, it is highly probable that a series of conditions will be wanted in the hope that data of use in designing future products will be realised. Unequivocal procedures are also needed for input into databases as the data must be comparable, and some of the difficulties of comparing results from different sources were discussed by Salinger^.
Committees preparing standard test methods are likely to have all these possibilities in mind and the penalty for the user of the standard is that he or she must understand the subject sufficiently well to make an intelligent selection of the conditions included to suit their particular purpose. The following example may not stand up to too close an inspection but serves, I think, to illustrate the point. If a test for resistance to liquids is considered, one would expect a quality control procedure to involve one liquid at one temperature for a relatively short time. The liquid might be a standard fuel such as liquid B of ISO 1817 and the test involve 24h exposure with volume change being measured. A rapid measuring method such as area change (see Chapter 16 Section 2.1) may be used to further speed up testing. If the testing was intended to have a performance function then the liquid met in service would be used, for example commercial petrol, and testing continued long enough for equilibrium absorption to be reached. Apart from volume change, other relevant physical properties would be measured before and after exposure. For development purposes testing would be further extended to cover a number of fluids each tested at several temperatures. Input to a database can range from the single condition as used for quality control to a series of conditions akin to development needs. An international or national standard would attempt to cater for these and other possibilities and would, hence, include a choice of measuring procedure, test temperature, duration of exposure, properties to be monitored and test liquids. Preferred test parameters might be indicated for use when there were no outside factors influencing the choice.
This is not the place to discuss in any detail what should or should not be included in standard test methods or how they should be written. The quality and the style of those in current existence varies very considerably but it is

30 Physical testing of rubber
possible to detect certain general trends. Standards have become more involved as more factors which cause variability are identified and control of these is specified. At the same time, some apparatus has been specified in a more general way, stating what its performance must be without restricting its design or construction to any particular form. This can only be done when all the important parameters have been identified. Standards can also become more complicated as the underlying principles of the property being measured become better understood and as more meaningful results are demanded by product designers.
In ISO TC 45, Rubber and Rubber Products, a decision was made recently to structure test method standards into a number of parts so that the requirements for different purposes are more clearly separated. The idea was that the first part for a given property group would be a guide and subsequent parts would be specific test methods, but it remains to be seen how this develops in practice. A guide in ISO is distinguished by giving advice as to how to test without being mandatory.
In a few cases, a guide to testing for a particular property already exists, for example the international standard for dynamic properties^ The logic here was that there are many different forms of apparatus in use, and no general consensus on a single set of test conditions, so that the alternative would be a whole series of different standards (a route taken by the plastics industry).
In the context of guides, it can be noted that ASTM also has what it terms Practices used for testing standards. A practice is a set of instructions for performing one or more specific operations but differs from a test method in that it does not include a test result. It differs from a guide in that the latter gives a series of options without a specific course of action. Nevertheless, this author finds it very difficult to understand when a test method becomes a practice but is not a guide.
As it was recognized that the number of variations included in many test method standards was not helpful in respect of obtaining input for databases, there was an initiative in the plastics industry that produced international standards for acquisition and presentation of single and multipoint data. These specify the particular test methods and test conditions to produce strictly comparable data. Very recently, this approach has been taken up in ISO TC 45 and drafts circulated based on British standards' ' ^ These standards are not explicit about including thermoplastic elastomers and, as discussed in Chapter 2, Section 9, an acquisition standard for these materials has been proposed in ISO TC 61, Plastics. An example of the problems resulting from lack of consensus on test methods was evident for EPDM polymers and the results of collaboration to rectify this have been published^.

Standards and standards organisations 31
2. ORGANISATIONS PRODUCING STANDARDS
Generally, the sources of standards can be placed into three groups:
International organisations National organisations Individual companies
Despite the argument that in terms of trade it is commercial specifications which are most important, it is probably more convenient to discuss these groups in descending order of scope, i.e. from the international downwards. In practice of course, a new test method usually proceeds in the opposite direction from humble beginnings in particular laboratories via national recognition to international status, often becoming much modified on the way.
2,1 International Standards
The ultimate state of unity would be for all countries to be using the same standards. This would obviously be of great value in smoothing the course of international trade and make it easier for technologists to exchange technical information. It is also a very ambitious concept that the countries of the world can compromise on their national procedures and overcome the very great difficulties of language in a field where language is the most important tool of trade.
2.1.1 The International Organisation for Standardisation
In most fields, including rubber, the principal body attempting to achieve the ideal of international agreement is ISO, the International Organisation for Standardisation (commonly referred to as The International Standards Organsiation) which is, hence, our most important organisation in the standards field. The ISO in its present form is not a very old organization, being formed in 1946 after previous attempts at setting up this sort of body had met with little success. It should be noted that ISO is non-governmental and members are not delegations of national governments.
The work of ISO is administered by a permanent central secretariat with headquarters in Geneva and has as members more than 140 national standards bodies, one body per country. Apart from central committees concerned with planning, certification, etc., the technical work of ISO is carried out by technical committees, each relating to a particular area of industry. The secretariat of each technical committee is held by a member country and each member may join any committee either as a participating

32 Physical testing of rubber
(P) member or observing (O) member. The P members have voting rights at committee meetings. The choice of P and O member depends on the country's interest and the finance available. Complete details of the organization including a list of member bodies can be found at www.iso.org. Committee procedures and rules for drafting standards can be found in the ISO Directives.
Most countries in the world are comfortable with ISO's position and with the system of one country one vote. However, in recent years there has been considerable challenge to this from within the USA which appears to stem from several factors such as:
European countries engage in anti-American bloc voting The member bodies of European (and other) countries are government backed and the delegates are pressurized by government One country one vote means superpower America can be outvoted by the small fry It is in the commercial interests of ASTM (and other USA bodies) to retain the income from their standards From 30 years experience, I can assure you that Europeans disagree too
much among themselves to get a bloc vote and that I have never seen a trace of pressure from government. We can all be outvoted, there is nothing special about the USA, and the object of the game is to get consensus. This leaves us with the main factor which is commercial interests.
The ISO committee for Rubber and Rubber Products is TC45 with Malaysia holding the secretariat, and plastics is covered by TC61. TC45 normally meets once per year, member countries acting as hosts in a sort of rotation. The delegates to the technical committee are nominated by the relevant committees of the national standard bodies.
Like most ISO technical committees, TC 45 operates with an infra structure of sub-committees, working groups and task groups. The structure has evolved over the years and the present situation is listed below, the secretariat of each sub-committee being taken by a member country.
WGIO Terminology SC I Hose
SCI WGI Industrial, chemical and oil hoses SCI WG2 Automotive hose SCI WG3 Hydraulic hose SCI WG4 Hose test methods
SC2 Physical and Degradation Tests SC2 WGI Physical properties SC2 WG2 Viscoelastic properties SC2 WG3 Degradation tests SC2 WG4 Application of statistical methods

Standards and standards organisations 33
SC2 WG5 Chemical tests SC3 Raw materials (including latex)
SC2 WGl General methods SC3 WG2 Latex SC3WG3 Carbon black SC3 WG4 Natural rubber SC3 WG5 Synthetic rubber SC3 WG6 Non-black ingredients
SC4 Miscellaneous products SC4 WGl Rubber threads SC4 WG2 Sealing rings for pipes SC4 WG3 Rubber covered rollers SC4 WG4 Rubber roof coverings SC4 WG5 Gloves for medical applications SC4 WG6 Generic marking of rubber goods SC4 WG7 Material specification for vulcanised rubber SC4 WG8 Flexible cellular materials SC4 WG9 Elastomeric isolators SC4WG 13 Coated fabrics
It can be seen that SC2 and its working groups are the most relevant to physical testing but other working groups have, of course, an interest in tests to be included in specifications, particularly specialised product oriented methods.
The order of progress towards an International Standard is that after consideration at working group level a document is proposed and circulated for voting as a new work item proposal (NWIP). If accepted, a committee draft (CD) is developed through discussion and circulated for voting. The votes and comments are considered by the working group at the next meeting of the technical committee. If agreement is reached, the revised document is again circulated for voting, this time as a draft international standard (DIS). Assuming there is majority agreement, after consideration of the comments a final draft international standard (FDIS) is circulated for voting. Only editorial comments are considered at this stage and, if approved, the document proceeds to pubhcation. It is immediately obvious that this process is relatively slow, although the time scales have been significantly shortened in recent times. Although certain short cuts are possible, a document could pass through a second or even a third CD if agreement proves difficult. It is difficult enough to reach agreement on a standard procedure within one country and the problems internationally are considerably greater, not being helped by language difficulties. Therefore, there must be a limit to the time scales that are feasible and many would say that the limit has now been reached.

34 Physical testing of rubber
ISO standards are given individual numbers, but there may be more than one part to a standard. The year of pubUcation is added so that different editions of the same standards can be recognised. After 5 years, a standard is reviewed by member ballot and either confirmed, withdrawn or proposed for revision. If revision is agreed, a new draft has to go through the system starting with a new work proposal.
ISO standards were first published in 1972; before that time ISO recommendations was the title used. It is not obligatory for the ISO standards to be incorporated into a national system but obviously the whole aim is a little defeated if this is not done. The British Standards Institute (BSI) takes a very positive attitude in this direction following the dictum 'Do it once, do it right, do it internationally'. Wherever possible, British standards are nowadays identical with ISO standards and have the same number (some older methods are still dual numbered). Furthermore, the standard is adopted and published nationally very rapidly without significant delay. This policy is followed by many other countries but, very significantly, not by the USA.
There are at present approaching 400 ISO standards published in the rubber field. These are listed in the ISO Catalogue which can be accessed on the web site. Additions during the year are publicised in national body newsletters such the British Standards publication Update Standards. ISO standards are usually obtained from your national standards body and there is hkely to be a large discount if you become a subscribing member.
2.1.2 Other international standards
In the electrical field the International Electrotechnical Commission (lEC) performs the same function as ISO. The work of this body is of interest where rubbers are used in electrical insulation, etc. As regards electrical test methods for rubber, ISO and BSI have tended to adapt the basic procedures and principles standardised by lEC or to rely on the lEC standards.
There are many other international organisations concerned with standards and a short guide to some of these is given in BSO: Part 1 which makes clear the confusing abbreviations of titles in use.
2.1.3 European standards
There are a number of regional standards organizations which vary in their constitution and scope but are basically cooperation between a number of national standards bodies in a particular geographical area. Lusby^ rather neatly likened their position to "halfway down the stairs" as in a poem by A A Milne. They sit between the national and the International bodies but one

Standards and standards organisations 35
is not too sure how to describe their position or whether we really need them.
European countries have to take note of The European Committee for Standardisation (CEN) which was founded in 1961 and comprises the national standards bodies of EC and EFTA plus some eastern European countries. CENELEC is the equivalent body in the electrical field. To many people, the concept of European standards, or any other national grouping, is an unnecessary complication, it being argued that there is no need for any activity in between ISO and the national bodies. However, the work of CEN assumes great commercial importance because EC countries are bound to adopt them to replace national standards and they can be used to demonstrate compliance with EC Directives. The CEN web site can be found at www.cenorm.be.
CEN operates through a series of technical committees in a similar manner to ISO but there scopes do not necessarily coincide. At present there is no CEN committee for rubber although a considerable number of rubber products are covered by particular CEN product committees. It becomes clear that the relationship between CEN, ISO and national standards can cause difficulties. The people developing standards in a particular CEN product committee may not be the same as those at ISO TC 45 and a European country could have difficulty aligning its national standards with both those of CEN and ISO. Fortunately, as regards test methods CEN make considerable effort to adopt the ISO procedures and there are mechanisms for revisions to proceed simultaneously in the two bodies. Because there is no CEN committee for rubber there have been no problems with rubber test methods.
The CEN procedures for approval of a standard involve a draft agreed by a WG and its technical committee or sub committee being circulated as a prEN (draft CEN standard). The committee may go through any number of drafts before reaching this stage. The voting on the prEN is weighted with larger countries having more votes.
2,2 National Standards
Although, generally, each country has one principal standards organisation which provides the official membership of ISO, other organisations can issue standards at national level. It is usual to include government departments in this category. It is not practical, and indeed not necessary, to consider here the national standards bodies of all countries but a hst of ISO members can be found at www.iso.org. The standards mostly used by any laboratory will depend on whom they are trading with, and information can be gained from the national bodies (ISO members). It is sometimes useful to be able to identify the source of a standard from the

36 Physical testing of rubber
abbreviations like BS and DIN which are used. Taking the whole world and including government standards the total becomes enormous and very confusing. Conveniently, the ISO web site gives an alternative list of members by acronym.
The operations of the British Standards Institution (BSI) will be outlined which, apart from being of particular interest to those trading in Britain, serves to illustrate how the process of generating standards at a national level can be undertaken. BSI is one of the longest established and most highly rated of national standards bodies. Many other countries operate in a roughly similar manner but others will be totally different. American standards are also considered, not only because of the importance and widespread use of ASTM standards, but to illustrate some of the differences in approach.
2.2.1 The British Standards Institution
The BSI was formed in 1901 and has now developed to the point where it covers an astonishing range of subjects from virtually all branches of industry. Apart from its main function of producing standards, it also operates a quality assurance division which operates BSI's certification and assessment schemes and a comprehensive test house.
BSI receives some government support (which reflects government's need for standards) but raises the majority of its income from membership fees, the sale of standards and fees from certification and testing services.
Membership of British Standards is open to virtually anyone, various categories of organisations being defined for the purpose of computing membership fees. It is in fact rather difficult for those in Britain to keep up to date on standards matters without being in membership, and the same will apply to membership of the relevant national body in other countries. Details of new standards, amendments and articles on standards matters generally are published monthly in Update Standards and the bimonthly Business Standards which are circulated to members. There are also annual editions of the BSI Catalogue which lists all the British Standards available and relates them to ISO standards. This information is available at www.bsi-global.com. BSI procedures and editorial practice are detailed in BS 0, A Standard for Standards^'^'^^
The preparation of standards is carried out by the technical committees, their sub-committees and panels. Hence, we have, for example, PRI/66 Hose and PRI 70 Elastomeric seals, and there is a coordination committee for input into ISO. Committee members are nominated by industry, government departments and research associations. The industry representatives are usually nominated by trade associations and not by the individual company, although individual experts can be co-opted. BSI supplies secretarial support, the level of which depends on how active the committee is and how important its work is considered.

Standards and standards organisations 3 7
Physical testing of rubbers is the concern of PRJ/22 which has a panel to deal with electrical tests. Until recently, there were 4 other active panels to split the detailed work on test methods but, as a result of the drive to economise effort and the effects of virtually all test methods coming from ISO, they were disbanded. Other committees which should be mentioned in the context of testing are PRI/71 which deals with flexible cellular materials, PRI/20 for accuracy of test machines, PRI 26 for burning behaviour of plastics and rubber and PRI/23 for chemical testing. Unfortunately, systems are never as simple as we would like; specialised tests may be considered in product committees and not all products containing rubber are covered in PRI committees
Consideration of an initial draft is carried out in a technical committee, sub-committee or panel as appropriate. This initial draft may have come from one of a number of sources, for example, being based on work carried out by one of the bodies represented on the committee. When agreement is reached the document is made available as a draft British standard (DC) for public comment. Nowadays these drafts are almost all draft international standards (DIS) rather than purely British developed documents. The comments are considered by the technical committee and the amended document passed for publication or the collated comments sent to ISO. Consensus is reached through discussion and there is no formal voting. Revision of standards is by 5 year review as for ISO.
Each standard is numbered and dated in the same manner as ISO. Increasingly, with the ISO standard being adopted, the number is identical and the designation is BS ISO xxxx. Similarly, BS EN xxxx signifies that it is identical with the European standard and BS EN ISO that all three are identical. Older standards may be dual numbered as BS xxxx/ISO yyyy. As an alternative to keeping up to date using Update Standards, BSI operates an automatic updating system to which clients may subscribe and the catalogue of standards can be obtained and updated on CD.
2.2.2 Other British standards
Standards or specifications issued by individual companies are not considered to be of national status, however large or multi-national the concern might be. Specifications issued by local authorities and nationalised industries would be in the same bracket. Organizations such as Rapra Technology (The Rubber and Plastics Research Association), The British Rubber Manufacturers' Association, the Tun Abdul Razak Research Centre and the Institute of Materials, Minerals and Mining do not issue standards.
Government departments, although contributing to the work of BSI, also produce their own standardisation. The reasons for this are really similar to those which apply to individual companies - they are unable to wait for the BS svstem or they have specific requirements unique to themselves. This
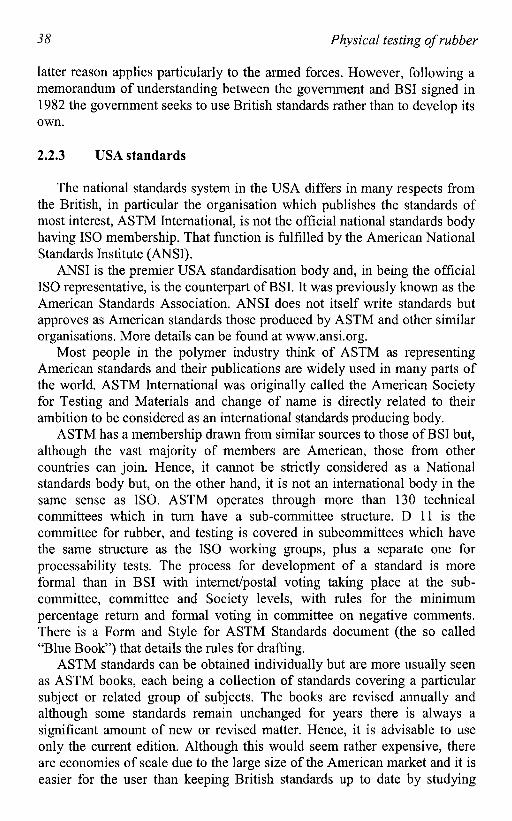
38 Physical testing of rubber
latter reason applies particularly to the armed forces. However, following a memorandum of understanding between the government and BSI signed in 1982 the government seeks to use British standards rather than to develop its own.
2.2.3 USA standards
The national standards system in the USA differs in many respects from the British, in particular the organisation which publishes the standards of most interest, ASTM International, is not the official national standards body having ISO membership. That function is fulfilled by the American National Standards Institute (ANSI).
ANSI is the premier USA standardisation body and, in being the official ISO representative, is the counterpart of BSI. It was previously known as the American Standards Association. ANSI does not itself write standards but approves as American standards those produced by ASTM and other similar organisations. More details can be found at www.ansi.org.
Most people in the polymer industry think of ASTM as representing American standards and their publications are widely used in many parts of the world. ASTM International was originally called the American Society for Testing and Materials and change of name is directly related to their ambition to be considered as an international standards producing body.
ASTM has a membership drawn from similar sources to those of BSI but, although the vast majority of members are American, those from other countries can join. Hence, it cannot be strictly considered as a National standards body but, on the other hand, it is not an international body in the same sense as ISO. ASTM operates through more than 130 technical committees which in turn have a sub-committee structure. D 11 is the committee for rubber, and testing is covered in subcommittees which have the same structure as the ISO working groups, plus a separate one for processability tests. The process for development of a standard is more formal than in BSI with internet/postal voting taking place at the subcommittee, committee and Society levels, with rules for the minimum percentage return and formal voting in committee on negative comments. There is a Form and Style for ASTM Standards document (the so called "Blue Book") that details the rules for drafting.
ASTM standards can be obtained individually but are more usually seen as ASTM books, each being a collection of standards covering a particular subject or related group of subjects. The books are revised annually and although some standards remain unchanged for years there is always a significant amount of new or revised matter. Hence, it is advisable to use only the current edition. Although this would seem rather expensive, there are economies of scale due to the large size of the American market and it is easier for the user than keeping British standards up to date by studying

Standards and standards organisations 39
Update Standards. There are currently 77 volumes of ASTM standards, those concerning rubbers in particular being volumes 09.01 and 09.02. ASTM is active in the technical field apart fi-om purely producing standards. It organises conferences and publishes numerous books and reports as well as the journal Standardization News. For further information go to www.astm.org.
2.3 Company Standards
There must be literally millions of company standards in existence. Although they have relatively little significance in a national or international sense, they are the basis of many commercial contracts and, hence, are perhaps the most important standards of all. Unfortunately, the quality of commercial standards is very variable.
Using a commercial standard is like using any standard, the user must be careful that he has the latest edition and that he has read it very carefully and missed none of the detail. A common fault is that rather a lot of detail is missing, for example there may be insufficient information in a test method to be sure that you are carrying it out correctly. All one can do is to talk to the originator of the standard.
It would save a great deal of pain and confusion if those writing commercial specifications would, wherever possible, use published standard test methods, their national methods for local trading and, preferably, those of ISO for international trade. Special tests will often be needed but there is no point in inventing your own procedure for a straightforward test which has been well standardised. Perhaps a lot of the trouble is that in some cases those writing specifications are not well versed in standardisation outside of their own organization, and also that many engineers have a poor understanding of rubbers and their properties.
3. UNITS
In the 1st Edition of this book (1979) it was noted that it should be unnecessary to state that SI units will be used - that will be assumed to be the case. However, even now the Imperial System lingers on in a few isolated outposts. The universal adoption of SI units virtually eliminates the need to include a section on units because there is no question of conversions or explanations of obscure systems. However it is appropriate to make reference to relevant information.
The basic reference is to ISO 100 ^ which details all the units, multiples and sub-multiples to be used. The British standard is identical. ASTM gives guidance on the use of SI units in the Form and Style document which refers

40 Physical testing of rubber
to IEEE/ASTM-SI-10^^. This standard for use of the International System of Units but is given in the ASTM hst as a Historical Standard but there is no obvious replacement. It should be noted that, although both SI and Imperial units are given in ASTM rubber testing methods, SI units are considered the standard.
Certain special considerations will apply in any particular industry and both ISO committees TC45 and TC61 have actively considered the subject. Their conclusions on units which are normal to their materials and products have been included in their own procedural documents.
Where there is a need to convert to or from SI units, reference can be made to the conversion factors found in BS 350^ , which has recently been revised, or use made of conversion software, for example "Convert" from Rapra Technology.
REFERENCES
1. Brown R P. Europ. Rubb. J., 166, 7, 1984. 2. Salinger R M. 144th meeting Rubber Division American Chemical Society, Oct. 26-28,
1993, Paper 70. 3. ISO 4664,1998. Guide to the determination of dynamic properties 4. BS 903-3,2003. Acquisition and presentation of comparable single-point data. 5. BS 903-4, 2003. Acquisition and presentation of multi-point data. 6. Noordermeer J W M. Rubb. World, 216, No. 2, 1997, p 18. 7. BS 0, A Standard for standards. Part 1, 1997. Guide to the context, aims and general
principles. 8. Lusby L. ASTM Standardisation News, December 1999, p 24. 9. BS 0: A Standard for standards. Part 2, 1997 Recommendations for committee procedures. 10. BS 0: A Standard for standards. Part 3, 1997 Specification for structure, drafting and
presentation. 11. BS ISO 1000, 1992 (plus Amd 1 1998). SI units and recommendations for the use of their
multiples and of certain other units. 12. lEEE/ASTM -SI-10. Standard for use of the international system of units. 13 BS 350,2004. Conversion factors for units.
Chapter 4
PREPARATION OF TEST PIECES
Except for work on complete products, a test piece must be formed before the test can be carried out. In many cases, the test piece can be directly moulded but, particularly when tests on finished products are concerned, the specimens need to be cut and/or buffed to some particular geometric shape (Figure 4.1). It is convenient to consider separately, first the mixing and moulding leading up to a vulcanised (or thermoplastic) test piece or test sheet, and secondly the preparation of test pieces from moulded sheets or products. The preparation of test pieces for tests on raw rubber and unvulcanised compounds will be considered integrally with those tests in Chapter 6.
1. MIXING AND MOULDING
Processing variables can affect to a very great extent the results obtained on the rubber product or test piece and, in fact, a great number of physical tests are carried out in order to detect the result of these variables, for example state of cure and dispersion. In a great many cases, tests are made on the factory prepared mix or the final product as it is received but, where the experiment involves the laboratory preparation of compounds and their moulding, it is sensible to have standard procedures to help reduce as far a possible sources of variability. Such procedures are provided by ISO 2393 which covers both mills and internal mixers of the 'Banbury' or 'Intermix' type, and also procedures for compression moulding.
The standard does not specify such details as temperatures and mixing schedules, which must be taken from the particular material specifications or, presumably, agreed between the parties concerned. It is doubtless next to

42 Physical testing of rubber
impossible to give such details for a reasonably wide range of formulations and, hence, if no material standard is being used, the onus is on the operator to devise and record a reproducible procedure. It could then be said that the general principles of ISO 2393 were followed.
Moulding sheet or test piece
Die
V
\///////////////////////////> '}/////////\ /
Stamping fix)nfi slieet Ring or disc using rotary cutter
Open Structure Abrasive Wheel BandKn'rfe
Y///////m Buffing to make smooth sheet slitting to make thinner sheet
Figure 4-1. Methods of test piece preparation
The tolerance allowed on mass of ingredients is fairly tight at 1% generally but down to 0.02g for sulphur and accelerators. For miniature internal mixers this reduces even further to 0.002g. There are limits on the difference between the sum of the masses of the ingredients and the final mass of the mixed batch of between + 0.5% and - 1.5%. Carbon black is required to be conditioned before use to remove moisture but it seems curious that this is not required for other fillers.
A two-roll mill is specified fairly precisely in terms of dimensions, 150 -155 mm diameter x 250 - 280 mm long, with the front roll speed 24±1 rpm

Preparation of test pieces 43
and roll speed ratio preferably 1:1.4. The temperature control is required to be within ±5°C unless otherwise specified. A simple procedure is given for determining the clearance between rolls to ±0.01 mm.
Three types of mixer are recognized, plus a miniature mixer which would provide just enough compound for a curemeter test and one sheet. Mixers types Ai and A2 and the miniature device have non-interlocking (tangential) rotors whilst type B has interlocking rotors. Dimensions of the larger mixers are specified fairly precisely, including new and worn rotor clearances, and they are required to have temperature control, a system to record power or torque and a timer. The miniature mixer is only specified in terms of capacity, rotor speed and friction ratio but is required to control of temperature, indication of power and a timer.
Outline procedures are given for using both mill and internal mixers which provide a very sound basis for obtaining reproducible mixes provided the detailed schedule for any particular mix is properly standardised and adhered to. This is all that can be hoped for considering that, in general, the results from laboratory mills and mixers are not identical with those obtained with full-sized factory equipment.
The conditions and time of storage between mixing and vulcanisation can affect the properties of the vulcanisate and, hence, storage at standard temperature as given in ISO 23529^ is specified (ISO 23529 incorporates what was ISO 471), preferably in a dry atmosphere. The range of time allowed is rather large at a minimum of 2h, and a maximum of 24h, but this is a practical range for normal laboratory operations. It is not made absolutely clear that the mix is cooled to room temperature before the beginning of the storage period.
ISO 2393 specifies cavity moulds for the compression moulding of sheets and ring test pieces. The sheet mould is specifically intended for providing tensile dumbbells and an alternative size specified is aimed at there being unequivocal positioning of the blank with respect to the grain direction.
Details are given for the press and mould construction and for the vulcanisation procedure. The most important parameters are the time and temperature of moulding and ISO 2393 specifies close hmits, ±0.5°C, on the latter. ISO 2393 requires only that the mould is loaded and unloaded as quickly as possible but the mouldings are to be cooled in water, or on metal plates if intended for electrical tests, on removal. One has to assume that cure time is derived from curemeter measurements.
The British equivalent is BS 903-A64^ which is identical except for a national foreword and appendix. The foreword points out some of the differences from the previous British standard, which are the inclusion of a second tangential mixer, a miniature mixer and a mould for ring test pieces

44 Physical testing of rubber
(not common in the UK), and the omission of a stepped mould. It also recommends thicker plates for the ring mould. The omission of the stepped mould is overcome by it being detailed in the national appendix. The advantage of this mould is that it allows production of a dual thickness sheet from which tensile dumb-bells and compression set/hardness test pieces can be obtained. It is difficult to see why the ISO standard does not include this mould or, alternatively, specify a mould giving thicker sheets. The previous British standard also specified a frame type mould for sheets which is commonly used in practice, but it is not known why this has not been mentioned in the foreword, nor why it was not considered for the ISO standard.
Whilst thermoplastic elastomers are being included in most test method standards, we do not have a procedure for their preparation and moulding.
ASTM standardisation follows the same pattern as ISO and BSI standards in that there is one standard 03182"^ covering the mixing and moulding equipment and general procedures to be adopted, with detailed mixing schedules being left to relevant material standards. All three standards clearly had the same root and the current D3182 looks like an earlier version of the ISO. There are significant differences in details of the weighing tolerances and the conditioning of carbon black but the principles are the same. The ASTM standard specifies the same mill and includes the smaller Banbury type of internal mixer and a miniature mixer, but not the Intermix. As regards moulds, it has a 150 x 75 mm sheet as well as a 150 x 150 mm and gives an alternative cutoff bar type of mould. Ring test pieces and a stepped mould are not included. Details are given of standard reference ingredients to be used in standard rubber formulations, but this is not relevant to general use of the standard.
Considering that there is perhaps no absolutely correct procedure for mixing and moulding, it is not surprising that there is not universal agreement. The essential is that reproducible test pieces are produced and, as the standards make clear, this can only be achieved by applying the tightest possible control on equipment, times, temperatures and procedures. The reverse needs also to be remembered, that the results obtained when testing a material depend to a considerable extent on how it was mixed and moulded.
2. CUTTING FROM SHEET
Although it is debatable whether mixing and moulding are strictly part of testing, particularly as these processes are often not under the control of the tester, there is no doubt that the preparation of test pieces from moulded sheet or products is part of the testing process. The most common operation

Preparation of test pieces 45
is cutting or stamping from sheet, by which means the vast majority of test piece shapes can be produced.
To stamp, for example, a dumb-bell from sheet requires only a die and a press, although a hammer has been known to replace the latter. There has been a tendency to treat stamping as so simple an operation as to merit little attention, despite the fact that the accuracy of the final test result depends very considerably on the accuracy with which the test piece was prepared. The necessary dimensions of the die are given in the relevant test method standard, for example ISO 37^ for tensile properties, but there is ISO 23529^ which deals specifically with the preparation of test pieces for physical tests. ISO 23529 now incorporates what was ISO 4661 Part 1 but ISO 4661 Part 2 still exists and deals with the preparation of samples for chemical tests. The British standard is identical to the ISO standard^.
The first requirement is that the test piece should be dimensionally accurate but this is not dealt with in ISO 23529, the necessary tolerances and dimensions remaining a subject for the individual test method. The important dimensions can be conveniently checked on a cut test piece using a projection microscope, but the dimensions of the cut test piece will not necessarily be identical with the dimensions of the die because of the pressure of the blade deforming the rubber. In the majority of tests it is the test piece dimensions which are those specified.
It is essential that cutters are very sharp and free from nicks or unevenness in the cutting edge which would produce flaws in the test piece. This is especially important for tests involving the measurement of strength, where a flaw would produce premature failure. Even with the sharpest cutter, there is a tendency for the cut edges of the test piece to be concave and it is normal to restrict stamping to sheet no thicker than 4 mm at the very most, as the 'dishing' effect becomes more severe as the thickness increases. Thicker sheet is cut more successfully using a rotating cutter.
Dies for stamping can be of two types, fixed blade and changeable blade. A suitable design for the cutting edge profile of a fixed edge blade type is given in ISO 23529 and the standard also points out the necessity for the die to be suitably rigid and the desirabihty of some form of test piece ejection system. If there is no automatic ejection system some care has to be taken not to damage the cutting edge of the die or the test piece whilst prodding with whatever sharp object has come to hand. Changeable blade type cutters make use of sharpened strips of the steel rather like long single-edged razor blades. These have the obvious advantage of being very sharp when new and are simply replaced when blunt. They are commonly used for simple shapes such as parallel sided strips but, although very successfiil dumb-bell cutters were made in this manner many years ago^ they have not become

46 Physical testing of rubber
commonplace. The virtues of a commercially available replaceable blade dumb-bell cutter have been demonstrated by the manufacturer^.
ISO 23529 does not give any details of the press which should be used with the dies for stamping operations and this probably confirms the fmding^^ that the particular design of press is not important as long as it operates smoothly and vertically to the test piece surface. A hammer is unlikely to do this! In practice, quite a variety of presses are to be found and, although the choice is largely a matter of personal preference, there are several points which can be considered. Automatic sample ejection has been mentioned, but this is not very easy to combine with rapid interchange of die shapes. Some toggle action presses require rather more force to operate than is convenient for routine use. Recoil types can be operated very rapidly but are found by some people to be difficult to use. For general use, there is a lot to be said for the screw action type operated by a large hand-wheel. Motorised presses are only worthwhile if the volume of work is very large.
Rotary cutters can be used to produce discs or rings from thin sheet and are necessary for sheet above about 4 mm thick to prevent distortion. Generally, such cutters are used on vertical drilling machines and may consist of either annular or part annular blades. A number of designs have been tried, including the incorporation of a second blade simultaneously cutting a large diameter disc. No particular design is referenced in ISO 23529 nor is any recommendation given as to suitable speeds of rotation, but it does mention possible means to hold the test piece. Further information can be found in certain test method standards regarding the preparation of the test piece required for that particular test.
The cutting of rubber is made much easier if a lubricant is applied to either the rubber or the cutting blade. A lubricant which has no effect on the rubber must be used and a weak solution of detergent in water has been found suitable. It is not normally necessary to lubricate for stamping operations but it is virtually essential when using a rotating cutter.
The effect of blunt cutters on tensile strength was investigated as long ago as 1934 by van Wijk ^ and later by Scott*^ who found that blunt knives lowered tensile strength on ring test pieces by 8%. Chipped cutters could have a greater effect and it is essential that only sharp blades are used which, for fixed blade cutters, means frequent sharpening. It would appear that nothing is more simple than to obtain a sharp cutter but it cannot be over emphasised that many low results and cases of poor reproducibility are caused by blunt or chipped cutting dies. People take them for granted but they need hours of attention and sharpening is a very skilled job. This can be done by the manufacturer or by workshop personnel, but only rarely is the necessary facility and expertise available in the laboratory. A technique suitable for the laboratory has been described by Ennor ^ which uses shaped

Preparation of test pieces 47
stones in a vertical drilling machine and this procedure is reproduced in ISO 23529. Experience at RAPRA has shown that drilling machines generally revolve too slowly and better results may be obtained using the high speed router of a plastics test specimen machining apparatus.
It should be noted that the procedure of using cylindrical stones with the die mounted on a tilted base is inaccurate on the curved parts of the die.
3. TEST PIECES FROM FINISHED PRODUCTS
When it is the product rather than the material that is being investigated, it is obviously desirable to make tests, wherever possible, on the actual finished product rather than on specially prepared test pieces, which may have been produced under rather different conditions. Apart from the difficulty of having sufficient bulk in the product to obtain standard test pieces, extra operations may be involved which are time consuming and are likely to lead to lower test results because of destruction of the moulded surface. However, these difficulties can often be overcome satisfactorily by the use of miniaturised test pieces and by careful use of cutting and buffing apparatus.
The additional operations which may be necessary to obtain a test piece from a finished product are cutting from a large block and the reduction of thickness or removal of irregularities.
In practice, the cutting from a large product is often carried out in an arbitrary fashion using a variety of knives and hammers. ISO 23529^ covers cutting and buffing from products as well as from test sheets and makes reference to rotating knife equipment. This can simply mean a powerful bacon sheer, which is indeed very effective if the product can be gripped efficiently. The standard also makes reference to skiving machines based on leather slitting machinery. These are precision machines and not in very widespread use because of high cost. They are, however, extremely efficient and the best equipment is capable of slitting a visiting card.
Buffing is most effective for the removal of surface irregularities, including those left by cutting operations, or moderate reduction of thickness. Although it should not be used to remove large quantities of material, when cutting is both quicker and less damaging, rather more than just cloth impressions can conveniently be buffed away. The particular disadvantage of buffing is that heat is generated which may cause significant degradation of the rubber surface and, hence, the best results are obtained when heat build-up is minimised.
The effect of buffing on tensile properties has been studied by Morley and Scott " using a buffing machine with manual test piece feed. They

48 Physical testing of rubber
concluded that strength is most affected on soft rubbers, by as much as 15%, whilst for a tyre tread type the drop was about 5% when a smooth surface had been obtained by careful buffing with an 80 grit wheel. Later tests^^ conducted using a machine with automatic test piece feed and specially chosen open structure abrasive wheels, confirmed that tensile strength and elongation at break could be significantly lowered and that modulus may be increased. The magnitude of the effect varied for different rubbers. The more automatic apparatus was considerably safer and more convenient to use as well as being easier for unskilled operators.
Morley and Scott's work suggested that, although it was necessary to obtain a smooth finish, the depth of cut was not important. However, ISO 23529 places a maximum of 0.2 mm on depth of cut on the assumption (perhaps erroneous) that heat build-up is minimised by making several light cuts. The standard specifies both abrasive wheel and abrasive band types of buffing machines, claiming that the latter produces less heat build-up. No mandatory parameters for the machines are given but grit sizes and surface speeds are suggested.
ASTM D3183^^ deals only with cutting test pieces from rubber that is not in the form of sheets, but the content is very similar to the relevant parts of ISO 4661, covering slicers, skiving machines, buffing wheels and abrasive bands. Apparently, buffing wheel apparatus is known as an Emerson type rubber buffer in the USA, presumably after a manufacturer.
More recently, James and Gilder ^ have made an extremely careful and detailed study of the effects of both buffing and slitting in comparison to moulded surfaces, taking into account the grain from milling operations, grain from the splitting or buffing operation, degree of carbon black distribution and degree of cure.
They concluded that their results confirm previous work in that buffing, when carried out very carefully, gives tensile results which compare reasonably with those from moulded sheets but that the differences vary with the compound. Grain and degree of cure were more dominant than the texture produced by buffing and the former may well account for some of the results obtained by Brown and Jones'^ For some soft rubber compounds, buffing would be better than slitting. They found slitting to be generally as good, and perhaps a little better, than buffing but may be difficult to use outside of the hardness range 55 - 85 IRHD.
Whichever method of preparation is used, they suggest that the surface lines induced by the preparative technique run parallel to the dumb-bell axes and that treating one side of a sheet is as effective as treating both. They also suggest the use of the ratio of tensile strength to elongation at break to indicate whether grain is likely to have a dominant influence on the test results.

Preparation of test pieces 49
It is extremely unlikely that the conditions for buffing and slitting given in the standards are the only conditions which yield good results and there is no one best procedure for all circumstances. Certainly, the cutting or buffing operations may significantly affect the measured properties but this can be minimised by careful choice of conditions and procedures. Furthermore, apparatus is available which allows these operations to be carried out with reasonable convenience.
As would be expected, James and Gilder report that the degree of cure can be crucial. This may be an important factor if cure varies through a thick product or sheet but is especially likely to be an influence when results from sheets and products are compared. A study covering a number of different products ^ revealed very significant and sometimes alarming differences, indicating that in many instances the difference in results from sheets and products will be much more due to processing differences than to test piece preparation. This provides considerable support for the school of thought which strongly advocates taking test pieces from the product despite the extra difficulties.
The effect of test piece dimensions on results will be mentioned on several occasions in later chapters in relation to particular tests but it can also be made as a general consideration. If the test piece obtainable from a product is not of standard dimensions this is very likely to significantly influence the result obtained.
REFERENCES
1. ISO 2393, 1994. Rubber test mixes - Preparation, mixing and vulcanisation - Equipment and procedures.
2. ISO 23529, 2004. General procedures for preparing and conditioning test pieces for physical test methods.
3. BS 903-A64, 1995. Method for the preparation, mixing and vulcanization of rubber test mixes.
4. ASTM D3182, 1989(2001)81. Standard practice for rubber - Materials, equipment and procedures for mixing standard compounds and preparing standard vulcanized sheets.
5. ISO 37, 1994. Determination of tensile stress strain properties. 7. BS ISO 23529, 2004. General procedures for preparing and conditioning test pieces for
physical test methods. 8. Delabertauche C and Dean S K. J. IRL, April 1968. 9. Shoemaker K. Rubber Technology International, 1996, p 150. 10. RAPRA. Unpublished Information. 11. van Wijk, Kautschuk, 10, 1934 12. Scott J R. Journal of Rubber Research, 13, No. 4, April 1944. 13. Ennor J L. Journal of the IRI, April 1968. 14. Morley J F and Scott J R. Journal of Rubber Research, Oct. 1946. 15. Brown R P and Jones W L. RAPRA Bulletin, Feb. 1972.

50 Physical testing of rubber
16. ASTM D3183,2002. Preparation of pieces for test purposes from products. 17. James D I and Gilder J S. RAPRA Members Report No. 87, 1984. 18. Brown R P. Polym. Test, 2, No. 1, 1980.

Chapter 5
CONDITIONING AND TEST ATMOSPHERES
The properties of rubber depend, often to a considerable extent, on its history before test and the atmospheric conditions under which the test was carried out. That is, the results are affected by the age of the rubber, the conditions such as temperature and humidity under which it was stored, any mechanical deformation before test and temperature and humidity at the time of the test. Hence, to produce consistent results it is essential that these factors are controlled within suitable limits.
It is usual to divide the period before test into storage and conditioning; where conditioning refers specifically to the process of bringing the test pieces to the required conditions of temperature and perhaps humidity immediately before test, and storage refers to the period before this back to the time of forming.
1. STORAGE
The properties of vulcanised rubbers change most rapidly immediately after vulcanisation but later, assuming that no accelerating influences are present, the changes become so slow as to be negligible over a period of, say, a few weeks. Hence, it is desirable that a minimum period is allowed between vulcanisation and testing. This minimum period is inevitably arbitrary, but has been standardized. It was previously given in a separate standard, ISO 1826, but has now been incorporated into ISO 23529\
The object of having requirements given in a specific standard is to avoid variations in the wording and to avoid having to repeat it in each method. However, the essence of the wording is reproduced in most ISO standards; the following is the current ISO 23529 version:-

52 Physical testing of rubber
For all tests, the minimum time between forming the material and testing shall be 16 h. When test pieces are cut from products or where whole products, e.g. bridge bearings, are tested, considerably more than 16 h may be necessary. In these cases, the minimum time shall be given in the product specification and/or relevant test method.
For non-product tests, the maximum time between forming the material and testing shall be 4 weeks and, for evaluations intended to be comparable, the tests shall be carried out, as far as possible, after the same time interval.
For product tests, whenever possible, the time between forming the product and testing shall not exceed 3 months. In other cases, tests shall be made within 2 months of the date of receipt of the product by the customer.
The 16h period must be treated as an absolute minimum because there is evidence that in some cases several days are necessary before properties have stabilised. There must be a maximum storage period if results are to be representative of the unaged material and, again, the period quoted is somewhat arbitrary. There is obviously some difficulty in legislating for the storage period on a product when the date of manufacture is unknown but the standard wording makes a very reasonable attempt to cover this case.
It is also pointed out in ISO 23529 that these times do not necessarily apply for process control or for the evaluation of the effect of storage conditions.
Regardless of the time of storage, it is necessary that the rubber is not subjected during this period to high temperatures or other conditions likely to cause deterioration. These include ozone and other chemicals. There is a simple clause in ISO 13529 to cover this but most current test method standards take it rather for granted, and protection from light is the only condition normally mentioned. The actual temperature and humidity during storage are not critical as conditioning takes place afterwards, but sensible limits would be between 10 and 30°C and below 80% relative humidity. In addition, different rubbers must be separated such that there is no migration of constituents. Special attention needs to be given when the surface condition of the test piece is important, for example ozone or paint staining tests. BS ISO 2230^ is intended to cover the long term storage of rubber products and specifies 25^C and 70% RH maximum (65% for polyurethanes). It mentions all the factors likely to cause deterioration and makes the very valid point that the susceptibility to deterioration depends on the polymer type.

Conditioning and test atmospheres 53
2. CONDITIONING
Virtually all test methods specify a conditioning period, prior to test, in a 'standard atmosphere'. The terms atmosphere, conditioning atmosphere, test atmosphere and reference atmosphere, which are really self-explanatory, are defined in ISO 558^ ISO 554^ is a general standard specifying standard atmospheres but there is a separate standard which specifically covers temperatures and humidities for conditioning and testing rubber test pieces. This used to be ISO 471 but is now incorporated into IS023529^ The British standard is identical^ but apparently there is no separate ASTM conditioning standard.
The standard conditions are; (a) 23°C and 50% relative humidity, and (b) 27^C and 65% humidity, with the latter condition intended for use in tropical countries. Where control of temperature only is required, this is either 23^C or 2TC, and a further atmosphere where neither temperature nor humidity need be controlled is defined as 'prevailing ambient temperature and humidity'. A note drawing attention to the atmosphere 20°C and 65% relative humidity which was used for textiles is no longer included. The normal tolerances are ± 2°C on temperature and ± 10% on relative humidity; however, provision is made for closer tolerances, if required, of ± 1°C and ± 5% relative humidity. This is a welcome change from previous conditions when the standard humidity tolerances of ± 5% and ± 2% were unreasonable in that ± 2% is virtually impossible to achieve and ± 5% debatable. It should be noted that 20^C is the usual temperature for calibration laboratories although in most cases the three degree difference will not have a significant effect.
When testing is carried out at other than the normal ambient temperatures (see Section 3), conditioning would need to be carried out at the test temperature.
When both temperature and humidity are controlled, the standard conditioning time is a minimum of 16h, and where temperature only controlled at 23°C or 27°C, a minimum of 3h. At the sub-normal and elevated temperatures it is simply specified that the time should be sufficient for the test piece to reach equilibrium with the environment. Tables of approximate fimes required to reach equilibrium in both air and liquid media have been given^ for a wide range of temperatures and various test piece geometries, and a relevant selection of these is reproduced in an annex to the standard. Also, specific instructions are given in some test method standards.
Generally, 3h in air is more than sufficient to reach equilibrium at the normal temperatures of 23°C and 27°C whatever the test piece geometry. Usually, rather shorter times would be used at the sub-normal or elevated temperatures and it is important to note that, whilst a minimum time is

54 Physical testing of rubber
required, an excessive time at an elevated temperature may cause significant ageing before test.
It is generally assumed that humidity is not important in most rubber tests and, hence, conditioning in an atmosphere with control of temperature only is usually specified. However, control of humidity is considered necessary in certain cases, for example testing latex rubber and electrical tests. In many instances the 16h minimum conditioning period will not be sufficient for equilibrium to have been reached, especially with relatively thick test pieces. Hence, all that this conditioning can hope to achieve is to bring test pieces having similar dimensions into more nearly comparable conditions than they would otherwise be. To reach complete moisture equilibrium would in many cases take several days and for thicker test pieces probably weeks.
Inevitably there are certain special cases, for example after accelerated ageing tests ISO and British standards specify conditioning for between 16h and 6 days which is a stipulation akin to the minimum and maximum storage periods after vulcanisation. The 6 days maximum is on the basis that deteriorated samples may deteriorate further relatively rapidly. Evidence of this does not seem to have been published but there can be little doubt that after exposure to liquids the subsequent delay before testing will be critical because of drying or further chemical attack. This is catered for by specifying either testing immediately or after drying at 40°C and conditioning for 3h at 23°C. Another special case is where there has been preparation other than moulding, for example buffing or cutting. In the ISO tensile testing standard it is specified that testing shall be between 16h and 72h after buffing, which is based on the evidence of Morley and Scott who found that buffed test pieces show a gradual drop in tensile strength and elongation at break with time. Yet another exception is after mechanical conditioning when at least one standard specifies 16h to 48h between mechanical conditioning and testing. It becomes apparent that, despite standards for storage and conditioning times, it is essential to study each test method very carefully to ensure that the exact procedure specified is followed. In this context it should be noted that standards are not consistent as to whether the test piece is cut before or after the conditioning period. Although in most cases it would not matter which was done, there will be cases when the result could be affected.
In some ASTM test methods there is instruction to condition at the test temperature given under the test temperature clause. In recent methods there is reference to D618^ which is the practice for conditioning plastics. This seems like laudable cooperation between two standards committees but is very inconvenient as D618 is in another ASTM book.
ASTM also has a standard, D832^, covering conditioning for low temperature testing for which there is no international equivalent. This

Conditioning and test atmospheres 55
document explains the underlying theory of testing rubbers for the effects of low temperatures and gives advice on conditioning times.
3, TESTING CONDITIONS
The object of conditioning is to bring the test piece as nearly as possible into equilibrium with a standard atmosphere and it is reasonable that the test atmosphere should be identical with the conditioning atmosphere. ISO 23529 takes this for granted but there should be scope for allowing test pieces conditioned in one atmosphere to be tested in a less rigorous atmosphere in cases where the changes do not affect the results. The most common application of relaxing the testing conditions is after conditioning at 23°C and 50% relative humidity to test at 23°C without humidity control and this is perfectly sound practice if the test is performed relatively quickly. It is generally not sound practice to condition at subnormal or elevated temperature and then test at 23°C unless the test piece is very bulky and the test is made extremely rapidly.
Most testing is carried out in one of the normal standard atmospheres but ISO 23529 gives a list of preferred sub-normal and elevated temperatures. This list covering the range of interest for rubber testing is taken from the much wider range given in the general ISO document on preferred test temperatures ISO 3205^ . It should be noted that the tolerances given in ISO 23529 do not completely agree with those in ISO 3205, the tighter tolerances in the former reflecting the increased temperature dependence of rubber compared to many other materials. The preferred temperatures (°C) from ISO 23529 are:
-85; -70; -55; -40; -25; -10; 0; 40; 55; 70; 85; 100; 125; 150;175; 200; 225; 250; 275; 300 The tolerance for 40 to 100 is ±1^C and for the others ± 2 ^ . The equivalent list given in ASTM D1349^', Standard temperatures for
testing, is not identical, -75 being given instead of-70, -80; 150, 275 and 300 being omitted and 135 and 160 added. Also, the tolerance is ±2^C unless otherwise specified. D1349 has a slightly odd clause that conditioning and testing of materials known to be sensitive to variation in temperature or RH shall be carried out at 23±2^C and 50±5% RH. It seems like a half hearted attempt to include conditioning as there is no mention of 23^C without humidity control and it clearly does not apply to tests at non-ambient temperatures.
ISO specifies preferred durations of test for when tests are made as a function of time. These are logical enough, 8 and 16 hours, 1, 2, 3 and 7 days and multiples of 7 days. However, the logic for the tolerances given is

56 Physical testing of rubber
rather more difficult to appreciate as they are neither consistent in percentage terms nor what is readily achievable to minimize uncertainty. For example, the 2 hour tolerance on 24 hours exposure is more than 8%.
4. APPARATUS FOR CONDITIONING
It would not be appropriate to attempt to deal in any detail here with the specialist subject of environmental enclosures and air conditioning. However, considering the relatively small coverage of apparatus in standards such as ISO 23529, it is of value to discuss briefly certain aspects of the subject.
4.1 Air Conditioned Rooms
It is rather difficult to operate a rubber physical testing laboratory without air conditioning of the room in terms of temperature. Despite this, a vast number of laboratories do not have this facility, presumably on the grounds that the cost involved is too high. In fact, if the room is reasonably well isolated by doors, not made totally of glass and not of excessive size the cost of installing air conditioning for temperature control using self-contained cooling units is surprisingly low. Complete air conditioning of both temperature and humidity is inevitably more expensive and in most cases not necessary for rubber testing. Relatively few tests call for humidity control and when it is required it is usually possible to use humidity cabinets. Humidity is much more important for testing plastics. It is generally necessary to consult an expert when considering the installation of air conditioning but it is worth being sure that he appreciates that the tolerances must be maintained at all times and makes due allowance for the heat generated by laboratory equipment. Air conditioning engineers may not be used to circumstances where the occasional trip over specification limits is not permissible nor understand how much heat energy is emitted from apparatus in a testing laboratory. There was at one time a British Standard covering the design of controlled atmosphere laboratories but somebody decided it was no longer necessary and it was discontinued.
4.2 Enclosures
In principle the usual type of circulating air laboratory oven can be used for conditioning test pieces when temperature only is controlled. However, for temperatures near to ambient, enclosures equipped with cooling coils would be essential. If a cabinet has to be used it would probably be more

Conditioning and test atmospheres 5 7
convenient to use cabinets which also have the faciUty for the control of relative humidity.
Two types of humidity cabinet are in common use, salt-tray cabinets and the moisture-injection type. The salt-tray type of cabinet is very much the simpler of the two types being essentially a temperature controlled enclosure in which the humidity is controlled by the use of saturated salt solutions or other liquids. Despite the relative simplicity, such enclosures must be designed and operated with care if accurate conditions are to be realized. Much useful information will be found in ISO 483^^ which covers such cabinets for use with plastics, but is equally applicable to rubbers. In addition to saturated salt solutions, it describes the use of glycerol solutions and sulphuric acid solutions. It gives tables hsting suitable solutions to cover a range of humidities. At the condition of most interest, 23°C and 50% relative humidity, ISO 483 claims that a glycerol solution will achieve ± 5% if its refractive index is maintained between 1.444 ± 0.005 and ± 2% between 1.444 ± 0.002. At the time of writing this standard is in the process of revision with the main change being the correction of the figures for relative humidity above salt solutions to what are now generally accepted as the most reliable figures.
The rather more sophisticated injection type of humidity cabinet uses a humidity sensitive device to control the injection of moisture into the cabinet from a reservoir. Humidity levels are rather more easily controlled and changed with this type of apparatus and some types have the means to cycle both humidity and temperature in a prescribed manner, so extending the range of tests which can be carried out.
4.3 Hygrometers
Reference standards are usually dew point hygrometers but in equipment and enclosures capacitance/impedance instruments and the wet and dry bulb type are acceptable. The latter type, which often uses platinum resistance thermometers, should be used in conditions where air is circulating around the hygrometer at a velocity of not less than 3 m/s. Hygrometric tables for use with wet and dry bulb instruments are given in BS 4833^^ which also contains a bibliography. Simple hair or paper hygrometers can be useful because of their size and are relatively inexpensive; they are, however, very often inaccurate. It should be noted that the uncertainty of calibration of hygrometers is such that it is highly unlikely that a tolerance of ± 2% can be maintained and care is required to be confident of being within ± 5%.

58 Physical testing of rubber
4.4 Thermometers
The ordinary mercury-in-glass thermometer as covered by ISO 1770 '* is in such common use that it is rather badly taken for granted. In practice, much of the variability associated with testing at a set temperature can be traced to the misuse of thermometers. They should be calibrated frequently, carefully inspected for separation of the mercury, and immersed to the correct depth. The worst errors are usually found with low temperature thermometers and, hence, particular care should be taken when conditioning or testing at sub-zero temperatures. Precision thermometers are covered by ISO 653 - 656 ' ^ and there is a British standard for laboratory thermometers'^.
There are of course many types of temperature measuring instrument in use apart from the liquid-in-glass thermometer and the same principles apply as regards calibration and careful use. All laboratories use some form of portable "electronic" thermometer for most general purpose temperature measurements and various sensors are used in test equipment for temperature control. Platinum resistance thermometers are generally less rugged but more accurate than thermocouples and tend to be used in fixed situations, whereas most portable instruments use thermocouples. There are guides to selection and use of liquid in glass thermometers, resistance thermometers, thermocouples and radiation pyrometers in BS 1041 " , and an ASTM manual on the use of thermocouples^" .
4.5 Apparatus for Elevated and Sub-Normal Temperatures
Generally, conditioning at elevated or sub-normal temperatures indicates that the test will be carried out at that same temperature and, normally, will be carried out in the same enclosure as used for conditioning. That is, the conditioning enclosure forms part of the testing apparatus and is likely to take many forms depending on the nature of the test in question. Comment on the types of enclosure available is given in a RAPRA guide to test equipment ^ and the requirement for particular tests will be discussed in the relevant sections of this book. The ASTM publication on low temperature conditioning^ has been mentioned but there is also ASTM D3847^^ which advises on low temperature cabinets. Interestingly, it specifies ±1^C which does not agree with D1349.
In ISO, general directions for achieving both elevated and sub-normal temperatures for rubber testing is now included in ISO 23529. This advice is useful in that it lists the various types of chamber construction and heat transfer media which may be used and specifies a number of general

Conditioning and test atmospheres 59
performance requirements. It is not in any way a detailed document and much of its content is of an elementary nature. It does not specify tolerances on temperature control and it would seem unlikely that its publication will enable the apparatus sections of test method standards to be simplified.
5. MECHANICAL CONDITIONING
It is known, for example from the work of Mullins^ ' , that vulcanised rubbers containing fillers have their stress/strain curve semi-permanently changed when they are deformed. In particular, there is a reduction in the stiffness measured at any elongation below that to which the rubber has been previously stretched, as illustrated in Figure 5.1 Repeated stretchings produce successively smaller effects, indicating an approach to an equilibrium stress/strain curve. The effect is not permanent but recovery to the original stress/strain curve may be very slow, even at elevated temperatures.
This effect of pre-stressing is due to physical breakdown of some structure of the filler/rubber composite, its exact nature being unimportant as regards testing procedure. It is self-evident, however, that if a rubber during service is subjected to repeated deformations testing, should be carried out after prestressing rather than in the initial state where the result may be different due to the effect of the unstable structure.
Pre-stressing or mechanical conditioning takes place automatically in many forms of dynamic test but is very rarely incorporated into other test procedures. This is doubtless not due to ignorance but because mechanical conditioning is an inconvenience and the effect is probably not so important in quality control work. Attempts to incorporate mandatory mechanical conditioning into ISO standards have met with resistance for the reasons above and also because trials with certain particular tests have failed to produce evidence that the effect is large enough to be significant. One cannot help but feel that a more systematic study of the phenomenon covering a wide range of current test methods would be valuable.
There would be little to gain attempting to tabulate standards where mechanical conditioning has been included, but certain cases which have been given attention are worth noting. ISO 2856, General requirements for dynamic testing^^ suggests that dynamic measurements should only be made after at least six cycles at the maximum strain and temperature to be used in the test series have been applied to the test piece. It would be reasonable to assume that in many cases rather more than six cycles would be needed to approach equilibrium, but in any continuous dynamic test any changes would be self-evident. It is made clear that initial conditioning is applied to

60 Physical testing of rubber
remove irreversible structure, due for example to stresses built in during moulding.
1 \ 1 \ 1 1
/1 1 / 1 \
/ 1 \ / 9 \
L / ' J 1 / I \ 1 / ' 1 1 / ' 1 1 / ^ \ 1 y ' 1 1 / ' 1 1 X ' 1
/ 1 \ 1 # ' 1
/ I \ r / ' 1 1 # ' 1 1 / ' 1 1 X ' 1 1 /i 1 \
fi ' \ A ' / ' ' /' f \
A ' A ' 1 / / / ^ r /^ / 1
/ / / f / f
1 / ' A r / 1 I 1 / 1 *
/ ' ' / * 1 / I f
/ f '
/ 1 ' / t ! / f !
L / / ^A-400 J 1 / * 1
100 200 300 Elongation (%)
400 500
F/gwr^ 5-1, Stress/strain curves for carbon black vulcanisate showing effect of previous stretching. Solid line, before stretching; broken line, after stretching to elongation (%) shown
A 12 hour rest period is then suggested to allow reversible structure to reform before testing with at least 6 cycles being applied at each test condition before measurements are taken to allow reversible structure to reach near equilibrium. Testing should begin with the least severe conditions

Conditioning and test atmospheres 61
and proceed to the higher ampHtude and higher frequency. In the simplest form of dynamic test - rebound resiUence as covered by the Lupke pendulum in ISO 4662^^ - it is specified that impacts on the same spot are repeated between three and seven times so as to achieve a practically constant reading.
The effect of mechanical conditioning on low temperature testing is well illustrated by results obtained using the RAPRA dynamic low temperature tester^' where the test piece is slowly cycled in tension and the stress monitored. Figure 5.2 shows results for an SBR compound which illustrates the increasing effect of mechanical conditioning as the temperature is lowered.
50
^ 40| _l 3 Q o o o
3 0 h
20
-I5°C
6 8 10 CYCLES
Figure 5-2. Effect of mechanical conditioning on modulus at low temperatures
REFERENCES
1. ISO 23529, 2004. General procedures for preparing and conditioning test pieces for physical test methods.
2. BS ISO 2230, 2002. Rubber products. Guidelines for storage. 3. ISO 558, 1980. Conditioning and testing - Standard atmospheres - Definitions. 4. ISO 554, 1976. Standard atmospheres for conditioning and/or testing of test pieces. 5. BS ISO 23529, 2004. General procedures for preparing and conditioning test pieces for
physical test methods.

62 Physical testing of rubber
6. Brown R P and Hands D. RAPRA Members Journal, April 1973. 7. Morley J F and Scott J R. Journal of Rubber research, 15, No. 10, Oct 1946. 8. ASTM D618,2000. Conditioning plastics for testing. 9. ASTM D832, 1992(2001)sl. Conditioning for low temperature testing. 10. ISO 3205, 1976. Preferred test temperatures. 11. ASTM D1349, 1999. Standard temperatures for testing. 12. ISO 483, 1988. Methods for maintaining constant relative humidity in small enclosures by
means of aqueous solutions. 13. BS 4833, 1986. Hygrometric tables for use in the testing or operation of environmental
enclosures. 14. ISO 1770, 1981. Solid stem general purpose thermometers. 15. ISO 653, 1980. Long soHd stem thermometers for precision use. 16. ISO 654, 1980. Short solid stem thermometers for precision use. 17. ISO 655, 1980. Long stem enclosed scale thermometers for precision use. 18. ISO 656, 1980. Short stem enclosed scale thermometers for precision use. 19. BS 593, 1989. Specification for laboratory thermometers. 20. BS 1041-2.1, 1985. Guide to selection and use of Hquid in glass thermometers. 21. BS 1041-3,1989. Guide to selection and use of industrial resistance thermometers. 22. BS 1041-4, 1992. Guide to selection and use of thermocouples. 23. BS 1041-5, 1989. Guide to selection and use of radiation pyrometers. 24. ASTM MNL 12, 1993. Use of thermocouples in temperature measurement. 25. Brown R P (Ed.). Polymer Test Equipment and Services Directory, Rapra Technology,
2002. 26. ASTM D3847,2001. Directions for achieving subnormal test temperatures. 27. Mullins L. Trans. IRI, 23,280, 1948. 28. Mullins L. RABRM Research Memo R. 342, 1948. 29. ISO 4664,2005. Determination of dynamic properties - General procedure. 30. ISO 4662, 1986. Determination of rebound resihence. 31. Eagles A E and Fletcher W. ASTM Sp. PubHcation 553 Symposium Philadelphia, June
1973.

Chapter 6
TESTS ON UNVULCANIZED RUBBERS
Most of this book is concerned with tests on vulcanised (or thermoplastic) rubber, which is the state in which the consumer receives the product. The consumer is generally only interested in the properties of the finished product, whereas the supplier is also concerned about the properties of the raw and compounded rubber. His interest is in the control of his rubbers and rubber compounds as regards their processing qualities and the likehhood of them producing satisfactory mouldings, extrusions etc. Consequently, processibility tests are of immediate concern in the rubber factory and great emphasis has been placed on the development of methods and apparatus which provide reliable, and also very rapid, quality control data. The behaviour of rubbers during processing is complicated and has proved difficult to predict in many cases. Materials frequently managed to exhibit a processing quirk which did not show up in the laboratory tests. Hence, the aim has been to develop tests which more realistically predict processing behaviour.
Processibility is a particularly vague and ill-defined term but is taken to mean all aspects of material behaviour that contribute to the production of a satisfactory compound and forming it into a satisfactory product. The principal properties requiring measurement are viscoelastic flow behaviour and curing characteristics. Cure rate or, more generally, curing characteristics is a reasonably precise concept but viscoelastic flow behaviour is used here as a convenient term to cover plasticity, viscosity and other parameters which collectively are in fact 'processibility'. Plasticity measurements were the first processibility tests but, as it became apparent that the complicated flow behaviour of rubber demanded more searching tests of its viscoelastic behaviour, so the scope of tests was extended. A critical historical review, in chronological sequence, of the development of

64 Physical testing of rubber
processibility instruments has been given by White and Soos'. This puts the various developments into perspective and gives a fascinating insight into the progressive thinking and, on occasions, the bhnkered attitudes which have been involved.
1. STANDARD METHODS FOR PARTICULAR POLYMERS
A number of international standards have been published which give specific test mix recipes and evaluation procedures for particular polymers. These are recorded in references 2 - 1 1 and similar British and ASTM methods also exist. These standards refer to the general test methods and standard methods of preparation which are discussed below but include additional detail relevant to the polymer in question. They also include very limited testing on the vulcanisates. The main purpose of these standards is to provide a basis for comparison and evaluation of particular polymers as regards their processing and vulcanisation characteristics; their scope does not extend to the general physical properties of vulcanisates.
2. SAMPLE PREPARATION
Mixing and moulding have been considered under the general heading of preparation of test pieces in Chapter 4. Where compounded but unvulcanised rubbers are to be tested, the same standard mixing procedures will be relevant together with further details relevant to particular polymers, as referred to in Section 1 above.
Additionally, general preparation procedures have been standardised for the tests discussed in this chapter. ISO 1795^ gives simple instructions for taking a sample from selected bales or, where the rubber is in the form of chips or powder, taking the sample from the package. The sample is specified to be between 350 and 1500 g depending on the tests to be carried out and a note mentions that a surface layer my need to be removed if talc or a release agent is present.
A procedure for homogenising a sample of natural rubber by milling under specified conditions is given and test samples are taken from the homogenized material. The object of such sample preparation is to ensure that the sample is homogeneous and to get it into a suitable shape for test. Inevitably, this must involve working on the mill which will alter the characteristics of the rubber. The standard conditions given in ISO 1795 are intended to minimise as far as possible the effects of milling whilst giving a

Test on unvulcanized rubbers 65
satisfactory sample and, although other conditions may be equally suitable, it is essential that the same method is rigorously followed in comparative tests.
By weighing the first and last passes, the mill homogenization procedure is also use to measure volatile matter content. Samples are then allocated to such tests as are required in accordance with ISO methods. In particular, it is specified that volatile matter is measured according to the oven method of ISO 248'^. Apparently, we have two measures of volatile matter! Mooney viscosity and plasticity retention index are measured as discussed later in the chapter. Although the title and the procedure indicate that the method is intended for raw rubber, it is also specified that vulcanization characteristics are measured.
For synthetic rubbers, the mill homogenization is generally omitted, although it is specified as an alternative where the appropriate evaluation procedure requires it before measuring Mooney viscosity. Different conditions are given for specific polymers. The mill method of ISO 248 for determining volatile matter is specified but the oven method may be substituted if the material sticks to the mill rolls. Regardless of which volatile matter method is used, the mill procedure is required to dry samples for any chemical tests needed - unless this is not possible. To the uninitiated at least, this is not a model of clarity. Vulcanization characteristics are determined for synthetic rubbers, but not plasticity retention index.
ISO 1795 is mostly of use in connection with the evaluation procedure standards mentioned earlier but is debatable whether it has great value in the control of factory compounds.
The British standard is identical to ISO 1795. ASTM has two standards on sampling. 01485 " covers rubber from natural sources - natural rubber would have been more succinct. It has simple procedures for sampling bales, selection of sample size and estimation of percent defective plus a homogenization procedure in accordance with D3182. The sampling part clearly has very limited scope and the reference to D3182 (see Chapter 4) is curious as this standard is really about mixing and not homogenization. D3896'^ is the equivalent standard for rubber from synthetic sources (the rubber is synthetic not the source) and has the sampling content but no mention of homogenization.
3. VISCOELASTIC FLOW BEHAVIOUR
Plasticity can be defined as 'ease of deformation' so that a highly plastic rubber is one that deforms or flows easily. Viscosity is the resistance to plastic deformation or flow and, hence, the inverse of plasticity. It is defined as shear stress/shear rate. Unfortunately, the terms are often used
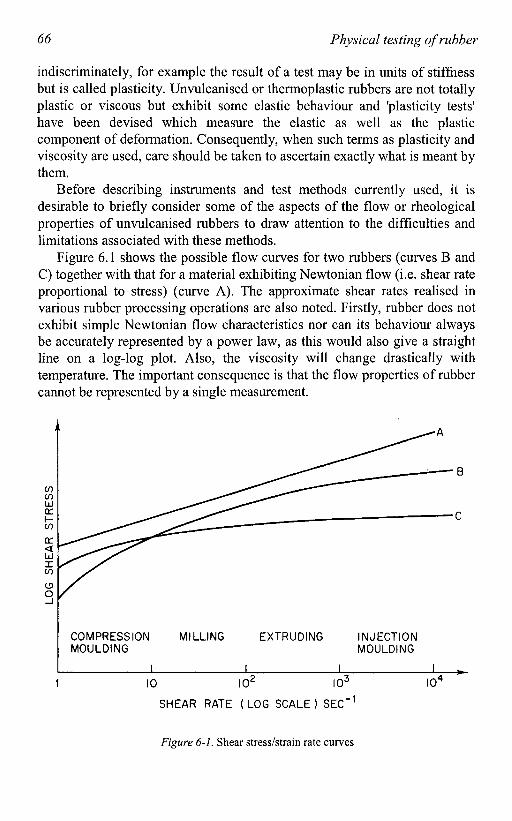
66 Physical testing of rubber
indiscriminately, for example the result of a test may be in units of stiffness but is called plasticity. Unvulcanised or thermoplastic rubbers are not totally plastic or viscous but exhibit some elastic behaviour and 'plasticity tests' have been devised which measure the elastic as well as the plastic component of deformation. Consequently, when such terms as plasticity and viscosity are used, care should be taken to ascertain exactly what is meant by them.
Before describing instruments and test methods currently used, it is desirable to briefly consider some of the aspects of the flow or rheological properties of unvulcanised rubbers to draw attention to the difficulties and limitations associated with these methods.
Figure 6.1 shows the possible flow curves for two rubbers (curves B and C) together with that for a material exhibiting Newtonian flow (i.e. shear rate proportional to stress) (curve A). The approximate shear rates realised in various rubber processing operations are also noted. Firstly, rubber does not exhibit simple Newtonian flow characteristics nor can its behaviour always be accurately represented by a power law, as this would also give a straight line on a log-log plot. Also, the viscosity will change drastically with temperature. The important consequence is that the flow properties of rubber cannot be represented by a single measurement.
^
CO CO UJ
CO
< LU I CO
O _l
^
COMPRESSION MOULDING
L_
MILLING EXTRUDING
J 1
INJECTION MOULDING
1
= B
C
J w 10 10 10 10-*
SHEAR RATE (LOG SCALE) SEC"^
Figure 6-1. Shear stress/strain rate curves

Test on unvulcanized rubbers 67
Furthermore, any measurement of flow properties should be made at the shear rate of interest. In the example, rubber B has a lower shear stress at low strain rates but has the higher stress of the two at very high rates. The shear rates encountered in rubber processing operations can be very high (10" sec' ) whereas many conventional plasticity tests operate at much lower rates (roughly in the range 0.0025 to 1 sec'^). A plasticity test operating at a shear rate of less than 1 sec" is quite likely to yield results which do not correlate with injection moulding behaviour.
Filled rubbers can undergo profound changes in plasticity as a result of storage or of deformation. Storage leads to the formation of filler-filler and filler-rubber 'structure' which is more or less broken down by subsequent deformation. During processing the 'structure' will be broken down by the rapid shearing and considerable heat generated. Even if a laboratory test applies sufficient rapid shearing to break down the structure there may be difficulty in dissipating the heat quickly.
It is clear that to get an accurate idea of how a rubber behaves in the nip of a mill or the die of an extruder is a difficult problem which has not been solved by the traditional plasticity tests. Hence, these tests have mostly been used as a check on the uniformity of repeat batches. As Figure 6.1 shows, even this may not be satisfactory as no difference in behaviour under the test conditions does not mean that there is not a difference under processing conditions. Fortunately, in practice repeat batches of basically very similar materials do not yield intersecting flow curves. It becomes clear that to obtain improved correlation with processing behaviour in service it is necessary to use tests which involve increased shear rates and/or consideration of the elastic as well as the plasfic component of stress.
3.1 Compression Plastimeters
The principle of the compression plastimeter is very simple - the test piece is compressed between parallel plates under a constant force and the compressed thickness measured. This simplicity accounts for the early adoption of this type of instrument and its subsequent continued popularity. The work of Williams^^ led to the first widely used parallel plate instrument and eventually to various modified forms all working on the same principle. Apart from simplicity, the compression principle has no real inherent advantages but a number of disadvantages:
(a) The shear rates produced in the rubber are low, usually below 0.1 sec'* although somewhat higher (up to almost 1 sec"*) in the so called rapid plastimeters.
(b) The rubber is not deformed sufficiently to break down any structure effects in black reinforced materials.
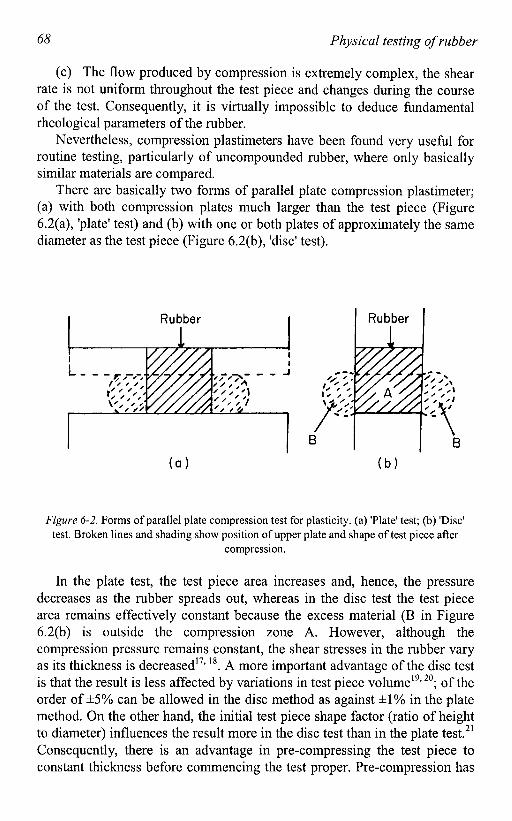
68 Physical testing of rubber
(c) The flow produced by compression is extremely complex, the shear rate is not uniform throughout the test piece and changes during the course of the test. Consequently, it is virtually impossible to deduce fundamental rheological parameters of the rubber.
Nevertheless, compression plastimeters have been found very useful for routine testing, particularly of uncompounded rubber, where only basically similar materials are compared.
There are basically two forms of parallel plate compression plastimeter; (a) with both compression plates much larger than the test piece (Figure 6.2(a), 'plate' test) and (b) with one or both plates of approximately the same diameter as the test piece (Figure 6.2(b), 'disc' test).
Figure 6-2. Forms of parallel plate compression test for plasticity, (a) 'Plate' test; (b) 'Disc' test. Broken lines and shading show position of upper plate and shape of test piece after
compression.
In the plate test, the test piece area increases and, hence, the pressure decreases as the rubber spreads out, whereas in the disc test the test piece area remains effectively constant because the excess material (B in Figure 6.2(b) is outside the compression zone A. However, although the compression pressure remains constant, the shear stresses in the rubber vary as its thickness is decreased^ ' ^ . A more important advantage of the disc test is that the result is less affected by variations in test piece volume^ ' ; of the order of ±5% can be allowed in the disc method as against ±1% in the plate method. On the other hand, the initial test piece shape factor (ratio of height to diameter) influences the result more in the disc test than in the plate test. ^ Consequently, there is an advantage in pre-compressing the test piece to constant thickness before commencing the test proper. Pre-compression has

Test on unvulcanized rubbers 69
another advantage in that the thinner test piece can be brought to the test temperature more quickly and this is the basis of the various 'rapid' plastimeters.
The basic compression plastimeter principle can be modified by measuring the force required to compress the test piece to a given thickness in a given time. This was the principle adopted in, for example, the Defometer and it has the advantage that this force is proportional to the effective viscosity of the rubber under the conditions of test, although this viscosity is an average for the range of shear rates throughout the rubber.
ISO 2007^^ specifies a rapid plastimeter procedure using an instrument with one platen either 7.3, 10 or 14 mm diameter and the other platen 'of larger diameter than the first' (i.e. disc type method). The size of the first platen is chosen such that the measured plasticity is between 20 and 85. The test piece is cut with a punch which will give a constant volume of 0.40 ± 0.04 cm, the thickness being approximately 3 mm and the diameter approximately 13 mm. The test piece is pre-compressed to a thickness of 1 ± 0.01 mm within 2 sec and heated for 15 sec. The test load of lOON is then applied for 15 sec when the test piece thickness is measured. The usual temperature of test is 100°C and the result is expressed as the thickness of the test piece at the end of the test in units of 0.01 mm and called the 'rapid plasticity number'. The Wallace rapid plastimeter, and presumably other commercial instruments, conform to this specification but it would be sensible to check with the manufacturers. A technically identical method is given in BS 903:Part A59^l
ISO 7323 " specifies a parallel plate test based on the Wilhams plastimeter with plates 4 cm in diameter. The test piece is 2.00 ± 0.02 cm^ in volume and can conveniently be a cylinder 16 mm diameter and 10 mm thick. As discussed above, a close tolerance on volume is necessary for this type of plastimeter. The test piece is preheated for 15 min (the temperature of test is usually 70°C or 100°C) and compressed under a force of 49N. The thickness of the compressed test piece is measured in mm and this value multiplied by 100 quoted as the plasticity number. The preferred time of application of the force is 3 min. The correction to the standard in 2003 was to change the tolerance on the force from 0.05N to 0.5N.
The ISO method also gives a procedure for measuring the recovery of the test piece after removal of the load. The height of the test piece is measured after Imin recovery at the test temperature. The 'recovery value' is reported as the difference between plasticity number and recovered height multiplied by 100.
ASTM D926^^ gives similar methods to ISO 7323 but has two recovery procedures. In procedure A the test piece is removed from the plastimeter and allowed to recover. In procedure B the test piece is compressed, not

70 Physical testing of rubber
under a fixed load, but to a fixed height of 5 mm for 30 sec. It is then allowed to recover for 5 min at the test temperature and its height measured. The recovery value is in this case the increase in height above the 5 mm in multiples of 0.01 mm.
The measurement of recovery is intended to be a measure of the elastic component of softness but it is rather debatable whether the strain rates and recovery times in the ISO and ASTM procedure yield results relevant to processing conditions. Recovery at room temperature as in procedure A of ASTM must be liable to lead to variable results.
It is an interesting example of usage in different countries that there is no British standard for the Williams type parallel plate but no ASTM for the rapid type instrument.
Koopmann^^ adopted the Defo compression test to produce figures for viscosity, shear rate dependence, elasticity (recovery) and a coefficient of elasticity representing the shear rate dependence of the elastic behaviour. His procedure is based on compressing several test pieces under different loads followed by recovery for the same length of time, yielding curves for both the loading and recovery phases of test piece height against time. The shear rate dependence coefficient is calculated on the basis that, at the shear rates of the test, a power law relationship was sufficiently closely followed for the raw rubber tested. By repeating the compression and recovery sequence on the same test piece he also deduced a rheological fatigue factor.
More modem versions of the Defo test have vacuum preparation of the test piece and computerised control but although they measure both the viscous and elastic components, it is still a compression test at low shear rate. Isayev et al ^ described an instrument and method to discriminate between materials by measuring the elastic recovery at very short times.
ASTM has, in addition to the parallel plate method of D926, standardized a development of the Defo test in DIN 53514 which is designated D6049^ .
The use of a parallel plate plastimeter to determine both softness and recovery is a simple way of obtaining a measure of both the viscous and elastic components on deformation behaviour, albeit under conditions somewhat removed from those met during processing. An alternative approach is to measure the stress relaxation in a test piece and this was the basis of the Stress Relaxation Processibility Tester developed at RAPRA.
The SRPT and its operation has been described by Norman^^ and examples of its application also given by Berry and Sambrook, ^ and Leblanc.^' Amsden^^ has given a description, examples of use and a comparison with other plastimeters. It uses the same test piece as in the Wallace rapid plasticity test and is perhaps best thought of, as presented by Amsden, as a very superior type of compression plastimeter. The principle of a stress relaxation measurement is given in Figure 6.3. Despite the

Test on unvulcanized rubbers 71
attributes of being rapid, automatic, using a small test piece and giving a measure of the viscoelastic response as well as viscosity it did not become popular.
LOAD APPLICATION TIME
REFERENCE STRESS
TIME
Figure 6-3. Principle of stress relaxation test
3.2 Plasticity Retention Index
Most ageing tests are carried out on vulcanised or thermoplastic compounds, but there has been a need to assess the oxidative effects of storage on natural rubber. Various accelerated procedures using ovens or infra-red lamps have been used with visual assessment of deterioration. A more satisfactory procedure based on the measurement of plasticity after oven ageing has been standardised as ISO 2930^^ and the result is known as the plasticity retention index.
The plasticity measurements are made before and after ageing with a parallel plate compression instrument in accordance with ISO 2007 . Very close control of temperature is required (±0.2°C) together with a defined rate of air throughput and specially designed ovens are used. ±0.5°C is allowed if

72 Physical testing of rubber
the closer tolerance cannot be achieved but it is made clear that it will increase uncertainty Test pieces are aged at 140°C for 30 ± 0.25 min and cooled to room temperature before making the plasticity measurement. The plasticity retention index (PRI) is calculated from:
Pi?/ = ^ x l O O
where Pa= aged plasticity number and Pua = unaged plasticity number The same method is given in BS 903 Part A59^^ and in ASTM D3194^1
In the ASTM standard, the procedure for rapid plasticity measurement is given as there is no ASTM equivalent of ISO 2007 to reference, and only the larger tolerance on oven temperature (±0.5°C) is specified, hence greater variability is allowed.
Bonfils et al ^ considered the kinetics of thermal oxidation in the plasticity test and found that the order of the reaction was different for short and long times of ageing.
3.3 Rotation Plastimeters
A number of plastimeters of this type have been used for rubbers, often for research purposes, but one instrument, the Mooney viscometer, gained virtually universal acceptance and has been extensively used for routine quality control purposes for several decades. The principle of the Mooney is shown in Figure 6.4 together with several other possible geometries for a rotational instrument. The rotor turns at a constant rate inside a closed cavity containing the test piece so that a shearing action takes place between the flat surfaces of the rotor and the walls of the chamber. The torque required to rotate the rotor is monitored by a suitable transducer.
The Mooney viscometer is standardised in ISO 289-1^^. The rotor and cavity dimensions are defined, as are anti-shp grooves on both the rotor and cavity walls. The angular velocity of the rotor is specified as 2 ± 0.02 rev/min and a heating device is required to keep the dies within ± 0.5^C of the test temperature. Either pneumatic or hydraulic means of closing the cavity are used providing a closing force of 11.5 ± 0.5 kN during the test. The torque indicating device is calibrated in Mooney units such that 8.3 ± 0.02 Nm equals 100 units.
The test piece is formed by two discs of rubber about 50 mm in diameter and thickness about 6 mm sufficient to completely fill the die cavity. One of the discs is pierced to permit the insertion of the rotor stem. For uncompounded rubbers reference is made to ISO 1795* and for compounded materials to ISO 2393 (see chapter 4) and the material standard

Test on unvulcanized rubbers 73
relevant to the rubber. It is stressed that Mooney viscosity is affected by the method of preparation and conditions of storage prior to test.
^ M I ^ Kf VA \ VA xA
m B nA AY^
I II I II I I I
m'////////////////////////Mi
r/////////^
(c)
Figure 6-4. Rotation plastimeter geometry, (a), (b) and (c) Coaxial cylinder types; (d) and (e) concentric disc types ((d) is the Mooney geometry). A is usually the stator and B the rotor, C is the rotating shaft and r is the cylinder radius (much larger than the clearance between A and
B). xy indicates the mid-plane along which the chamber can be opened for filling.
It is usual to allow 1 min for heating the rubber before starting the motor but this is not actually sufficient to reach equilibrium and longer heating times may give better agreement between viscometers of different construction. No preferred time after starting is specified for reading the Mooney viscosity as this is chosen to suit the viscosity/time curve encountered; but commonly 4 min is suitable for many materials and 8 min for butyl.
Typically a Mooney viscosity would be expressed as:
50ML(H-4)100°C
Where 50M is the Mooney viscosity, L indicates the use of the large (i.e. standard) rotor, 1 is the preheating time in minutes, 4 is the reading time in minutes and 100°C is the test temperature.

74 Physical testing of rubber
The measurement of pre-vulcanisation properties is given in ISO 289-2^^ This is essentially a matter of running a test on a fully compounded material (including curatives) as in ISO 289-1 until the viscosity reaches a specified number of units above the minimum (usually 5 units). The time to this point is designated as the scorch or pre-vulcanization time. The temperature of test is chosen to suit the process in question.
Essentially the same methods are given in BS 903 Part A58^^ and ASTM D1646^ . The ASTM standard says that the main difference from ISO 289 Parts 1 and 2 is that 289 does not provide for sample preparation on a mill -in fact it does give this option. The reference for sample preparation in D1646 is to D3182 (see Chapter 4) which is for mixing and not homogenizing. With a similar reference in ISO 289, one suspects that it was revised to come in line with the ASTM but ASTM D1646 has not yet picked up on this.
The Delta Mooney (A Mooney) test is an extension of the Mooney used on empirical grounds as a general indication of processibility for non-pigmented oil extended emulsion styrene/butadiene rubber. It quantifies the changes that occur in Mooney viscosity with time, either as the difference between viscosities recorded at two specified times or as the difference between the minimum viscosity recorded immediately after the commencement of the test and the subsequent maximum viscosity. Several alternative Delta Mooney values are defined depending on the times, whether minimum/maximum viscosity difference is used and whether or not the sample has been massed on a mill. Procedures for Delta Mooney are standardised in ISO 289-3^^ BS 903 Part A58-l^^ and in ASTM D3346^l
It is a little surprising and even disturbing to find attention being devoted to the sources and elimination of considerable differences in results obtained by different laboratories several decades after the instrument was introduced. Investigations have been reported by Kjramer'*' ' ^^ Niemeic" ^ and Crane and Ness. ^
Kramer found differences of up to 11 MU between 12 laboratories, which he attributed partly to failure to comply with the standards instructions and partly to vagueness on the part of the standards. In a second trial with selected laboratories and in which the test instruments were subjected to physical analysis, he found a difference of 4.6 MU which he considered mainly due to differences in test piece temperature.
Niemeic discusses in detail the factors which can contribute to variability, which could be considerable, but concludes that at least for a butyl rubber with 8 minutes running time it is possible to get agreement to within ± 1.5 MU with strict control of all factors. The improvement in reproducibility which can result from vacuum compacting instead of sample

Test on unvulcanized rubbers 75
preparation on a mill has been illustrated' ^ Noodermeer et al" ^ similarly found improvements by omitting the mill massing stage.
Nakajima and Hamel ^ have derived expressions for calculating shear stresses from the Mooney torque values to give viscosities in agreement with those obtained from other instruments, and also an expression to correct for the edge effects. ^ Bristow^^ derived non-standard Mooney parameters for natural rubbers to improve the distinction between different grades.
The main advantage of rotation plastimeters over compression instruments is that shearing at constant rate can be continued for as long as required so that thixotropic or structure effects can be studied. Rather higher shear rates are possible, although the Mooney operates at only about 1 sec" (the shear rate varies across the diameter of the rotor). A practical difficulty is to avoid slippage of the rubber over the metal parts and this is why the Mooney operates with a positive hydrostatic pressure and has grooves cut in the metal surfaces.
Another problem, which limits the shear rates that can be used, is the heat generated during shearing. Calculated and measured temperature rises^^ indicate that at 10 sec' the thickness of rubber must be no more than 1 mm to keep the equilibrium rise to 1°C. Piper and Scott " used a bi-conical shaped rotor which operated at 10 sec" and the apparatus of Bulgin and Wratten^^ with a clearance variable down to 0.25 mm could operate at up to 100 sec'\ Ghafouri and Freakley^^ devised a procedure for predicting the temperature rise in a bi-conical rheometer. Han et al ^ studied the effect of different metals and surface characteristics used for bi-conical rotors. A TMS rheometer has been used to assess mould release^ . The shearing cone geometry has the advantage over the Mooney disc-type that, with suitable design, the shear rate is fairly uniform rather than varying from zero at the centre to a maximum at the periphery of the rotor.
An alternative geometry to the shearing disc (or shearing cone) type of rotation viscometer is the coaxial cylinder type (Figure 6.4). The inner cylinder can rotate inside the outer cylinder or the inner cylinder could be the stator. Such a geometry gives a substantially uniform shear rate in the annulus of rubber provided the clearance between rotor and stator is very small in comparison with the inner cylinder radius. Coaxial cylinder types have proved valuable for research purposes but there is a practical difficulty of maintaining the hydrostatic pressure without introducing friction by the device used to close the gap. Sealing around the rotating shaft in the Mooney is relatively easy because frictional force on the shaft contributes little to the total torque.
Yet another geometry is the cone and plate viscometer. This generally operates without a positive hydrostatic pressure and, although often used for plastics melts, is not suitable for rubbers because of excess slipping.

76 Physical testing of rubber
In principle it is possible to extend the use of rotation plastimeters to measure elastic recovery by monitoring the stress relaxation after stopping the rotor, but this is difficult because of friction in the system. Attempts were been made with the Mooney, ' ^ the shearing cone viscometer^^ and the apparatus described by Moghe, which was the original Goodrich Dynamic Stress Relaxometer^^. More recent versions of the Mooney ' " ' ^ have improved the accuracy and reproducibility of the technique such that measuring the elastic as well as the viscous component can be more widely taken advantage of for routine control. Male^^ has suggested that time to 80% decay is a candidate for specification testing for processability of SBR materials.
With reliable instrumentation available, a stress relaxation procedure was eventually standardized as ISO 289-4^ . The normal Mooney apparatus has, in addition, to be capable of being stopped within 0.1 s, resetting zero torque for a static rotor and recording the torque every 0.2 s. The decay of torque with time is plotted on a log-log scale and the slope of the resulting line taken as the Mooney stress relaxation rate. The British standard, BS ISO 289-4 is identical and ASTM 01646" ^ has the same procedure.
Another variation possible with a modem instrument is to make tests at different rotation speeds and, hence, different shear rates.
3.4 Extrusion Rheometers
In the extrusion or capillary rheometer, rubber is forced through a small cylindrical die under a known pressure and the volume extruded in a given time measured (or at a constant rate and the pressure measured). It is, therefore, rather similar in action to extruders used in the factory.
It is apparent that the first advantage of the capillary rheometer is that it simulates to some extent the processing operations of extrusion and injection moulding. Apart from this, it has the important advantage that much higher shear rates are possible than are normally obtainable in compression or rotation instruments. The shear rate can be comparable with those encountered in processing but heat build-up is not a great problem because passage of the rubber through the die is very rapid. However, the short period of shearing is insufficient to break down thixotropic structures completely.
Some of the earliest plastimeters were of the extrusion type but, despite the advantages mentioned, none become anything like as popular as the Mooney, and even now they have not been favoured by international standardisation. However, in more recent times it was increasingly realised that, to obtain rheological data relevant to processes such as injection

Test on unvulcanized rubbers 77
moulding, measurements must be made at the higher shear rates obtainable with extrusion instruments, and in consequence their use increased.
Basically, capillary rheometers are quite simple instruments but many of those on the market have been made sophisticated, and hence expensive, both in respect of the arrangements for applying pressure and controlling temperature and by the addition of microprocessors. The so called Monsanto Processibility Tester had a pressure transducer at the entrance to the orifice, a microprocessor system and a laser device allowed the measurement of viscosity, die swell and stress relaxation. Applications of the instrument have been given, for example, by Leblanc^^ Pica et al ^ and Sezna.'' More recently, Leblanc^^ has compared a high pressure capillary rheometer and a new instrument with pre-shearing capability where he demonstrated some of the problems of measurements on filled rubbers. Liang'' has considered the pressure oscillation phenomenon with natural rubber/polybutadiene blends and the conditions for wall slip.
There is no relevant ISO standard but ASTM D5099^^ covers the measurement of processing properties using capillary rheometers. Very usefully, it gives the terminology and mathematical relations for capillary flow of rubber, including the Rabinowitsch and Bagley corrections. Two methods are specified, the piston capillary rheometer and the screw extrusion capillary rheometer. An obvious distinction between the two types of rheometer is that in the screw extrusion instrument substantial shearing takes place just before extrusion. The piston instrument is quite loosely defined but the two dies to be used are specified in detail. The screw extrusion instrument is basically a laboratory extruder with barrel diameter between 19 and 31.7 mm and length/ diameter ratio between 10:1 and 20:1 equipped with a capillary die. The same dies as for the piston instrument are specified.
Small instrumented extruders, which are available commercially, are also used in the laboratory to measure extrudibility. The best known special die is the Garvey die " shown in Figure 6.5 which was designed to show up typical faults that can occur in a mix with poor extrusion characteristics. This die has a cross section including an acute-angled wedge portion (X in Figure 6.5).
A method of test for extrudibility using a screw type laboratory extruder and a Garvey die is given in ASTM D2230^^ The extruder has a 50 mm or less diameter screw, a length/diameter ration of 5:1 or greater and compression ratio of 1:1. Suitable conditions for extrusion are determined with a standard compound and then applied to a similar test material. Two systems are given for rating materials by assigning either four digits or a digit and a letter to such characteristics as surface, sharpness of the 'edge' X,

78 Physical testing of rubber
the two 'comers' Y and Z, and cross-sectional dimensions (die swell). The ratings are given in a series of photographs.
Figure 6-5. Cross section of the Garvey die
3.5 Mixing Machines
A very different approach to measuring 'processibility' is to use what is effectively a small scale internal mixer and to monitor the torque required to turn the rotors, which gives a measure of the effective viscosity. Such instruments (torque rheometers) are perhaps most appropriate in estimating mixing behaviour and have been used more for plastics than rubbers. Commercial instruments are available, for example the Brabender Plasticorder. The potential advantages of these instruments are the similarity of their action to full-scale mixing or extrusion equipment together with being able to operate at shear rates appropriate to factory operations. However, because of the difficulty of matching exactly the range of shear rates etc. which exist in full-size plant, successful scaling-up of the results may not be straightforward.
Markert ' ^ has described the use of the Plasticorder where torque and corresponding temperature of the mix are monitored. Plots of torque against reciprocal of temperature yield a family of straight lines for different rotor speeds, and plots of the temperature dependence against integrated torque

Test on unvulcanized rubbers 79
show very distinctive behaviour for different materials. Chohan et af constructed an apparatus specifically to study dispersive mixing and Graf et af modified an injection moulding machine to obtain processability data under essentially production conditions. More recently, an article^^ considered how results from a torque rheometer could relate to problems in elastomer processing, but this approach is not in very common use.
3.6 Dynamic Stress Strain Measurement
Dynamic mechanical analysers, as discussed in chapter 9, can be constructed so that they can be used with unvulcanised materials and, hence, the in phase and out of phase components of modulus and the loss angle measured. The usual test piece geometries for cured rubbers are not convenient for the uncured materials where some form of oscillating shear is probably the best approach. This is the geometry used in cure meters discussed in the next section and such instruments have formed the basis for apparatus which measures dynamic properties from before and through the curing process.
The Rubber Process Analyser from Alpha Technologies is perhaps the best known of this type of instrument^ ' . It uses the rotorless oscillating die principle and a range of applied strains, frequencies and temperatures can be scanned. Essentially, developments of the oscillating die curemeter have resulted in merging of curemetering and measurement of viscoelastic behaviour of materials before cure. For convenience, the measurement of processability using oscillating die instruments will be considered in the curemeter section (Section 4).
3.7 Other Processibility Tests
In processing operations, the deformation of the rubber is largely in shear but there are circumstances where elongation deformation is important. Elongational flow measurements, in which a sample is stretched in uniaxial tension at a constant strain rate, have been reported by several workers. Useful discussions of this type of measurement have been given by Denby^ , White^^ Gotten and Thiele^^ and Ng^l Clarke and Petera^^ used a bell-mouthed die to produce elongational strain and derived an equation to calculate elongational viscosity from a plot of pressure drop against a function of die length.
Mention was made above that oscillating die curemeter based instruments are now widely used for obtaining measures of processability. In fact, the other types of curemeter considered in Section 4, oscillating disc.

80 Physical testing of rubber
rotorless and reciprocating paddle types, are forms of plastimeter which measure plasticity before the onset of, as well as during, cure.
Various other mechanical tests are possible. Indentation or penetration by a plunger under load as in the Vicat test for plastics could be applied to unvulcanised rubber; the so-called Humboldt Penetrometer worked on this principle, and it has been claimed that reproducible plasticity measurements can be obtained with a spring-loaded durometer V An Indentation method using a needle has been described by Kusano et a P and details of a Russian dynamic penetration method were circulated to ISO TC 45 (although it was not progressed). Such methods would be limited to low shear rates and the test would be too short to break down filler structure. Higher shear rates could be obtained by using a rebound resilience test although, again, the time scale is too short to break down filler structure. Yoshida used the Schob pendulum for this purpose^ .
Barres and Leblanc " have described the construction and use of a sliding cylinder rheometer which operates at very low shear rates and was intended for studies on structure development in filled systems rather than simulating processing flow.
The use of dielectric constant has been suggested as a processability measure^ . It was found that for carbon black filled compounds the dielectric constant decreased with mixing time to reach a steady level which was deemed to indicate when sufficient mixing had taken place.
3,8 Correlation between Plastimeters
With a number of plastimeters in common use, it is inevitable that there is a demand to know the relationship between the readings obtained with them. From the foregoing discussion emphasising the dependence of plasticity results on the shear rate and other conditions of test, it must be clear that the question is not really a sensible one. Any relationship found between two different instruments can only be valid for the compounds used and the particular conditions of test, simply because the flow properties of rubber cannot be defined by a single parameter. Many workers have studied and published correlations between various types of plastimeter, often to show that they do not agree and to illustrate the superiority of the instrument which supposedly agrees best with processing behaviour. Several comparisons are included in the literature already noted and other examples are shown in Figure 6.6. Figure 6.6a shows the relatively close correlation obtained between two compression instruments, the Wallace rapid and Williams plastimeters, for materials of similar flow characteristics (plasticised natural rubber). When such rubbers are compared on two basically different instruments (compression and extrusion) the

Test on unvulcanized rubbers 81
correlation is less good (Figure 6.6b). A similar degree of scatter is shown in Figure 6.6c where a variety of tyre tread and carcase mixes are tested on another pair of basically dissimilar instruments. Similar correlations between Mooney and Rapid Plasticity have been given by Bristow^^ who demonstrated that correlation is improved if initial Mooney values are used.
50
40
S. 30'
20
10
^ L^
(a)
J^'
y 4
i 1
X
„. I. L 200 300
Williams 400
o
50
40
30
2ol£
(b) . • > ^
.:yf •
1 2 3 EKtrusion (time)
70
60
50
40
30
" (c)
-
X • • ., •
t^" • i X X X 1
X
• X V • ^x •
^ . » % •
1
40 50 60 Mooney
500 Defo (gf)
1000
Figure 6-6. Correlations between readings of various plastimeters. Rapid = Wallace rapid, compression, disk type; Williams = compression, plate type; Extrusion = Griffiths (1926);
Defo = compression, disk type.
Baader has published curves showing how the relationship between readings on the Mooney viscometer and a compression (Defo) test varies according to the type of material tested and has also studied^ ' ^ the correlation of Defo with Williams parallel plate compression results. Figure 6.6d gives the calculated relationship between two compression tests (Defo and Wallace rapid) obeying the relation: shear rate proportional to (stress)", (an oversimplified representation of the flow of rubber) and serves to show

82 Physical testing of rubber
how widely the relationship can vary with the characteristics of the material tested, even when both instruments are of basically the same type. Kandyrin et al ^ compared results from a Mooney viscometer with viscosity determined on a gas capillary viscometer and with melt flow index measurements and derived relationships for the rubbers tested.
Mooney, Defo, Williams and Wallace Rapid instruments were compared by Brezik^ ^ whilst Ng ^ attempted to correlate extensional rheometer results with Mooney and Defo values. Lim and Ong * found Mooney to give good prediction of die swell measured in a capillary rheometer and Popovic et al " gave a mathematical relationship between Mooney and capillary rheometer viscosity.
Breemhaar et al ^ give an interesting account of a collaborative exercise where a number of processability tests, including dynamic properties and capillary rheometry, were compared by different laboratories for a range of rubbers. They conclude that it is unrealistic to expect one test to be able to include all aspects of processability for all rubbers, which is perhaps one way of saying that 'there are horses for courses'. Kramer and Schenetger ^^ similarly looked at a number of processability tests for a pair of polychloroprene compounds differing in elasticity. They found that die swell and mill shrinkage gave the same information as loss modulus, but tan 5 and Mooney and Defo relaxation did not give the expected answers.
4. SCORCH AND CURE RATE
If a fully compounded thermosetting rubber is subjected to a plasticity measurement at a high enough temperature and for long enough, it will cure and, consequently, there is not always a clear distinction between a plasticity test and a test for scorch or rate of cure. For example, the Mooney viscometer is used to measure scorch, i.e. the onset of vulcanisation, and an oscillating disc rheometer will measure the plasticity of the compound before the onset of cure as well as the increase in stiffness as curing takes place.
Tests for scorch and rate of cure should be distinguished from tests for degree of cure or optimum cure measured on the vulcanised material. The latter type of test estimates degree of cure by measuring the physical properties of test pieces vulcanised for various times, tensile properties, swelling and set measurements being the parameters most commonly used.
The most obvious changes in a rubber mix when vulcanisation sets in are an increase in stiffness and an increase in the elastic component of its viscoelastic deformation. In addition, the ease of solution in common rubber solvents decreases and this has been used with some success as a very

Test on unvulcanized rubbers 83
simple, if rather crude and not very convenient, test for natural rubbers. The method is not successful for reinforcing black-filled mixes, for example, because these will not dissolve readily even when not scorched and, for synthetic rubbers, a range of solvents would be necessary.
In the past, parallel plate compression plastimeters have been quite widely used for measuring rate of cure and methods have been standardised. The test pieces are heated for various times and then tested in the plastimeter. The change in plasticity or recovery or some combination of these, is then plotted against time of heating to give a 'scorch curve'. An even more time consuming procedure was to measure tensile properties as a function of cure time.
The Mooney viscometer offers a more convenient way of measuring scorch and even rate of cure, and a standard method for scorch is given in ISO 289-2^^ and the BS and ASTM equivalents^ '' ^ as mentioned in Section 3.3 of this chapter. This is essentially the method of ISO 289-1 continued until the viscosity reaches a specified number of Mooney units above its minimum value, either 5 or 3 units depending on whether the large or small rotor is used. The minimum viscosity and the time to reach 5 or 3 units above minimum viscosity are reported. In earlier versions of this test the difference between times to 5 units and 35 units above minimum viscosity was taken as an indication of the rate of cure, but this measure of cure rate is now been superceded.
Laboratory measurement of curing characteristics was revolutionised by the introduction of so-called 'curemeters' in the middle of the last century, which quite rapidly became almost universally used for the routine control of fully compounded rubbers. These instruments were so successful that the use of the Mooney to measure scorch and the need for routine measurement of physical tests on moulded test pieces has been much reduced.
For a considerable period there were basically two types of curemeter in common use: the reciprocating paddle type, as for example the Wallace-Shawbury Curometer and the first Vulcameter, and the oscillating disc type such as the Monsanto Rheometer. In the reciprocating paddle type, a small paddle embedded in the rubber, which is itself enclosed in a heated cavity, is reciprocated. Either the change in amplitude of oscillation at constant force or the change in force to produce constant amplitude is monitored as a measure of change in stiffness. In the oscillating disc type, a bi-conical disc is embedded in the rubber in a closed cavity rather in the manner of the Mooney. The disc is oscillated through constant angular displacement and the torque required monitored (Figure 6.7). It may be noted that a reciprocating or oscillating motion rather than continuous rotation is used in curemeters to prevent break-up of the test piece once cure is well advanced.

84 Physical testing of rubber
The reciprocating paddle instrument is now largely a matter of history and a third type, the rotorless curemeter, has rapidly become the most popular. The rotorless type is a curemeter in which one half of the die enclosing the test piece, rather than a paddle or disc within the test piece, oscillates or reciprocates (Figure 6.7).
Upper die Oscillating disc
Lower die
Test piece Fixed die
(b)
Oscillating die
[ ] ^ = = = ^
Figure 6-7. Principles of oscillating disc and oscillating die curemeters. (a) Oscillating disc; (b) Oscillating die.
Despite the widespread use of curemeters, progress to international standardisation was relatively slow, partly because of patent difficulties as a

Test on unvulcanized rubbers 85
result of the virtual monopoly of certain commercial instruments. However, the oscillating disk curemeter was eventually standardized as ISO 3417^^ . The apparatus is described in some detail, based on commercially available equipment, with requirements for construction, dimensions, frequency and amplitude of oscillation, closing pressure and temperature control.
The ASTM standard, D2084^^^ preceded and was the model for the ISO method. It is considered to be technically the same as ISO 3417 with minor differences not being significant. The British standard, BS 903 Part A60-2'^^ is identical to ISO 3417.
ISO does not have a standard specifically for rotorless curemeters, but instead has a guide to the use of curemeters, ISO 6502^^ . This covers both oscillating disc and rotorless curemeters and distinguishes three types of rotorless instrument - reciprocating, oscillating unsealed cavity and oscillating sealed cavity. It points out the principal advantages of rotorless curemeters as being that the test temperature is reached in a shorter time and there is better temperature distribution in the test piece. The rationale for this approach to stadardising is that a general guide can apply to different types of curemeter and is not restricted to a particular commercial design. All the general matter such as the principles of the different types of instrument, the level of temperature control desirable and the measures which can be taken from the cure trace etc can be in one place, without the problems of specifying in detail the various instrument geometries and constructions available. Also, material common to both oscillating disk and rotorless instruments would not need repetition. The aim as regards covering various designs of rotorless instrument has been achieved but has failed in respect of preventing repetition as the standard refers to ISO 3417 as having particular requirements for oscillating disk instruments.
The basic principles of curemetering are covered and typical vulcanization curves illustrated together with the parameters that can be derived from them. By way of illustration the curve for a plateau type cure on an oscillating disc curemeter is shown in Figure 6.8. Minimum torque, maximum torque or the slope of the curve (cure rate) can be taken but perhaps the most useful single figure is the time to achieve a given degree of cure which is the time for the torque to increase to:
where y is the percentage cure required, (usually 90% for a 'practical' cure, MHF is the plateau torque and ML is the minimum torque.
A similar estimate of cure time is taken from an oscillating paddle or rotorless curemeter curve.

86 Physical testing of rubber
The apparatus is described in fairly general terms, for example the dies should be made of a non-deforming material and have a pattern of grooves to prevent slippage but the precise geometry of the dies and the grooves is not specified. Similarly, there are recommendations for die closure, frequency and amplitude of oscillation, and temperature control. Although not mentioned in the standard, a sealed cavity in a moving die instrument is more difficult from an engineering point of view but can be advantageous in retaining a positive pressure.
TIME TO 90% CURE
TORQUE
TIME
Figure 6-8. Oscillating disc rheometer trace.
ASTM D 5289 ^ for rotorless curemeters, although rather more specific, is overall very similar to ISO 6502 in technical requirements. The British standard* ^ is identical to ISO 6502.
Norman*' gave a valuable discussion of the problems with curemeters, pointing out that there is no one level of cure which gives optimum values for all physical properties and no satisfactory procedure for dealing with a "marching modulus". He also listed problems such as non-uniform temperature distribution, possible slip of the test piece over rotor or cavity and porosity.

Test on unvulcanized rubbers 87
In a practical instrument, there must be some time lag to reach thermal equilibrium When the oscillating disc curemeter superceded the reciprocating paddle type it brought one disadvantage in that it had a larger unheated mass in the disc and, hence, had greater thermal lag. Hands and Horsfall " used an isothermal apparatus to obtain basic cure rate data and developed a mathematical cure model for predicting cure distributions in non-isothermal conditions, as in industrial processes. The rotorless curemeter is shown, for example by Hands et al*^^ to more approximate isothermal conditions than both other types because of the absence of an unheated rotor and a thin test piece, hence giving more accurate predictions for fast curing materials. It is essentially this factor which resulted in the rotorless type of instrument rapidly becoming the most popular. Rosco and Vergnaud^^^ determined the limitations of moving die curemeters under isothermal conditions by considering the temperature and degree of cure profiles through EPDM samples.
Clearly, cure meters will not always agree due to their differing thermal characteristics. Because the Mooney is often used to measure scorch, it is worth noting a comparison between Mooney and curemeter scorch made by Bristow^^^ in which he found poor correlation for higher curing temperatures. Hands et al^'^ Sezna ' and Ahmad and Soo ^ give comparisons between different curemeters and indicate how older instruments differ from more recent ones. The effects of thermal parameters is briefly considered in an annex to ISO 6502.
The oscillating die cure meters are a type of dynamic test and the use of sophisticated forms of the apparatus offers the possibility of alternative measures of cure parameters. Dick and Pawlowski ^^ demonstrate the subtle changes detectable by such instruments and consider alternative measures of scorch and cure characteristics which can be used. It has been suggested that the maximum cure rate may sometimes have advantage over the more usual cure parameters*^^ and consideration given to curemeter testing for cure of thick sections^^ .
Curemeters are usually run under isothermal conditions to determine cure parameters at the temperature(s) of interest. Rosea and Vergnaud^^^ investigated the use of a temperature ramp as being a more efficient way of obtaining kinetic parameters.
The sophisticated oscillating die instruments can continue the measurement of dynamic properties after full cure has been reached. ASTM D660l'^'^ covers measurements both during and after cure. A sealed cavity instrument is specified with amplitude ± 0.2^ during cure and ± 1 to ± 100% strain after cure. In addition to the usual cure parameters, the in and out of phase moduli and tan 5 are reported.

88 Physical testing of rubber
The use of oscillating die instruments to give measures of processability was mentioned in Section 3.6 and references given to accounts of this application^^"^^ Such tests have been standardized in ASTM D 6204 ^ which specifies a sealed cavity instrument with 0.5^ amplitude preferred for frequency sweeps over the range 0.03 to 30 Hz. Standard conditions are given for various polymer types with the temperature being typically lOO^C, which is lower than usual curing temperatures. The dynamic in and out of phase moduh, the dynamic complex viscosity defined as ratio of complex modulus and frequency, and tan 8 are reported. Dick and Pawlowski ^^ have also investigated the use of stress relaxation parameters.
The standardization of this type of measurement in ISO TC 45 came to a grinding halt as a result of problems with ASTM copyright, possible patent issues, lack of verification of the appHcability of the standard test conditions and the need to make the document applicable to instruments from different manufacturers. It looks like a prime case of where a standard should be written in the form of a guide because the procedure and test conditions will vary according to the particular production situation and problems.
Instead of monitoring mechanical stiffness, the change in electrical properties can be used to follow the curing process. The so called dielectric
1 on IOC 1 oo
vulcametry has been described by several workers ' ' . Whilst commercial dielectric analysers are available and are used to investigate various changes in polymer structure, this approach has not yet found widespread application to curing of rubbers but is has been used to monitor in-situ^^ . Paik and Choi* ^ studied the kinetics of cure by differendal scanning calorimetry and correlated results with the oscillating disc curemeter, suggesting that DSC could be an alternative quality control test. The use of ultrasonics for characterizing cure in thin sheets of elastomers was investigated by Kirchhoff and Mewes ^ .
5. TACK
Tack is best thought of as the ability of two pieces of rubber to stick when pressed together and is sometimes called auto adhesion. Therefore, it is not quite the same as stickiness or adhesion, which generally involves sticking or adhering to a second material. High tack can be a nuisance when handhng sheets of rubber but is very important in the manufacture of articles built up from separate pieces of uncured compound.
Despite its importance in some circumstances, the measurement of tack has not attracted the attention of standards committees and satisfactory tests have been few and far between. ISO TC 45 started work on a method but abandoned it through lack of interest. In essence, tack measurements consist

Test on unvulcanized rubbers 89
simply of pressing together two pieces of rubber and then measuring the force required to separate them. In practice, the results are likely to be very variable and it is essential that the pressure applied when joining the test pieces and the time for which it acts are carefully controlled. Gent and Kim^ ^ made a study of the effect of time and pressure using a rebound pendulum device to make measurements at very short times. Results will also be dependant on the rate of separation, which in turn can be influenced by the stiffness of the machine used, and any misalignment during separation.
It is self evident that tack is very much influenced by the surface condition of the rubber as well as dwell time and pressure; this includes contamination and the surface roughness of the test piece. Measurements should be distributed over a fairly large area of the rubber sheet in question to obtain representative results.
A large number of instruments for measuring tack have been devised, some portable for use on the factory floor and some for laboratory operation. Many of these have not been produced commercially and are not used outside of the factory of origin. Bussemaker " reviewed many tack measuring instruments, discussing their mode of operation, advantages and disadvantages. One fairly precise apparatus made commercially was the Monsanto Tel Tack, which used two strip test pieces pressed together at right angles to give a known contact area. After a set contact time under known load, both of which could be varied, the two test pieces are separated in direct tension at a fixed rate of grip travel and the maximum force noted. If required, one test piece can be replaced by a metal strip so that the difference between adhesion and auto-adhesion can be measured. This type of tack test can be carried out on a normal tensile machine fitted with suitable grips to hold the strips of rubber against a metal backing.
Sarkar et al ^ used a modification of the 180^ peel test with a perforated metal sheet at the interface to improve the reproducibility of the tack measurement and studied the effect of a number of parameters on the values obtained.
Tack is, of course, of great importance for adhesives and many methods have been used. A summary of work on testing and finite element analysis of adhesive tack has been given' ^ and it has been questioned whether the methods used for pressure sensitive adhesives really work*" .
6. OTHER TESTS
When uncured rubber is deformed, as it is during milling, the elastic recovery of the rubber will cause a change in dimensions when the

90 Physical testing of rubber
deforming force is removed. Such shrinkage can be measured by cutting a piece of known dimensions from the sheet whilst still on the mill and re-measuring these dimensions after a period of rest. A method is given in ASTM D 1917 ^ for hot polymerized SBR.
Contact methods of measuring surface roughness (see Chapter 7) are not likely to be successful with uncured rubber because of its softness. It is unlikely that roughness needs to be known very precisely and a simple method has been given by Orlovskii et al ^ . The volume of a disc is calculated using the overall thickness measured on top of any irregularities and compared to the true volume measured by a liquid displacement method.
Stress relaxation has been mentioned in the context of several plasticity instruments. ASTM 06048 " ^ gives background information about techniques and theory of stress relaxation testing and interpretation of results. Mention is made of the Mooney and capillary rheometers.
Green strength, the strength of the unvulcanised rubber compound, has been rather long-windedly defined in ISO 9026 " ^ as 'the resistance of raw or unvulcanised compounded rubber to tensile deformation or fracture and thereby a measure of the ability of a rubber or rubber compound to resist tensile distortion during processing and in fabrication, e.g. tyre building'. Another particular definition was 'a property of the bulk of the rubber which is optimised when the breaking strength minus the yield strength is a maximum'. A review of green strength given by McDuff*"* is probably still relevant.
Green strength can be estimated by testing strip or dumb-bell test pieces on a tensile machine to obtain a stress/strain curve and this is the procedure used in ISO 9026. Either a normal dumb-bell or one with a moulded bead to facilitate gripping is specified which is tested at a grip separation rate of lOOmm/min. If an automatic extensometer is used, it needs to be a non-contact type. Typical stress strain curves are illustrated to show the types of yield behaviour which can occur. The stress at yield or the maximum stress is measured plus, if required, yield elongation, stress at a given elongation etc. Clearly, the results will be dependent on temperature and strain rate and, hence, it may be usefiil to test under conditions relevant to the processing operation of interest. The British standard " ^ is identical to ISO 9026 and the ASTM method in 06746^"^ is very similar. It uses the type C dumbbell of D412 but others are allowed and yield stress and elongation plus maximum stress and elongation are reported.

Test on unvulcanized rubbers 91
REFERENCES
1. White J L, Soos I. Rubb. Chem. Technol., 66, 3, p435, 1993.
2. ISO 1658, 1994. Natural Rubber. Test recipes and evaluation of vulcanisation characteristics.
3. ISO 2302, 1995. Rubber, Isobutylene-Isoprene (IIR) - Evaluation procedures. 4. ISO 2303, 1990. Rubber, Isoprene (IR) Non oil-extended. Solution polymerised types -
Evaluation procedure. 5. ISO 2322, 1996. Rubber, Styrene-Butadiene (SBR) - Emulsion polymerised - Evaluation
procedure. 6. ISO 2475, 1999/Cor 1,2001. Rubber, Chloroprene (CR) - General purpose types -
Evaluation procedures. 7. ISO 2476, 1996. Rubber, Butadiene (BR) Solution polymerised types - Evaluation
procedure. 8. ISO 4097,2000. Rubber, Ethylene-Propylene-Diene (EPDM) Non-oil extended raw
general purpose types - Evaluation procedures. 9. ISO 4658, 1999. Rubber, Acrylonitrile-Butadiene (NBR) - Evaluation procedure. 10. ISO 4659, 2003. Rubber, Raw Styrene Butadiene (carbon black or carbon black and oil
masterbatches) - Evaluation procedure. 11. ISO 7663,1995. Rubber, Halogenated Isobutene-Isoprene (BIIR and CIIR) - Evaluation
procedure. 12 BS ISO 1795,2000. Sampling and further preparative procedures for raw, natural and
synthetic rubber. 13. ISO 248,1991. Rubbers, raw - Determination of volatile matter. 14. ASTM D1485, 1986. Rubber from natural sources - Sampling and sample preparation. 15. ASTM D3896,2003. Practice for rubber from synthetic sources - Sampling. 16. Williams I. Ind. Eng. Chem. 16, 362,1924. 17. Scott J R.. Trans. IRI, 7, 169, 1931. 18. Scott J R. Trans. IRI, 10,481, 1935. 19. Scott J R. RABRM Lab. Circular 172, 1940. 20. Heme H, Hine D J and Wright M. RABRM Research Report 70, 1952. 21. Scott J R. RABRM Lab. Circular 134, 1935. 22. ISO 2007, 1991. Determination of plasticity - Rapid plastimeter method. 23. BS 903 Part A59.1, 1997. Methods using plastimeters - Determination of the rapid
plasticity number. 24. ISO 7323 1985/Cor 1,2003. Determination of plasticity number and recovery number -
Parallel plate method. 25. ASTM D926, 2002. Plasticity and recovery (Parallel plate method). 26. Koopmann R. Polym. Test. 5, No. 5, 1985. 27. Isayev A I, Cao D, Dinzburg B. ACS Rubber Division Meeting, Cleveland, 17-20 October
1995, Paper 47. 28. ASTM D6049,2003. Measurement of the viscous and elastic behavior of unvulcanized
raw rubber and rubber compounds by compression between parallel plates. 29. Norman R H. Plast. Rubb. Int. 5, No. 6, 1980, p.243. 30. Berry J P. and Sambrook R W. Paper 28, Rubbercon 77, May 1977. 31. Leblanc J L. Eur. Rubb. J. 162, No. 2, 1998, p20. 32. Amsden C S Polym. Test. 5, No. 1, 1985 p45. 33. ISO 2930,1995. Rubber, Raw Natural - Determination of plasticity retention index (PRI). 34. BS 903 Part A59.2, 1995. Methods using plastimeters - Determination of the plasticity
retention index (PRI) of raw natural rubber.

92 Physical testing of rubber
35. ASTM D3194, 2004. Test method for rubber from natural sources - Plasticity retention index (PRI).
36. Bonfils S, Laigneau J C, de Livonniere H, Saint Beuve J. Kaut. u. Gummi Kunst., 52, No. I,p32, 1999.
37. ISO 289-1, 1994. Determinations using a shearing disc viscometer - Determination of Mooney viscosity.
38. ISO 289-2, 1994. Determinations using a shearing disc viscometer - Determination of pre-vulcanization characteristics.
39. BS 903 Part A58, 1990. Methods using the Mooney viscometer. 40. ASTM D1646,2004. Viscosity, stress relaxation and pre-vulcanisation characteristics
(Mooney viscometer). 41. ISO 289-3, 1999. Determination of the delta Mooney value for non-pigmented, oil
extended, emulsion polymerized SBR. 42. BS 903 Part A58-1, 2001. Determination of the delta Mooney value for non-pigmented,
oil extended, emulsion polymerized SBR. 43. ASTM D3346, 2003. Processibility of emulsion SBR (styrene-butadiene Rubber) with the
Mooney viscometer (Delta Mooney). 44. Kramer H. Polym. Test. 2, No. 2, 1981, pi07. 45. Kramer H. Rubb. Pl;ast. News, 21,20, 1992, pl6. 46. Niemiec S. Polym. Test, 1, No. 3, 1980, p201. 47. Crane D, Ness P E. ACS Rubb. Div. Meeting Detroit, 1989, Paper 126. 48. Kramer H. ACS Rubb. Div. Meeting, Washington, 1990, Paper 5. 49. Noordermeer J W M, America R J H, Visser G W. Standards and quality in the Rubber
Industry, London, Proceedings, 1992, p67. 50. Nakajima N and Harrell E R. Rubb. Chem. Technol. 52, No. 1, 1979, p9. 51. Nakajima N and Harrell E R. Rubb. Chem. Technol. 52, No. 5, 1979 p962. 52. Bristow G M J. Nat. Rubb. Research, 5, 3, 1990, pi82. 53. Whorlow R W. RABRM Res. Memo. R347, 1949, J. Rubb. Res. 20, 39 (1951). 54. Piper G H and Scott J R. J. Sci. Instrum. 22, 206, 1945. 55. Bulgin D and Wratten R. Proc. 2nd Inst. Congress on Rheology, London, Butterworth,
1953. 56. Ghafouri S N, Freakley P K. Polym. Test., 11,2,1992, plOl. 57 Han M, White J L, Nakajima N, Brzowskowski R. Kaut. u Gummi Kunst., 43, 12, 1990,
pi 060. 58. Champaneria R K, Harris B, Lotfipour M, Packham D E, Turner D M. Plast. Rubb.
Process. Appln., 8, 3, 1987, pl85. 59. Taylor R H, Fielding J H. and Mooney M. Rubb. Age, N.Y., 61, 567, 1947. 60. Koopmann R and Kramer H. Paper 012 Conference Internationale du Caoutchouc, Paris,
June 1982. 61. Wharlow R W. RABRM Res. Memo. R375, 1951. 62. Moghe S R. Rubber Chem. & Tech. 49, No. 2, 247, 1976. 63. Male F J. ACS Rubb. Div. Meeting, Chicago, 1994, Paper 11. 64. Friedersdorf C B, Duvdevani I. ACS Rubb. Div. Meeting, Chicago, 1994, Paper 4. 65. Burhin H, Spreutels W, Sezna J. ACS Rubb. Div. Conference, Detroit, 1989, Paper 74. 66. Male F J. ACS Rubb. Div. Meeting, Montreal, 1996, Paper 28. 67. ISO 289-4,2003. Determinations using a shearing disc viscometer - Determination of the
Mooney stress relaxation rate. 68. Leblanc J L. Plast. Rubber Process. Appln. 1, No. 2, 1982. 69. Pica D, Barket R, Rice P and Ma C C. Rubb. World, 180, No. 4, 1979. 70. Sena J A. Paper 22, ACS Rubber Div. Meeting, Indianapolis, May 1984.

Test on unvulcanized rubbers 93
71. Leblanc J L. Plast. Rubb. Comp. Process. Appl. 21, 2, p81, 1994. 72. Liang J-Z. Polym. Test., 23, 1, 2004, p 77. 73. ASTM D5099, 1993. Measurement of processing properties using capillary rheometry. 74. Garvey B S, Whitlock M H. and Freeze J A. Ind. Eng. Chem., 34, 1309, 1942. 75. ASTM D2230, 1996. Extrudability of unvulcanised compounds. 76. Markert J. Europ. Rubb. J., 166, 7, 1984, p28. 77. Markert J. Int. Polym. Process., 2, 3, 1988, p204. 78. Chohan R K, David B, Nir A, Tadmor Z. Int. Polym. Process., 2, 1,1987, pl3. 79. Graf H J, Hellberg G, Lauhus W P, Werner H. Kunststoffe German Plastics, 79, 5, 1989,
p7. 80. Anon. APRI Journal, September 2002, p 7. 81. Pawlowski H, Dick J. Rubber World, 206,3, 1992, p35. 82. Dick J, Pawlowski H. ACS Rubb. Div. Meeting, Nashville, 1992 Paper 37. 83. Dick J, Pawlowski H, Scheers E.. ACS Rubb. Div. Meeting, Orlando, 1993, Paper 98. 84. Pawlowski H, Dick J. ACS Rubb. Div. Meeting, Pittsburgh, 1994, paper 32. 85. Burhin H G. Kaut. u Gummi Kunst., 47,4, 1994, p262. 86. Denby J M. Polym. Eng. and Sci., 11, 433, 1971. 87. White J L. Rubb. Chem. and Tech., 50, 163, 1977. 88. Gotten G R and Thiele J L. ACS Rubb. Div. Meeting, Montreal, May 1978, Paper4. 89. Ng T S. Kaut. u. Gummi. Kunst, 36, No. 1, 1983. 90. Clarke J, Petera J J. Appl. Polym. Sci., 66, 6, 1997, p 1139. 91. Muramatsu K, Furukawa J and Yamashitu S. Nippon Gomu Kyokaishi, 34, 997, 1961. 92. Kusano T, Murakami K and Yamakawa,T. Int. Polym. Sci. and Tech. 8,4, 1981. 93. Yoshida J. Chem. Abs. 46, 3786, 1952. 94. Barres C, Leblanc J L. Polym. Test., 19, 2, 2000, p 177. 95. Shiga S, Oka N. Int. Polym. Sci. and Tech., 22, 12, 1995, p T43. 96. Bristow G M. NR Technol. 13, Part 3, 1983. 97. Baader T. Kaut. u. Gummi, 7, 263WT, 1954. 98. Baader T. Kaut. u. Gummi, 6, 210WT, 235WT, 258WT, 1953. 99. Baader T. Kaut. u. Gummi, 7, 15WT, 1954. 100. Kandyrin L B, Al'tzitser U, Anfimov B N and Kuleznev, V N. Kauch. i. Rezina, No. 4,
18, 1977. 101. Brezik R. Int. Polym. Sci. & Tech., 11, No. 12, 1984. 102. Ng T S. IKT 86, Stuttgart, Summaries, 1985, pl43. 103. Lim C L, Ong, E I. J. Nat. Rubb. Res., 5, 1, 1990, p9. 104. Popovic R S, Plavsic M, Popovic R G, IHc N. Kaut. u Gummi Kunst., 44, 7, 1991, p702. 105. Breemhaar W, Koopmann R, Markert J, Noordermeer J. Kaut. u Gummi Kunst., 46, 12,
1993, p957. 106. Kramer H, Schnetger J. ACS Rubber Division 149** Spring Meeting, Montreal, May
1996, paper 27. 107. ISO 3417, 1991. Method for the determination of vulcanisation characteristics using an
oscillating disc curemeter. 108. ASTM D2084,2001. Vulcanisation using oscillating disc cure meter. 109. BS903:Part A60-2, 1992. Method for the determination of vulcanisation characteristics
using an oscillating disc cure meter. 110. ISO 6502,1999. Guide to the use of curemeters. 111. ASTM D5289, 1995. Vulcanisation using rotorless cure meters. 112. BS 903 Part A60-1 2000. Guide to the use of curemeters. 113 Norman R H. Polym. Test., 1, No. 4, 1980. 114. Hands D and Horsfall F. Paper 11, ACS Rubb. Div. Meeting, Houston, Oct. 1983.

94 Physical testing of rubber
115. Hands D, Norman R H and Stevens P. Rubbercon Conference, Birmingham 1984. 116. Rosea I D, Vergnaud J M. ACS Rubber Division Meeting, Pittsburgh, 8-11**" October
2002, Paper 15. 117. Bristow G M. NRTechnol. 13, No. 1, 1982. 118. Sezna J A. ACS Rubb. Div. Meeting, Denver, 1993, Paper 69. 119. bin Ahmad A, Lim Hun Soo. Indian J Nat. Rubb. Res., 5, 1&2, 1992, pi 13. 120. Dick J, Pawlowski H. Polym. Test, 14, 1, 1995, p45. 121 Dick J, Pawlowski H. Polym. Test., 15, 3, 1996, p207. 122 Sezna J A. ACS Rubber Division Meeting, Louisville, 8 ''-l 1* October 1996, paper 3. 123. Rosea I D, Vergnaud J M. Polym Test., 23, 1, 2004, p59. 124. ASTM D6601, 2002. Measurement of cure and after cure dynamic properties using a
rotorless shear rheometer. 125. ASTM D6204, 2001 Measurement of unvulcanised rheological properties using rotorless
shear rheometers. 126. Dick J S, Pawlowski H. ACS Rubber Division Meeting, Cleveland, 17 *'-20* October
1995, paper 26. 127. Persson S. Plast. rubb. Process. Appln., 7, 2, 1987,pill. 128. Hedwig P. Int. Polym. Sci. Technol, 23, 3 1996, p T23. 129. Magil 1 R, Demin S. Rubb. World, 221, 3 1999, p 24. 130. Mori T, Gondoh T, Toh M, Okai D. Proceedings, IRC '95, Kobe, 23rd27th October
1995, p 341. 131. PaikN-C, Choi S-Y. IRC 85, Kyoto, Proceedings, 1985, p262. 132. Kirchhoff J, Mewes D. Kautchuk und Gummi Kunststoffe, 55, 7-8,2002, p 373. 133. Gent A N, Kim H J. Rubb. Chem. Technol., 63,4, 1990, p613. 134. Bussemaker O.K.F. Rubb. Chem. and Tech. 37, 1178, 1964. 135. Sarkar A, Bhowmick A K, Chakravarty S N. Polym. Test., 8, 6, 1988, p415. 136. Duncan B, Dean G D, Pearce A. Proceedings, Adhesion'99, Cambridge, 15-17**"
September 1999, p381. 137. Bentley D J. Paper Film Foil Conv., 71,6 1997, p 24. 138. ASTM D1917,2003. Shrinkage of raw and compounded hot polymerized styrene-
butadiene rubber. 139. Orlovskii, P N, Lukomskoya A I, Tsydzik M A and Bogotova S K. Sov. Rubb. Technol.
No.7, 1960,p20. 140. ASTM D6048,2002. Stress relaxation testing of raw rubber, unvulcanised rubber
compounds and thermoplastic elastomers. 141. ISO 9026 1991. Raw rubber or unvulcanised compounds - Determination of green
strength. 142. McDuff K. Green Strength - A Review, RAPRA Technology, 1978. 143. BS 903 Part A 62, 1993. Method for determination of green strength of raw rubber or
unvulcanised compounds. 144. ASTM D6746,2003. Determination of tensile green strength.

Chapter 7
MASS, DENSITY AND DIMENSIONS
Mass, density and dimensions are grouped together largely for convenience but there is an obvious link between them in that density can be derived from knowledge of mass and dimensions. Perhaps more significantly, they are all measurements which are used as an essential part of other physical tests. For example, density is used to calculate volume loss in an abrasion test or as an integral part of volume change measurements. There are very few methods that do not at some point involve the measurement of dimensions and for many tests mass is an essential parameter. Density and dimensions also have a certain link in the factory, both being important as regards the costing of products. Density is very commonly used as a simple but effective quality control check on batches of compounded rubber as a guard against gross errors; and dimensional checks on products are one of the common operations of routine inspection.
Hence, both in the laboratory and in the factory, density and dimensional measurement have a particular position due to their frequent usage. Measurements that are made every day have a habit of being taken for granted and this can certainly happen to the measurement of dimensions, resulting in unnecessary errors. When one considers that in, for example, the determination of tensile strength, any error in the measurement of the cross section results directly in an equivalent percentage error in the strength measurement, it is reasonable to devote considerable attention to the seemingly simple matter of measuring the width and thickness.
1. MASS
Mass is clearly defined in SI units and there should be no confusion with

96 Physical testing of rubber
the term weight, which is often used indiscriminately. In testing, a mass is often used to produce a force but it is quite reasonable to refer to the lump of material that constitutes the mass as a weight. Mass is determined by weighing the object in question using an appropriate balance or scales. Weighing on a beam balance is essentially a process of comparing masses, whereas weighing on a spring balance is really measuring a force.
There is a considerable range of objects that need weighing and clearly this means that more than one weighing instrument may be required. The requirement for determining mass may be written in terms such as accurate to Img whereas a balance may be quoted as reading to Img. The two are not the same and, as standards are not always clear, care needs to be taken. Rubber testing standards do not normally specify any details of the weighing instrument to be used other than accuracy, and the balances that are needed are considered as general laboratory apparatus.
2. DENSITY
Density is defined as mass per unit volume, whereas relative density is the mass of the substance compared to the mass of an equal volume of a reference substance (usually water) and is, hence, dimensionless. Relative density used to be commonly known as specific gravity but this term is now deprecated and should not be used.
In practice, the method of measurement often involves the determination of the relative density to water but the density of water is assumed to be 1 Mg/m. Furthermore, the determination is often made by observation of gravitational forces but for convenience the forces are expressed in mass units.
For most purposes, the density of a rubber is quoted to 0.01 Mg/m and the commonest method of determination is by weighing in air and water. The standard procedure is given in ISO 2781* Method A and specifies a test piece weighing a minimum of 2.5 g which can be of any shape as long as the surfaces are smooth and there are no crevices to trap air. It is stated that duplicate tests shall be made, which presumably means two test pieces rather than two tests on the same piece. The test piece is weighed in air and then in water using a balance accurate to 1 mg, which is frequently wrongly interpreted as a balance reading to 1 mg. A top pan balance is not suitable. It is permissible to wet the test piece with a liquid such as methylated spirit before weighing in water and this is, indeed, common practice. The water then needs to be changed relatively frequently because of contamination by the alcohol. The best way of suspending the test piece is by means of a very fine filament, the weight of which can be included in the zero adjustment of the balance and its volume in water can be ignored. However, if smaller than

Mass, density and dimensions 97
standard test pieces are used the effect of the filament could be significant. If the rubber is less dense than water, a less dense liquid of known
density could be substituted but it is more usual to attach a sinker to the test piece. The sinker can conveniently be a small piece of lead, but using an item like a paper clip to suspend the test piece leads to complications as it will only be partly submerged. The weight of the sinker in water must be measured and it is a common error among inexperienced technicians to make this weighing in air.
ISO 2781 also details a procedure (Method B) for use when it is necessary to cut the sample into small pieces to avoid trapped air, as might happen with narrow bore tubing. The test piece comprises a number of small smooth pieces within the size 4 mm x 4 mm x 6 mm. These are weighed in a density bottle both with and without the remaining space filled with water. The bottle is also weighed without rubber both empty and filled with water. This is a more tedious procedure than Method A and most people would prefer to go to great lengths to obtain a large test piece free from air bubbles rather than resort to the density bottle, especially as even with the test piece cut up trapped air can still be a problem.
The British equivalent to ISO 2781 is BS 903:Part Al^ which is identical to the international method. Rather surprisingly, ASTM does not appear to have a specific method for density at the present time. There is, however, a section on density in the standard on chemical analysis of rubber products, D297\ which briefly gives methods by pycnometer, hydrostatic weighing and a compressed volume densimeter. The weighing method does not mention the use of a sinker for densities less than 1. There is also a method for density of rubber chemicals, 01817)" , which uses the pycnometer method and, interestingly, specifies a vacuum pump to remove air before the measurement..
It is not often that density is required to be known to a greater accuracy than provided by the standard methods discussed above, but greater accuracy can be provided by use of a density column as standardised for testing plastics in ISO 1183-2^ The principle of the method is that two miscible liquids of different densities can be very slowly run into a container such that a uniform density gradient from the bottom to the top of the container results. This column can then be calibrated by floats of known density which will come to rest at the depth in the column where their densities equals that of the immediate surrounding liquid. Small test specimens of rubber are then introduced into the column in the same manner and allowed to come to rest, their height in the column measured and their density deduced from a calibration graph. The sensitivity of the column depends on it its height and the overall range. Typically, the column could have 1 mm gradations and an overall range of 0.1 to give a sensitivity of 0.001 g/cm^ or, where required, a range of 0.01 g/cm^ and a sensitivity 0.0001 g/cm^ With this order of sensitivity, very close control of temperature is necessary. With care, a

98 Physical testing of rubber
column will last a long time and it is possible to remove old samples with a wire basket. Ten minutes is suggested as the minimum time to allow test pieces to come to equilibrium but a large number of samples can be tested at one time and only a very small sample is required. A typical single column apparatus is shown in Figure 7.1.
First liquid Tap
Second liquid Tap
Magnetic stirrer
Column
Capillary filling tube
Figure 7-1. Preparation of a density column

Mass, density and dimensions 99
A useful procedure for checking if test pieces lie within certain limits of density is to prepare two liquids of different but known densities; to be within the known limits a test piece must sink in one liquid and float in the other. This can be employed, for example, to rapidly sort parts made in two materials which have been mixed up. A further variation^ is titration of a heavier liquid into a lighter liquid until the test piece just floats, as given in IS0 1183-1^
Because density is often used as a quality control check on batches of rubber compound, there has been a necessity to make measurements essentially in accordance with standards such as ISO 2781 but making the determinations as rapidly as possible. Hence, various designs of 'specific gravity balance' are in existence which to varjdng degrees automate the process. In the basic forms of apparatus, the practical steps of weighing in air and water are taken but the result may then be read directly from a scale calibrated in density. Complete automation has been achieved both by using the principle of weighing a moulded test piece of known volume and by using the displacement of water principle.
For thin sheet material, it will be more expedient, and perhaps more useful, to measure mass per unit area rather than density. This is achieved by weighing a uniformly shaped piece of the material with known dimensions. Obviously, the density of any uniform piece of rubber can be obtained, at least approximately, but weighing and measuring all the dimensions in a non-contact manner.
3. DIMENSIONS
The most common dimensional measurements relate to the size of test pieces because this information is required for virtually all physical test methods. There is also sometimes need to measure dimensions of components of the apparatus, such as the thickness of spacers in compression set tests. Other aspects of dimensional measurement that are relevant to rubber testing include extensometry, surface roughness, dimensional stability and dispersion.
3.1 Standard Methods
Almost all test methods require the test piece dimensions to be measured and it was the usual practice for each test method standard to specify the apparatus and means of making the measurements. Over the years, the procedures became standardised such that it was reasonable to produce a separate standard dealing specifically with dimensions, to which all the test method standards could refer.

100 Physical testing of rubber
For many years the international standard for measuring dimensions was ISO 4648 but recently its content has been incorporated into the general standard for preparing and conditioning test pieces for physical test methods, ISO 23529''. This has four methods dealing with dimensions less than 30 mm, dimensions over 30 mm, over 100 mm and non-contact procedures respectively.
The first method for dimensions under 30mm specifies a gauge accurate to 1% or 0.01 mm, whichever is the smaller, with a foot pressure of 22 ± 5 k Pa (10 ± 2 k Pa for hardness below 35 IRHD) acting on a plane flat foot. A table gives the nominal loading to achieve the pressure with various diameters of foot. The previous version of this standard had an annex which gave a diagram of a suitable apparatus involving a weight and a dial gauge with a lock such that the gauge spring pressure does not bear on the rubber. The more usual traditional approach was to use an ordinary dial gauge minus the return spring but suitably loaded with a weight. The same principle is used with other types of transducer and an advantage of digital gauges is that the result can be fed directly to a computer.
It is fairly obvious that with a soft deformable material such as rubber a contact method does not measure the true thickness and the use of a different foot pressure would produce a different result. Hence, it is not permissible to use a dial gauge with a return spring, calipers or a travelling microscope when this standard method is specified. The errors resultant on using different pressures have been reported by Clamroth and Dobroschke^. It will be appreciated that errors will also be introduced if the measuring platens are not parallel and the effect of this on tensile strength has been demonstrated for latex^.
A previous edition of the dimensions standard also had a method intended for compression set test pieces which was similar except that the force on the foot was 850 ± 30 mN and the contact members were either domed surfaces of 12.5 mm radius or a spherical contact of 6.35 mm diameter and a raised platform of 9.5 mm diameter. This use of curved surfaces for compression set is based on the fact that after compression, particularly with non-lubricated test pieces, the rubber may well have concave surfaces. This does not happen if the test piece is lubricated as is now the usual practice and, hence, the curved surfaces were eliminated. However, if concave test pieces are encountered it may well be better to resort to the old method
This method is essentially intended for the measurement of thickness and there has been considerable debate as to how many readings should be taken and what form of average should be used. ISO 23529 specifies at least three readings, taking the median. However, for a test such a tensile strength there is merit in the notion that it is not the median thickness but the minimum thickness which is required. Practical difficulties probably make the adoption of the mean or median most sensible but it can be expected that not

Mass, density and dimensions 101
all test methods will be totally in agreement. Dimensions such as the width of a dumb-bell or the depth of a nick in a
tear specimen will be less than 30 mm but could not be measured with a dial gauge. Because of the virtual impossibility of applying a known pressure, such measurements must be made in an essentially 'contactless' manner. For low precision, calipers or a rule may suffice but for readings to 0.01 mm a travelling microscope or projection microscope is most suitable, and this is specified in ISO 23529 Method D and appUes also to dimensions over 30mm. Projection microscopes also find use in examining profiles and for rapid swelling tests (see Chapter 16, Section 2.1).
For the measurement of dimensions greater than 30 mm and up to 100mm, ISO 23529 (Method B) simply specifies vernier calipers capable of measuring with an error of not more than 1%, with the requirement that the test piece shall not be strained. In this context it may be noted that, although projections microscopes do not generally cover dimensions much greater than 30 mm, they can be used with a suitable jig to measure change in dimensions of a large test piece. Also, calipers using an alternative transducer system to the classical vernier would be suitable. The remaining method of ISO 23529 (Method C) specifies a rule or tape for measuring dimensions greater than 100 mm with an accuracy of 1 mm.
No attempt will be made in this section to consider all the separate measurement clauses to be found in current test method standards. Until the ISO standard for the measurement of dimensions has become established long enough for all test methods to have been revised and reference it (if that happens), each test method will have its own procedure and there will not be universal agreement on detail. The essentials are to distinguish between a non-contact measurement and one applying a specified pressure, in the latter case to use the correct standard pressure, and to measure within the accuracy limits specified.
The British standard, BS ISO 23529, is identical to the ISO method. ASTM D3767^^ has a similar structure. Method A specifies a micrometer (for micrometer read dial gauge) with a flat foot the same as in ISO 23529. Method Al is the old domed foot method for use on curved surfaces whilst Method A2 is for cellular materials. The illustration of the apparatus shows a traditional dial gauge with the locking device to prevent the force of the return spring bearing on the rubber. A granite platform base is specified although it is the base plate that matters in terms of being flat and parallel. The accuracy is given as 1% or 0.001 mm which ever is the greater - this will generally be 1% and, for example, double the tolerance in ISO 23529 for a 2 mm thick dumbbell.
Methods B and C are the same as ISO 23529 plus, optionally, a tape for measuring circumference up to 100 mm. Method D only mentions a traveling microscope and requires an accuracy of 0.005 mm. It says that this method is more accurate than method A but more time consuming - in

102 Physical testing of rubber
practice they are used in different circumstances rather than being comparable and a lower accuracy could be sufficient for some non-contact measurements. Method E uses a graduated cone or plug gauge which would be applicable to rings and products with holes. The measurement of rings was neglected in the ISO method.
3.2 Non-standard Methods
Although not standardised for use with rubbers, the method of determination of gravimetric thickness is used for thin plastic film and could have use with rubber film or coatings. In the method of ISO 4591^^ a square test piece of 100 cm^ area is weighed in air and water to give mass and density and from this the average or gravimetric thickness can be calculated.
On-line inspection is a form of testing and in this context dimensional measurements are those most often made. Apart from gauges, micrometers and so on, there are various optical, electrical, nuclear and other methods which may have advantages in production circumstances. Descriptions of the use of such techniques can be found in the literature and in manufacturers' data sheets. Some fairly recent examples relating to rubber and plastics products are given in references 12-16. However, the various techniques will not be reviewed here.
Dimensional methods having use in the laboratory have been reviewed in connection with swelling measurements.^ ' ^ The length of cracks can in fatigue tests can be manually measured by conventional methods or continually recorded with a video camera. An electrical method of crack measurement has been used for plastics ^ that in principle could be applied to rubbers.
There are inevitably a great number of special circumstances connected with rubbers where an unusual type of dimensional measurement is required and some references are given below to cases that have been reported in the literature. Very often a great deal of dimensional information can be found by means of microscopy - such an important subject in its own right as to be in no way considered as a branch of physical testing. One would expect to employ a microscope to determine the thickness of a wax film on the surface of a rubber but a particular technique employing a cigarette paper has been described^ . Methods for determining footprint area of tyres have been given^ ' ^ and also an interlaboratory study of tread depth measurements * . Back to the measurement of area, a device has been described to measure the contact area between a gasket and a shaft " , as has an apparatus for determining the surface area of polymer shavings^ . A gas adsorption instrument can measure the surface area of ground rubbers^ . So called Laser-Optic Triangulation can measure various dimension of rubber hose in a non-contact manner^ .

Mass, density and dimensions 103
These references are of course by no means exhaustive, many more particular cases of dimensional measurement will have been described and a number of methods of interest will be mentioned in later chapters in conjunction with particular physical tests.
3.3 Surface Roughness
It is not often necessary to measure the surface roughness of rubber test pieces or products and no standard methods exist. If measurements are attempted, either mechanical profiling as is standard with metals, or possibly optical reflectance methods, would be used. It has been suggested^^ that the surface geometry of rubber can be assessed by observing the length of shadow thrown by an opaque body. Generally, it is necessary to turn to methods established for metals but only those which can be adapted to take account of the much greater deformability of rubber will be of potential value.
In rubber testing, the surface finish of metals is of importance, for example on mould surfaces and compression set plates. There are a number of standards in the ISO Geometric Product Specification series but the most relevant is ISO 4287^^ which covers terms, definitions and surface texture parameters relating to the profile method of measuring surface finish. There are apparently over 1000 different parameters to characterize surface finish^^ but only a few are generally encountered. The most commonly found is Ra (previously called CLA) which is the mean deviation of the surface profile above and below the center line, followed by Rz, a measure of the peak to valley height. For example, the arithmetic mean deviation (Ra) of the compression plates for compression set tests must be better than 0.2 m.
The relevant British standards are BS 1134-1^^ and 1134-2 l Part 1 deals with methods and instrumentation whilst Part 2 gives guidance and general information and is, hence, a good introduction to the subject.
3.4 Extensometry
The measurement of extension (or other mode of deformation) is an essential part of several tests, notably tensile or compression stress/strain properties and also thermal expansion. The precision required must be specified in the individual test method and is unlikely to be the same as that required for test piece dimensions. The method of measurement will also be dependent on the test in question and particular techniques will be given in most cases. Hence, the requirements for specific tests will be discussed in the relevant sections in later chapters.

104 Physical testing of rubber
3.5 Dimensional Stability
Generally, vulcanised rubber is dimensionally very stable (unless it is strained), which probably explains the lack of standard test methods for this property. In this context, thermal expansion and swelling in liquids are properties considered in their own right and not normally thought of as being measures of dimensional stability. This is a different situation to that which exists with plastics where a number of dimensional stability tests are in existence. If a measure of dimensional change is required, the appropriate dimensions of a suitable sized test piece can be measured by any of the methods mentioned in this chapter before and after an ageing treatment.
Although mould shrinkage, i.e. the reduction in size of cooled moulded articles compared to the mould dimensions, is principally a matter of thermal expansion, it is usual to make a direct measure of shrinkage by measuring a standard moulded test bar. There must be any number of 'standard' moulds used in various factories for this purpose and the main essential is that the required accuracy can be obtained. For example, to detect 0.1% shrinkage on a 10 cm bar requires a measurement to 0.1 mm. Shrinkage data has been given by Juve and Beatty^^ as well as a procedure for calculating shrinkage for different formulations.
3.6 Dispersion
From the early days of the industry it was appreciated that the dispersion of compounding ingredients, particularly carbon black, in the rubber can have a large effect on physical properties and that a measure of dispersion was important to judge the efficiency of mixing. The earliest methods were based on observing a freshly cut or torn surface with a lens when the smoother the surface the better the dispersion, and that basic principle remains to this day.
The various direct methods of estimating dispersion are essentially dimensional measurements on more or less a microscopic scale and this is just one example of the value of microscopy for fault diagnosis in rubber products. Dispersion measurements are normally made on cured rubber although it is possible to prepare test pieces from some uncured materials.
From work such as the development of cryo-sectioning by Leigh-Dugmore " and standard photographic charts^^ came the methods in ASTM D2663^ . Three method are specified: A) Visual inspection, B) Agglomerate count and C) Microroughness measurement.
Method A is examination of a torn surface with reflected light, which gives an overall picture of dispersion and is a useful rapid test in the control laboratory. The magnification specified is 10 - 20x and 5 standard photographs are included against which the rubber surface can be rated.
Mass, density and dimensions 105
Unvulcanised materials can be tested by pressing and making the cut with a hot knife.
To examine the dispersion of fine agglomerates of carbon black it is advantageous to microtome sections and make the examination by transmitted light, which is the procedure specified in Method B. Sections are produced using a freezing stage on a sledge microtome with a glass knife and the microtoming procedure is given in detail. The sections are examined in transmission on an optical microscope at a magnification of between 75 and lOOx and the percentage of agglomerates down to 5|Lim is estimated by counting by means of a ruled graticule. The percent dispersion is then calculated taking into account the percentage of black in the compound and any swelling of the section by the solvent used to flatten them for observation. Alternatively, classification can be made against a standard chart - hence the title of this method is a little confusing as it includes a visual observation procedure like method A. The standard photos are not included in the standard but comprise a scale of A-H for decreasing percent dispersion and 1-6 for increasing agglomerate size. It is clear that the transmission procedure is much more time consuming, especially when the agglomerates are counted.
Method C makes use of a so called dispersion analyzer, which is a particular form of stylus type surface roughness meter. The principle is that the worse the dispersion the rougher the surface. A dispersion index is obtained from the number of peaks/cm and average height of peaks measured, plus material constants obtained by method B. The object appears to be to use the analyzer as a convenient routine control method after the compound has been evaluated by the more tedious method B.
Persson^^ reported an improvement to the ASTM microscope method by using split field microscopy which was incorporated into a commercial instrument ^ and was the basis for the eventual production of an ISO standard^ . ISO 11345 specifies optical methods of observing a cut surface by reflected light and includes comparison against standard photographs using the split field technique. The British standard, BS ISO 11345, is identical.
Method A is examination at 30x magnification with a binocular microscope and an optional camera. Illumination is at an oblique angle of 30^ to accentuate the surface detail. The test piece is cut by a razor blade and vulcanized or unvulcanised material can be used. In the latter case, the sample is first compressed to minimize trapped air and the blade is heated. Warning is given that the result may not be the same as when using a vulcanized test piece. The result is compared to a set of standard photographs that are given in the standard.
Method B is essentially the same except that arrangements are made to have the image of the test piece in question and the standard photographs displayed on a screen side by side.

106 Physical testing of rubber
At the time of writing, a revision of ISO 11345 is near to completion. The main change is to expand the number of methods to 5 so that provision is made to make tests at lOOx magnification and also a separate procedure for large agglomerates. The new version covers dispersion of silica as well as carbon black and additional sets of standard photos have been included.
There are several accounts of the development of dispersion methods, including Persson"* and the very comprehensive review of characterising dispersions from every aspect given by Hess' V By far the most common methods are direct observation by reflected or transmitted light. The method of measuring surface roughness with a stylus instrument has been described by Hess et al" ^ and provision made so that the test could be automated and carried out very quickly. Richmond" ^ used an automatic microscope data accumulator (AMEDA) with the old technique of hardening a test piece by soaking in molten sulphur and then polishing before microscopic observation. Ebell and Hemsley'*' used a novel method involving the analysis of the dark field produced by a reflected light microscope which has also been described later by Murray et al" .
Three dimensional characterization of dispersion has been achieved by a 3D modeling technique using transmission electron microscopy" . The ability of the atomic force microscope to image dispersion of fillers has also been demonstrated"^ . For transmission methods, test pieces have to be sectioned and ultramicrotomy techniques have been described' ^ The reflectivity from the rubber surface measured using standard equipment for for the evaluation of tint strength in carbon black has been used for determining dispersion" . Methods given by Jansen and Kraus^ , based on optical density, are for determining dispersability of blacks and not dispersion in rubber compounds.
Three instruments involving video technology have been compared^ one procedure using sulphur hardening and polishing. Interferometric microscopy has been applied to characterizing dispersion by producing interference fringes from light beams from the test sample and a smooth reference^^ which is, therefore, a method based on roughness. Electrostatic force microscopy was used^ to investigate the surface topography of carbon nanotube reinforced conducting nitrile compounds.
The estimation of degree of dispersion can be made indirectly by measurement of electrical methods or measurement of mechanical properties. Boonstra " used a coaxial electrode system to estimate dispersion form electrical resistivity whilst Belokur et al ^ investigated the possibility of assessing dispersion from rheological measurements.
Cembrola^^ has compared microscope, stylus and resistivity methods and concludes that no one method is universally the best. Guerbe and Freakley^^ compared four methods including a microwave energy absorption method.

Mass, density and dimensions 107
REFERENCES
1. ISO 2781, 1988, Cor 1, 1996. Determination of density. 2. BS 903:Part Al, 1996. Determination of density. 3. ASTM D297, 1993. Rubber products - Chemical analysis. 4. ASTM D1817,2003. Rubber chemicals - Density. 5. ISO 1183-2, 2004. Methods for determining the density of non-cellular plastics - Part 2
Density gradient column. 6. ISO 1183-1 2004. Methods for determining the density of non-cellular plastics - Part 1
Immersion method, liquid pyknometer method and titration method. 7. ISO 23529, 2004. General procedures for preparing and conditioning test pieces for
physical tests. 8. Clamroth R. and Dobroschke P. Tech. Notes Rubb. Ind.,No. 51, 1974. 9. Goodchild IR, Williams M J. Rubb.Dev., 45,4, 1992, p91. 10. ASTM D3767, 2003. Measurement of dimensions. 11. ISO 4591, 1992. Gravimetric thickness and yield of flexible sheet. 12. McCarthy E T. 152" ^ ACS Rubber Division Meeting, Cleveland, 21-24* October 1997,
Paper 1. 13. Larriman D, Whiteman R. 148* ACS Rubber Division Meeting, Cleveland, 17-20*
October 1995, Paper 80. 14. MichaeH W, Behrens M. Antec 93, New Orleans, 9-13* May 1993, Vol.11, pl570. 15. Spang A, Wuestenbergn D. Kunststoffe German Plastics, 83,11, 1993, pl4. 16. Embleton B, Axelrod S. Antec 2000, Orlando, 7-11* May 2000, Paper 61 17. Brown R P. and Jones W L. RAPRA Bulletin, February 1972. 18. Brown R P. RAPRA Members Journal, August 1973. 19. Fischer C, Arendts F J. Composites Sci. & Technol., 46, 4, 1993, p319. 20. Angert L G, Mavrina R M. and Kuz'minskii A S. Kauch i Rezina, 28, No. 10, 1970. 21. NBS. Rubber Age, 102, No. 10, October 1970, 22. Pizer R S and Spinner S. Mater. Res. Stand, 10, No. 2, February 1970. 23. Brenner F C and Kondo A. Tyre Sci. and Technol., 2, No. 2, May 1974. 24. Yurtsev N N. and Kosenkova A S. Kauch i Rezina, 28, No. 12, December 1969. 25. Salloum R J and Eckert R E. J. Polym. Sci., A2, 10, No. 5, May 1972. 26. Holland G W, Hu B, Holland S W. 145* ACS Rubber Division Meeting, Chicago, 19-
22"^ April, 1994, Paper 32. 27. Bondurant P, Gravitz D. 152"" ACS Rubber Division Meeting, Cleveland, 21-24* October
1997, Paper 120. 28. Tryukova Yu P, Travin G M and Gorbunov O L. Kauch i Rezina, 31, No. 7, 1972. 29. ISO 4287, 1997, Corl, 1998. Geometrical product specification - Surface texture: Profile
method - Terms, definitions and surface texture parameters. 30. Morton R. QuaHty Today, June 1995, p 36. 31. BS 1134, Part 1 1988. Assessment of surface texture. Methods and instrumentation. 32. BS 1134 Part 2 1990. Assessment of surface texture. Guidance and general information. 33. Juve A E and Beatty J R. Rubber World, October 1954. 34 .Leigh-Dugmore C H.Rubber Chem. Technol., 29,1956, pl303. 35. Medalia A I and Walker D F. Technical Report RG 124 Revised. Published by Cabot
Corporation, Boston, USA, 1966. 36. ASTM D2663, 1995. Dispersion of carbon black. 37. Persson S. Eur. Rubb. J, 160, No. 9, 1978. 38. Andersson S, Persson S, Skoog L. Int. Polym. Sci. & Tech., 25, 12, 1998, pTl. 39. ISO 11345 1997. Assessment of carbon black dispersion - Rapid comparative methods.

108 Physical testing of rubber
40. Persson S. Polym. Test, 4, 1, 1984, p45. 41. Hess W M. Rubb. Chem. Technol., 64, No. 3, 1991, p. 386. 42. Hess W M, Chirico V E and Vegvari P C, Elastomerics, 112, No. 1, 1980. 43. Richmond B R. 143'" ACS Rubber Division Meeting, Denver, 18-21' May 1993, Paper
68. 44. Ebell P C and Hemsley D A. Rubb. Chem. Technol., 54, No. 4, 1981. 45. Murray G A, Southart D W, Freakley P K. Rubb. Chem. Technol., 70, 1, 1997, p50. 46. Gruber T C, Zerda T W, Gerspacher M. Rubb. Chem. Technol., 67, 2, 1994, p280. 47. Trifonova-Van Haeringen D, Schoenherr H, Vancso G J, Van der Does L, Noordermeer J
W, Janssen P J P. Rubb. Chem. Tech., 72, 5, 1999, p862. 48. Cudby P E F. J. Nat. Rubb. Research, 11,3, 1996, pl49. 49. Gerspacher M, Nikiel L, Yang H H, O'Farrell C P. Rubb. Chem. Technol., 71, 1, 1998,
pl7. 50. Janzen J and Kraus G. ACS Rubb. Div. meeting, Cleveland, Oct. 1979, Paper 3. 51. Putman M, Welsh F. ACS Rubber Division Meeting, Columbus, 5-8 '' October 2004,
Proceedings, Paper 45. 52. Smith A P, Aybar T L, Magee R W, Herd C R. Filler Reinforcement of Rubber, 14*
September 2004, Proceedings, pi 1. 53. Kader M A, Choi D, Lee S K, Nah C. Polym. Test., 24, 3,2005. 54. Boonstra B B. Rubb. Chem. Technol, 50, No. 1, 1977. 55. Belokur S P, Skol V I, Sapronov V A. Int. Polym. Sci. Tech., 13, No. 2, 1986. 56. Cembrola R J. Rubb. Chem. Technol. 56, No. 1, 1983. 57. Guerbe L, Freakley P K. Kaut. u. Gummi Kunst, 48,4, 1995, p260.

Chapter 8
SHORT TERM STRESS - STRAIN PROPERTIES
The term 'stress-strain' is a convenient one to cover tests that determine the relationship between an appUed force and the resulting deformation, regardless of whether the quantities measured are expressed as stress (force per unit cross sectional area) and strain (deformation as a fraction of initial dimension) or given directly as force and deformation. The so-called 'short term' measurements of stress and strain grouped together in this chapter refer to the various stress/strain or force/deformation measurements where the effects of long times and cycling are ignored. The term 'static stress/strain' tests is also applied to this group to distinguish them from the dynamic or cyclic tests. Neither term is really accurate since deformation must involve movement and a dynamic test might be even shorter, but the meaning is generally understood as referring to tests in which the time period of the deformation is much greater than that required for the molecular network to respond to an applied stress, but short enough to make creep unimportant.
Such tests were amongst the first to be studied and standardised and have been of enormous value, particularly in quality control. It must be realized, however, that they are limited as regards complete mechanical characterization, simply because mechanical properties of rubbers are very dependent on time, temperature and test conditions. This can lead to contrasting views of, on the one hand, something of a fanatical belief in, for example, the value of hardness measurements to characterize a compound, and, on the other, dismissal of all simple mechanical tests as virtually useless for understanding material behaviour. The truth is, as one might suspect, somewhere in between. The best value is obtained from the simpler tests if care is taken in choosing the most relevant tests, carrying them out under the most relevant conditions and not expecting the result to be necessarily valid when applied to some different conditions.

no Physical testing of rubber
1. STRESS-STRAIN RELATIONSHIPS
Stress/strain relationships are commonly studied in tension, compression, shear or indentation. Because in theory all stress/strain relationships except those at breaking point are a function of elastic modulus, it can be questioned as to why so many modes of test are required. The answer is partly because some tests have persisted by tradition, partly because certain tests are very convenient for particular geometry of specimens and partly because at high strains the physics of rubber elasticity is even now not fully understood so that exact relationships between the various moduli are not known. A practical extension of the third reason is that it is logical to test using the mode of deformation to be found in practice.
It is not necessary to be expert in the theory of rubber elasticity to test rubbers but it is a distinct advantage to be conversant with the main principles. A classic account of the development of the basic theories is given by Treloar^ which, if not digested from cover to cover, should be compulsory reading for those concerned with physical testing.
Statistical network theory leads to the expression of the strain energy density (energy stored in unit volume of the rubber) in terms of the extension ratios:
where W = strain energy density and A-i, Xi, A.3 are extension ratios in the three principal axis.
Also, because the assumption is made that the rubber is incompressible:
A^A2A>'^ — 1
Statistical network theory then leads to the following relatively simple relationships between stress and deformation:
a) Simple shear:
Shear stress = GA,
b) Tension or compression with lubricated ends
Tensile or compressive stress = G{X - /l~^) (calculated on initial cross section)

Short term stress-strain properties HI
c) Equi-biaxial extension:
Stress = G(A^~r^ )
where G = shear modulus, y = shear strain and X = ratio of strained to unstrained length (height).
Rather surprisingly, all these kinds of deformation can be described in terms of a single modulus. This is a result of the assumption that rubber is virtually incompressible (i.e. bulk modulus much greater than shear modulus). Young's modulus E = 3G (for filled rubbers the numerical factor may be in fact as high as 4). Indeed, these relationships by no means fully describe the complete stress strain behaviour of real rubbers but may be taken as first approximations. The shear stress relationship is usually good up to strains of 0.4 and the tension relationship approximately true up to 50% extension.
The fundamental shear and Young's moduli are the slopes of the shear and tension/compression stress/strain curves at the origin. The relationships given above are an attempt, with theoretical justification, to describe the shapes of the stress/strain curves at higher strains. Appreciation of this may avoid confusion between 'the absence of a single modulus figure' for rubber whilst such values are quoted.
It should be noted that the stresses usually used are 'engineering stresses' calculated from the ratio of force and original cross section area whereas true stress is the ratio of the force and the actual cross sectional area at that deformation. Clearly, the relationship between stress and strain depends on the definition of stress used and taking the case of tensile strain, for example, the true stress is equal to the engineering stress multiplied by the extension ratio.
It should also be noted that the 'rubber technologists modulus', i.e. the tensile stress corresponding to some arbitrary elongation, is not a modulus at all, but many technologists still insist on using the term.
The relationships resulting from the statistical theory fall well short of fully describing the stress strain curves of filled rubbers. From the alternative phenomenological approach a general relation for W is given by:
^ = E(Q[^-3]'x[^2-3r)
where / and / are strain invariants which are defined in terms of the I 2
extension ratio (X) of the rubber in the three principal axes as:

112 Physical testing of rubber
1 1 1 ^ QZ -12 0 2
/t, ^2 ^3
C. are the coefficients of the function where i and j take integer values ranging from 0 to infinity.
It is again imphcit in this function that the rubber is incompressible (i.e. / jA2/l3 =1) and isotropic.
The most basic simplification of this generalized equation is to take the first term which gives the neo-Hookean model:
W = C{I,-2>)
This is equivalent to the model derived from the statistical theory and gives linear behaviour in simple shear.
A very common simplification of the equation is generally referred to as the Mooney-Rivlin equation and consists of the first two terms and written in the form:
PF = C , ( / , - 3 ) + C , ( / , - 3 )
where the constants C and C are usually referred to simply as the "Mooney-Rivlin constants".
As the stored energy is the area under the stress-strain curve, we can derive the stress-strain curve predicted by this phenomenological model from the differential of W relative to strain. In simple tension this comes to:
In simple shear:
c7 = 2 r ( C , + C , )
where y is the shear strain is simple shear.

Short term stress-strain properties 113
In pure shear:
CT = 2 ( C , + C , ) ( A - ^ ) A
In equibiaxial tension:
cr = 4(Ci+C2A')(A--V)
The use of the Mooney Rivlin equation and alternative relations will be considered in Section 3 on data for finite element analysis.
In compression there is not often perfect slip at the compressed ends and a general relationship for compression with bonded ends is:
Compressive stress = G{X - X~^ )Z
where Z is a shape factor which is a function of the dimensions of the test piece and modulus.
2
The shape factor term is usually seen as (1 + 2S ) where S is the ratio of one bonded surface to the free surface. A useful review of the compression of rubber blocks is given by Gent .
The statistical theory gives the relationship for indentation by a rigid ball in the form:
3/2 1/2
F/E = K P R
Scott produced an empirical relationship (for indentations up to 0.8 of the ball diameter) as:
or
— = 1 9p> 35^065
E

114 Physical testing of rubber
Expressions have also been derived for a flat ended cylinder:
P = k^
and a cone:
fF
d -I
0.5
where F = force, K = numerical constant, R = radius of ball, P = depth of indentation, d = diameter of cylinder, ki, ka and ka are constants, k^ involving the angle of the cone.
A truncated cone of fairly small angle behaves roughly like the cylinder. Briscoe et al" have quoted relationships for a number of indentor geometries and considered the effect of geometry in detail.
For torsion, where deformation is essentially in shear, the relation for a strip much wider than its thickness is:
Lwt^G0 Torque = —
where k^ = function of width and thickness of strip, w = width of strip,
t = thickness of strip, 9 = angle of twist and L = length of strip. It will be appreciated that in the relations considered above the rubber
has been treated as a perfectly elastic material, whereas in practice there several factors that cause departure from pure elastic behaviour. Hysteresis and the Payne effect are considered in Chapter 9, set, stress relaxation and creep in Chapter 10 and the Mullins effect was covered in Chapter 5.
2. POISSON'S RATIO
When a material is stretched there is also contraction in the direction perpendicular to the direction of stretching. The ratio of the lateral contraction to the longitudinal extension is Poisson's ratio. For incompressible materials, Poisson's ratio is 0.5 and as rubbers are very nearly incompressible they have values close to this.
Methods have not been standardised for measuring Poisson's ratio for rubber but the most obvious approach is to use a second "extensometer" to measure the change in the width of the test piece during a normal tensile test.

Short term stress-strain properties 115
Since the lateral contraction is half the tensile strain and the width of dumbbells is much smaller than the gauge length, a very high performance is needed from the "extensometer" to achieve sensible accuracy. Not surprisingly, accurate measurements have proved very difficult to obtain.
Alternative procedures are to use a dilatometer to measure volume change or to calculate Poisson's ratio from measurement of two moduli. Laufer et al concluded that for soft rubbers the dilatometer is the best approach and describe a suitable apparatus. Kugler et al have given a review of attempts at measurement and describe an optical system which they employed on a series of filled rubbers. It would seem reasonable that modem instrumentation, such as a video extensometer, could be used but this does not appear to have been reported.
Perhaps the most reliable approach is to obtaining Poisson's ratio is to calculate it from bulk and Young's or shear moduli (see Sections 6, 5 and 8 respectively).
3. DATA FOR FINITE ELEMENT ANALYSIS
The main interest in finite element analysis from a testing point of view is that it requires the input of test data. The rise in the use of finite element techniques in recent years is the reason for the greatly increased demand for stress strain data presented in terms of relationships such as the Mooney-Rivlin equation given in Section 1 above.
Simple hnear FEA programmes, as used for stress analysis of metals, take Young's modulus and Poisson's ratio as input but this is not satisfactory for rubbers because the strains involved cannot be considered as small and the Poisson's ratio is very close to 0.5. Non-linear FEA programmes for use with rubbers take data from a model such as the Mooney-Rivlin equation. More sophisticated programmes will allow a number of models to be used and may also allow direct input of the stress strain data.
For gum rubbers and lightly filled compounds, the Mooney-Rivlin equation often models the tensile stress-strain curve well up to extensions of 150% or more. However, for more highly filled compounds (and almost always for commercially important compounds) this simple function only works well up to about 50% strain. A much better fit over an extended strain range can be obtained by taking the next logical term in the infinite series of the general expression. Using:
PF = C, (/, - 3) + C, (/ , - 3) + C3 (/I - 3))(/, - 3)

116 Physical testing of rubber
experience at Rapra is that the stress-strain curve can usually be modeled quite accixrately to strains in excess of 100%. An illustration of the modeling is shown in Figure 8.1.
2.0
1.5 H
C/0
• Experimental Data 2-term function 3-term function
1.0 1.5 2.0
Extension Ratio
2.5
Figure 8-1. Mooney-Rivlin functions
This model does not seem to be in general use but several others have been developed and there is a large volume of literature on the subject. Kent demonstrated results with alternative relationships several decades ago while Turner and Brennan^ found Mooney-Rivlin and equations derived from a Poissons ratio approach to be satisfactory at strains of engineering interest in tension. Papers giving discussion and comparison of models include those in references 9-16 and there are proceedings of conferences on constitutive models for rubber^ ' ^ .
There is a British standard^^ giving guidance on the application of rubber testing to finite element analysis. Several of the models for stress strain behaviour are appraised and advice given on selection. The point is made that the models considered treat the rubber as a perfectly elastic material,

Short term stress-strain properties 117
whereas in practice there several factors that cause departure from pure elastic behaviour. Models that take account of one or more of these factors are under development and modeling of hysteresis is implemented in some FEA programmes.
Data can be obtained from tests in uniaxial tension, uniaxial compression, equibiaxial tension, pure shear and simple shear. Relevant test methods are described in subsequent sections. In principle, the coefficients for a model can be obtained from a single test, for example uniaxial tension. However, the coefficients are not fully independent and more than one set of values can be found to describe the tension stress strain curve. A difficulty will arise if these coefficients are applied to another mode of deformation, for example shear or compression, because the different sets of values may not be equivalent in these cases. To obtain more robust coefficients it is necessary to carry out tests using more than one geometry and to combine the data to optimize the coefficients.
In choosing tests, it can be noted that equibiaxial tension is equivalent to uniaxial compression and also that pure and simple shear are equivalent so that no new information is gained by using both of each pair of geometries. By far the most popular geometry is uniaxial tension because of its experimental simplicity. Pure shear is also straightforward to measure, requiring no special apparatus, but for simple shear it is necessary to mould and bond the rubber to end pieces. Equibiaxial tension requires either a special straining jig to stretch the test piece in two directions or an apparatus to inflate a sheet and make strain measurements on a curved surface. Uniaxial compression appears simple but in practice there are the problems of getting perfect lubrication and measuring small deflections, and it is restricted to relatively small strains. BS 903-5 recommends uniaxial tension and pure shear for accurate results at minimum effort but notes that biaxial tension is very useful for applications involving very large strains.
Various considerations when producing data have been discussed by Kim et al . An experimental scheme for efficient characterization has been proposed^^ and an intermediate approach between using simple uniaxial tension and two independent strains to obtain input data given^ . A novel technique based on use of a speckle extensometer to give the whole displacement field in two dimensions has also been described^ .
The test conditions of temperature, strain rate and level of strain should reflect those that will be seen in service. This might involve making tests at more than one temperature and strain rate, although modulus is relatively insensitive to strain rate. With respect to strain level, BS 903-5 points out the need to take into account the fact that local strains may be rather higher than the overall strain. When data is obtained using more than one mode of deformation, the test conditions should be consistent with respect to strain levels, strain rates etc. It is also self evident that the test pieces should be produced in the same manner and their state of cure should be equal -

118 Physical testing of rubber
although this may not be easy if compression or simple shear is chosen as one method.
Unless the model used can satisfactorily account for strain history it is sensible to obtain data under conditions relevant to the service situation by applying, where appropriate, mechanical conditioning before testing. For a product that is only strained occasionally, taking data from results for a previously unstrained test piece at low strain rate would be reasonable, whereas for dynamic stress strain conditions taking data after several conditioning cycles would prevent an overestimate of stiffness. The effect of conditioning depends on the level of stress applied and BS 903-5 suggests a rather involved procedure to take account of this.
If data is needed for the more sophisticated viscoelastic models now being introduced then results from forced vibration dynamic tests (Chapter 9) or stress relaxation tests (Chapter 10), as appropriate, would be used.
4. HARDNESS
A hardness measurement is a simple way of obtaining a measure of the elastic modulus of a rubber by determining its resistance to a rigid indentor under an applied force. It is such a simple concept that in its most crude form it could be, and probably was, a matter of prodding the rubber with a finger. It is not surprising that such a simple concept requiring relatively simple apparatus was one of the first and also the most commonly used rubber tests. It is also easy to understand why much effort was put in over the years to developing and standardizing hardness test methods and instruments. This development is a fascinating subject, there having been an amazing variety of instruments, most of which are now a matter of history. For an account of these, reference should be made to the work of Soden " .
The apparently simple process of indentation involves deformations in tension, shear and compression but, as in the case of a perfectly elastic rubber the moduli controlling these are closely related, it is convenient to regard hardness as depending simply on Young's modulus. Approximate relationships for various geometries of indentor have been given in Section 1 and will be further considered, where appropriate, for the standard methods in later sections.
It would be convenient to have a hardness test where a given difference in indentation always represented the same proportionate difference in modulus (i.e. P a linear function of log E). None of the indentor shapes considered in 1 achieves this with a constant loading force. The cone has the additional disadvantage of being especially prone to damage, a criticism which also applies to the plunger and truncated cone. Because of this and the fact that accurate hardened steel balls are readily obtainable, most tests.

Short term stress-strain properties 119
including the standard ones other than the Shore durometers, use a ball indentor.
The indenting force could be applied in three ways: (a) Application of a constant force, the resulting indentation being measured. (b) Measurement of the force required to produce a constant indentation. (c) Use of spring loading, resulting in variation of the indenting force with depth of indentation.
Referring back to the equation given for indentation by a ball, it would appear that method (b) is ideal because the measured force should be proportional to modulus. Modem force transducers would make this measurement very convenient but the method was not adopted, presumably because when standard methods were being established the measurement of force would have been a severe complication. All pocket instruments use a spring loading system, which does in fact enable a much closer to linear relationship between P and log E to be realised. However, springs are not well thought of as precision measuring elements and the net result is that the internationally recognised reference standards use weights to apply a constant force.
The idea of measuring hardness under constant deformation has not been completely forgotten. Kucherskii and Kaporovski^^ noted the disadvantage of the present hardness tests in not having a hnear relation with modulus. For example, from 40 to 80 IRHD is a factor of 2 but represents a factor of 5.8 in stiffness. They suggested using a constant indentation and measuring the force required using either a load cell as in a universal testing machine or a novel pneumatic device. The latter would also be robust in a factory environment.
It is interesting to consider hardness as an example of how mechanical tests for rubber have, or have not developed. Firstly, despite the very imprecise relationship with modulus and the lack of any fundamental significance, hardness measurements have continued to be used and even now new ones are being introduced. The far more sensible method of measuring force to produce a given deformation, which would also allow stress relaxation to be conveniently measured, has not been adopted. However, the instrumentation has been updated so that the old measure can be made with electrical transducers and fed directly to a computer. On the other hand, perhaps the fact that hardness is a non-destructive method that can be applied to virtually any product is justification that it should thrive.
4.1 Introduction to rubber hardness tests
An ISO standard^^ has very recently been published that gives an

120 Physical testing of rubber
introduction and guide to hardness testing of rubbers. The objectives are to provide an understanding of the significance of hardness tests and to give advice on selection of an appropriate test method for those less familiar with the subject.
The principle of a hardness test is illustrated in Figure 8.2. The load, which may be produced by a weight or a spring, acts on the rubber through an indentor of defined geometry. The resulting indentation is measured with a displacement transducer (traditionally a dial gauge).The indentation is measured relative to the test piece surface and, in order to define this, an annular foot of specified dimensions and exerting a specified load surrounds the indentor. Also, because of the uncertainty of defining the surface position of a soft material, the "zero" reading of the indentor may be taken with a small specified contact force (not shown) and the indenting force applied in addition.
1 Mass or spring to apply force 2 Indentor 3 Test piece 4 Displacement transducer 5 Foot surrounding indentor
Figure 8-2. Principle of a hardness test

Short term stress-strain properties 121
The standard briefly covers the significance of hardness in terms of its relation with modulus, and the practical use of hardness tests. The hardness tests for rubber that are standardized by ISO are introduced and the distinction between dead load and durometer type instruments is explained to help with selection of a test method for particular circumstances. The effect of test piece, use of standard hardness blocks and comparison of hardness scales is also outlined.
One thing the guide fails to do is to unite all the standard ISO methods described below into a logical series. Hence, the dead load method is called Method of determination of hardness whilst the durometer methods are under a separate number and headed Determination of indentation hardness. Methods for hardness of rollers come under a third number.
4.2 Dead load tests
4.2.1 IRHD method, normal scale
The internationally accepted standard dead load method is given in ISO 48^ which covers rubbers in the range 10 to 100 IRHD (International Rubber Hardness Degrees). The normal scale is preferably used for rubbers in the range 35 to 85 IRHD but can be used from 30 to 95. For the normal test a ball indentor of 2.5 mm diameter is used, acting under a total force of 5.7 N. The zero reading of the indentor is taken with a contact force of 0.3 N. The annular foot is specified to act under a pressure of 30 kN. Because the indentation would gradually increase with time due to creep, readings are taken after the arbitrarily fixed time of 30 sec after applying the indenting force. It should be noted that the indentor must act essentially without friction and in the usual design of apparatus the test piece is gently vibrated in the hope of overcoming any slight residual friction. Dusting the test piece with talc is used to reduce any friction between indentor and test piece.
The hardness reading obtained is to some extent dependent on test piece thickness and, certainly, the effect will be very marked if very thin test pieces are used. The standard thickness is given as 8 to 10 mm but tests may be made on thicknesses down to 4 m.
The indentation is usually measured with a gauge or transducer with its scale directly calibrated in International Rubber Hardness Degrees (IRHD). The IRHD scale owes a lot to the desire to have readings equivalent to the Shore A scale (see Section 4.3), which was originally very popular, and to represent increasing hardness by increasing numbers (indentation decreases with increasing hardness). The basis of the IRHD scale is a probit (integrated normal error) curve relating log (modulus) to hardness (Figure 8.3) and this curve is reproduced in the standard together with a table of indentation against IRHD. The curve is defined by the value of logio modulus at the mid

122 Physical testing of rubber
point and the maximum slope of the curve, and results in a scale which is in reasonable agreement with the Shore A scale.
97-8
9 2 6
87-6
81-2
7 2 9
6 3 4
d ^' 51-7 Q:
40-6
29-8
20-9
8-6
3-2 — J
100
90
80
70
60
50
40
30
20
10
0 0 0 4 0-8 1-2 1-6 2 0 2-4 2-8 LoQiQ E ( E-fxprM8«d in bar )
Figure 8-3. Probit curve relating logarithm of Young's modulus, E, and hardness in IRHD
The modulus is calculated from the indentation by means of a form of the Scott formula for indentation by a ball given earlier with the constant to suit the SI units. An amendment to ISO 48 was produced in 1999 when Hawley^^ pointed out discrepancies between Table 3 in the standard and the information given in the annex. The investigation into the discrepancy makes very interesting reading as a series of errors were found. The probit curve reproduced in Figure 8.3 was found to have small but inconsistent errors which Hawley concluded resulted from taking readings from a hand drawn graph. It was then shown that the formula given in the annex was wrong due to the units for the indentation being in hundredths of millimeters and not millimetres as stated. Finally, it was realized that the equation given had been wrongly derived from Scott's work by assuming that the contact force was zero. The relation taking account of a contact force is:

Short term stress-strain properties 123
D = 6l.5R -0.48 F 0.74 ^ ^^^0.74
E
where D is indentation in hundredths of a miUimeter, R is radius of the ball, E is Young's modulus, F is the total indenting force and f is the contact force.
In practice, the relationship between hardness and Young's modulus as given by this formula is not reahsed within a reasonable tolerance and there are other empirical and theoretical formula. Stiehler^^ et al demonstrated the dependence of the exponent 1.35 on the radius of the indentor. Yeoh^^ has examined the accuracy of three formulae and suggests that discrepancies can occur simply from the way in which Young's modulus for a rubber is defined and measured. Further discrepancies can be expected with rubbers which are far from perfectly elastic. Briscoe et al" studied a range of indentors and considered the effect of indentor defects on the relationship of indentation and modulus. Busfield and Thomas^ carried out both experimental determinations and a finite element analysis. They considered several models and also the effect of test piece thickness. Their results indicated that the basic Hertz relation was better that that derived by Scott and they found that the effect of friction was important at low hardness. The conclusion must be that it is most unwise to rely on a modulus derived from a hardness test, at least unless a particular definition is given to modulus and a formula which is compatible with that definition is used.
4.2.2 High and low scales
For hardness above 95 and below 30 IRHD the normal standard method is not very satisfactory. In either case a very small change in hardness number results from unit change in indentation. At the high end the indentation needs to be increased relative to the standard test to give better discrimination and at the low end the indentation needs to be decreased to prevent excessive deformation of soft rubbers.
ISO 48 specifies the range 35 to 85 as preferable for the normal method but allows its use between 30 and 95. For 85 to 100 a high hardness method is given by specifying a smaller, 1 mm diameter, ball acting under the same force and with the same foot as normal. Similarly, there is a low hardness method for 10 to 35 using the same force but increasing the ball diameter to 5 mm and, in consequence, changing the foot to accommodate the ball. Extensions of the probit curve and the table relating indentation to IRHD are given. These two methods were previously given in separately numbered standards.
Increasingly, very soft compounds are being used in, for example.

124 Physical testing of rubber
medical applications and provision for extending the IRHD scale downward is desirable. At the time of writing a draft method is being discussed in ISO TC 45 that covers a "supersoft" scale which is based on a linear approximation of the IRHD scale and uses a total force of 100 mN on a 2.5 mm ball.
4.2.3 Micro tests
For testing small products, and in particular those having a thickness of less than 4 mm, the standard dead load test is altogether too large. Consequently, micro tests have been developed and a standard procedure is included in ISO 48. The test is essentially the same as the normal test but uses a 0.395 mm diameter ball with 153.3 mN total force and an appropriately reduced foot. The standard test piece thickness is 2 mm but ISO 48 points out that for various reasons the micro test will not always give the same result as the normal test, even when both are made at their respective standard thicknesses, and sometimes these differences can be quite large. Differential cure through the thickness and the greater effect of the outer layers in a micro test are obvious factors to cause discrepancies.
The micro test is often preferred even when there is no shortage of material. It allows the standard 2mm thick test sheets to be used, hence saving the trouble and expense of an extra moulding which might also have a different degree of cure. In particular, it is invaluable when the change in hardness is used as a measure of the effect of ageing or weathering because the restriction on oxygen diffusion would be much less than in the normal test piece. A further use is to takes thin sections from a thick object to investigate cure level as a function of thickness.
Although the micro and normal tests are the same in principle, the apparatus used can differ considerably. Whereas the normal hardness instrument can have a straightforward mechanical arrangement of the weights for the major and minor loads bearing on the indentor, the problem of accurately measuring the much smaller indentations involved in the micro test and the greater effect of even small amounts of friction mean that a rather more complex apparatus is necessary. The principle of the rather ingenious way in which the Wallace micro hardness tester, one of the earlier very successful instruments, operated is shown in Figure 8.4.
The vertical movement of the specimen table is magnified by a 6:1 sliding wedge which compensates directly for the indentation being one sixth of that in the standard test. The table is moved to return the indentor to its position before application of the load, the null point being detected by an AC bridge circuit. The movement of the table effectively measures the indentation but the indentor, being suspended on leaf springs, is not subject to friction and the springs contribute no force in the null position.

Short term stress-strain properties 125
Major load
Minor load
Figure 8-4. Principle of a way of measuring micro hardness
4.2.4 Apparent hardness
It has been stated previously that hardness readings are influenced by test piece thickness. Consequently, the term standard hardness refers to measurements made on standard test pieces, and measurements on non-standard test pieces are called apparent hardness.
Generally, the apparent hardness will increase as the test piece thickness is reduced because of the effect of compression against the rigid test piece support.
Corrections to hardness readings to compensate for test piece thickness are not entirely satisfactory because the effect varies from rubber to rubber; however, typical readings are shown in Figure 8.5. Bassi et al ^ have derived relationships between thickness and Shore A hardness and demonstrated their agreement with experiment.
If readings are taken too near the edge of a test piece there will be an 'edge effect' and, consequently, minimum distances from the edge for various thicknesses are given in ISO 48. An infinite block would of course be an ideal test piece for both the thickness and edge effects but, to say the least, is impractical.

126
5 6 8 10
Thickness (mm) 12 15 20 25
Figure 8-5. Effect of test piece thickness on hardness reading. Solid Hne, IRHD; broken Une Shore A
It is often necessary to make hardness measurements on curved surfaces, e.g. rollers or 'O' rings. In the first example the product may be large enough for the hardness instrument to rest upon it, whilst in the second it would usually be possible to rest the product on the specimen table. In either case, some form of jig is required to locate the test piece and suitable examples and precautions to be taken are described in ISO 48. Any of the standard methods could be used for curved surfaces except that it is not possible to use a foot on concave surfaces. For large cylindrical surfaces, the hardness tester is either fitted with feet movable in universal joints which rest on the curved surface or the base of the instrument is fitted with two cylindrical rods which rest on the curved surface. The latter method can be used for surfaces with radius of curvature down to 50 mm. For surfaces having double curvature, only the method using movable feet is suitable. For small products and where the radius of curvature is too small to rest the instrument on the surface, the 'test piece' is placed on the base of the instrument as with

Short term stress-strain properties 12 7
the standard test piece and held so as to prevent bodily movement of the surface.
A comparison of methods for holding small 'O' rings for micro test has been made ^ which also describes a novel device using metal 'fingers' which proved very satisfactory.
The particular case of the hardness of rollers is covered by ISO 7267 ' " ^ which is in three parts dealing with the normal dead load method, Shore durometer and the Pusey Jones methods respectively. This last method is a very old hardness test which is now virtually never seen, although it is understood to still be popular in some circles for rollers. It is an amazing brass and chain contraption that uses a 3.175 mm indentor acting under a load of 1kg and without a surrounding foot.
4.2.5 British and ASTM standards
The British standard for hardness^^ is identical to the ISO methods. ASTM D1415^^ was reapproved in 1999 but it is still technically the same as a very old version of ISO 48 - why it was not updated defies logic. This means that there is no coverage of high and low scales and there is still the option of a 2.38 nmi ball. Also, the relation with modulus is written in a slightly odd form. Curved surfaces are not covered in D1415 but there is a separate standard D1414^^ for 'O' rings which has a section on measuring hardness. The term apparent hardness is not used and reference is simply made to the micro IRHD test and to the use of a durometer (see below) with a jig to aid alignment. The Pusey and Jones test is described in ASTM D531" ^ but is not particularly aimed at rollers and gives a standard test piece as a block of minimum thickness 13 mm. BS 7442 - ^ is identical with ISO 7267 for hardness of rollers.
4.3 Durometer Tests
The term durometer is used for the small 'pocket-type' of hardness meter which, in a myriad of shapes and sizes, has been in common use virtually as long as the rubber industry has existed. The main difference between durometers and the dead load tests is that the former utilise a spring to produce the indenting force. Because of this, and because of variabihty due to the instruments being hand held, durometers are widely considered to be not as precise or as reproducible as the standard dead load instruments. However, it should be noted that great improvement can be made by fixing the durometer to a stand and applying the foot pressure by a weight rather than hand. This defeats the object of having a "pocket" instrument but in some countries a Shore A durometer used in this way is at least as popular as the international dead load method.

128 Physical testing of rubber
For many years there was no move to produce an international standard for durometers but one was eventually published in 1986. ISO 7619 is now in two parts" " ' ^, separating a meter calibrated in IRHD from the others. Part 1 now covers the Shore A and D type meters, a meter designated AO for soft materials and a micro Shore type meter designated AM. The Shore A scale corresponds approximately to the IRHD scale and the D scale can conveniently be used for hard rubbers above about 90 Shore A. The AO meter is suitable for rubbers less than 20 Shore A, whilst the AM meter covers the normal Shore A range. As expected from its name, the meter in Part 2 of the standard covers the IRHD range.
The mechanism by which the spring pressure is applied and the indentation measured varies, but Figure 8.6 shows, as an example, the principle of the IRHD meter. The type A meter uses an indentor in the form
Spring
Indentor
Figure 8-6. Example of durometer mechanism
of a truncated cone, types D and AM use a cone with a rounded end, whilst type AO and the IRHD meter use a hemispherical indentor. A clear advantage of the hemispherical geometry is the elimination of the problem of rapid wear on the Shore indentors. For the A, D, AO and AM meters, there is a defined relation between spring force and hardness, i.e. the spring

Short term stress-strain properties 129
force varies with indentation. The IRHD meter is different in that the spring pressure is essentially constant over the whole range, varying by 0.15 N in a 2.65 N mean force as against between 550mN and 8050 mN in the Shore A, and it is this feature that enables it to mimic the standard IRHD scale.
A significant change in the latest version of ISO 7619-1 (apart from the introduction of types AO and AM) was the tightening of the tolerances on the indentor and foot geometry and the spring force. For example, the tolerance on the truncated cone diameter for type A went from 0.03 to 0.01 mm and the spring force tolerance from 80 to 37.5 mN. These new tolerances are intended to improve the accuracy of measurements (see Section 4.4) but are likely to cause very considerable problems with existing instruments not complying and making the process of calibration more difficult. The tolerances for the IRHD meter were not changed although a good case could have been made to reduce the tolerance on the spring pressure.
A minimum thickness of 1.5 mm for the type AM and 6 mm for the other instruments is specified. The standard time of application of the load is 3 sec for vulcanized rubber and 15 sec for thermoplastic rubbers, which is a change from the instantaneous reading specified previously. This is of course arbitrary and a compromise between "instantaneous", which is very uncertain, and long enough for equilibrium to be assured, which is time consuming. It is recognized that other times may be used and, in practice, there will be those who prefer instantaneous readings and those who use 30sec as for dead load methods. Also, when testing products, all manner of unreasonable test piece geometries are used, resulting in many instances in very large variabihty. The effect of time is considered further in Section 4.5.
The use of durometers on a stand is supported in 7619-1, reflecting the practice of using them as an alternative to IRHD. In fact, type AM is specified as always being so used, which completely negates it being a portable instrument. When used on a stand, there are requirements for a timer, the load on the foot and speed of application. Also, the instruments can use any suitable transducer to measure indentation and be connected to a computer in the same way as for dead load testers.
The standard does not consider the relation between the Shore scales and modulus but this has been investigated by Briscoe and Sebastian" ^ and Qi et
The UK voted negatively on the ISO 7619 standards and at the time of writing the British standard, BS 903 Part A 57^^ is the same as the 1997 version of the ISO standard. This means it does not include the AO and AM types and does not have the reduced tolerances.
Durometers are also covered in ASTM D2240' ^ which specifies no less than eleven scales, A, B, C, D, DO, E, M, O, 0 0 , 0 0 0 and 000-S plus R referring to a particular foot geometry. A, D, E and M correspond to the ISO types A, D, AO and M, a significant difference being that ASTM has not

130 Physical testing of rubber
introduced the potentially problematic reduced tolerances. An appendix gives a brief selection guide: Types B and C are for harder materials but not as hard as scale D - there is obviously considerable overlap. Type O is for soft and 0 0 for very soft rubbers. Types 0 0 0 and E are not mentioned in the appendix but the former is used for sponge and foam and E (ISO AO) for soft rubber and cellular materials. Type B uses the type D indentor with the type A spring, while type C uses the type A indentor with the type D spring. Types O and 0 0 use a 2.38 mm rod rounded to 1.19 mm as the indentor.
Three different types of stand are specified, a) test piece pushed onto the indentor, b) the indentor pushed onto the test piece and c) as b) but with a damping mechanism. The type M must be used with a type c) stand.
Detailed procedures are given for calibration of durometers rather than taking the line of referencing a separate standard.
4.3.1 Other methods
There was at one time several other hardness meters, both dead load and portable, but any surviving examples will be very rare. There are also variations on the durometers which have been introduced by particular manufacturers, often for very soft materials such as sponge, but they are also not often seen.
A logical progression from micro instruments is to go even smaller so that local structure can be probed, perhaps the ultimate being the use of the atomic force microscope^^. Another progression is to move to a "dynamic hardness test" by cyclically indenting the rubber and this has been reported by Unseld et al ^ with lOOjiim indentations and Neideck et a . Li et al ^ compared micro indentation results with those from dynamic mechanical analysis (see Chapter 9).
4.4 Accuracy and comparison of hardness tests
Hardness tests attract more interest in their accuracy, reproducibiliy and intercomparison than any other test - which is probably a result of them being simple tests which are carried out particularly frequently, and because the situation is confused with several scales. The fact that the situation is far from clear cut owes as much to history as to logic. If the Shore durometers had not been the first hardness meters, it is highly doubtful that we would now have spring loaded instruments mounted on stands or use damage prone indentors. Neither would the IRHD scale have been contrived to mimic the status quo. Such is the effect of powerful established interests.
It is often asked how the readings on pocket durometers agree with those of the standard dead load instruments. The answer must be that agreement is at best approximate because, regardless of any theoretical relationship and

Short term stress-strain properties 131
however carefully the durometer is set up, variations due to the operator, the time of application and the thickness of the test piece, plus the fact that filled rubbers will deviate from elastic behaviour, inevitably result in scatter of comparative results. Figure 8.7 shows the approximate relationship between Shore A and IRHD and between Shore A and D.
100
90
80
70
60
50
40
SHORE D 20 40 60
1 1 1
- SHORE A/SHORE D ^^.^^
/
/
L Z 1 1 1
80 100 —1 1
/ SHORE A/IRHD
_ _ j 1 1 1 30 40 50 60
IRHD 70 80 90 100
Figure 8-7. Approximate relationships between Shore A, Shore D and IRHD scales (test piece 10 mm thick)
ISO 48 contains a precision statement giving figures for the reproducibility found in an interlaboratory comparison which are certainly larger than desirable. In one trial " conducted many years ago the range of variation between five operators on the same rubber averaged 5° for a Shore durometer, 3° for a Wallace durometer but only 1.5° for a dead load instrument. Spetz^^ made a careful study of reproducibility of hardness measurements involving an interlaboratory comparison in which each participating laboratory was visited and analysis was made of causes of

132 Physical testing of rubber
differences. He concluded that operator variability was the largest problem. Brown and Soekamein^^ systematically evaluated the parameters which
could affect reproducibility and their results again imply that the operator or lack of calibration must account for many of the differences found in practice. They did, however, conclude that the durometers could give differences of up to ±3^, even when calibrated within specification, compared to no more than ±1^ for the dead load method. With the new tolerances in ISO 7619-1, the reproducibility of durometers should in theory reduce to the same level as IRHD.
The reproducibility worsens at higher hardnesses where the indentation is relatively small and the IRHD and Shore scales are less sensitive to modulus change. Kucherskii and Kaporovskii^^ have made a detailed study of hardness in the high region. They demonstrate the insensitivity of the present methods and show that there is actually no advantage in having the ISO high hardness method, the normal method giving equally good (or bad) results. They conclude that the only sensible approach is to abandon tradition and use a constant indentation method and express the result as a stress!
Dead load instruments are intrinsically calibrated by provision of the correct forces and the correct indentor and foot dimensions. Durometers require, in addition to checking dimensions, calibration of the spring over its complete range. At the time of writing, a standard for the calibration of hardness instruments is being developed in ISO TC 45 and will become ISO 18898. It extracts all the requirements from the test method standards and outlines procedures for their verification. Standard hardness blocks calibrated against dead load instruments in an accredited laboratory have proved very useful for checks on all hardness meters. They are also widely used, and have been recommended in standards, for calibrating durometers, when they offer a rapid procedure applicable to all types of durometer and also "calibrate" the operator in terms of the hand pressure exerted. However, the best practice is, undoubtedly, to calibrate the essential parameters of all instruments but to also use certified standard blocks as a check at more frequent intervals. This use of blocks is specified in ISO 7619.
The measured hardness decreases with time of load application because rubbers are not perfectly elastic, hence results at different times will not be in agreement. Furthermore, the effect will be material dependent. The effect of time was investigated in some detail for Shore A ^ several decades ago by filming both the durometer on a stand and the stopwatch. This work demonstrated the considerable creep that occurs and concluded that manual measurements should be taken at 30 sec. Measurements were also made with a dead load tester which showed less creep than the Shore because the load is constant and not increasing with indentation.
A similar exercise was undertaken much more recently using a microprocessor controlled Shore meter ^ with emphasis on investigating the viscous component of behaviour, which was found to be very sensitive to

Short term stress-strain properties 133
state of cure. As a linear relation on a log scale was found, it was also demonstrated that hardness at longer times could be predicted from short term tests. This idea was taken up by Lackovic et al ^ to shorten the time needed for the test. They found that good 30 second predictions could be made from a 6 second test and also that the minor load time could be reduced to 1 second, saving a further 5 seconds.
Morgans et al ^ carried out comprehensive trials to compare the IRHD and Shore micro tests concluding that the IRHD was better for very small test pieces but the Shore better for bent test pieces. They also note the fact that the Shore test is not totally non-destructive. This work was continued to include the normal IRHD and Shore A scales and to consider curved surfaces^ . The results are a good illustration of the differences in measured hardness that can be found between different instruments with variation of test piece geometry.
5. TENSILE STRESS STRAIN
After indentation hardness, the most common type of stress strain measurement is that made in tension. The ability of rubber to stretch to several times its original length is one of its chief characteristics but it is worth noting that at least as many rubber products are used in compression or shear as are used in tension. Besides being of relevance for products strained in tension, tensile stress/strain properties have been taken since the beginning of the industry as a general guide to the quality of a rubber; being sensitive to filler or plasticiser content as well as to mixing and curing efficiency.
Standard methods for determining tensile properties of rubbers have evolved gradually and are now in a well-defined state. Essentially, dumbbell shaped, or less often ring, test pieces are strained at a constant rate of traverse and force and corresponding extension recorded. The force readings are expressed as stresses by reference to the original cross-sectional area of the test piece.
A typical tensile stress/strain curve for rubber is shown in Figure 8.8 (this also illustrates the differential strain between the inside and outside of a ring test piece which is discussed later.) It can be seen that there is no linear elastic portion as is usual with, for example, metals, and rubber technologists do not normally measure a modulus as such but quote the stress at various percentage elongations, commonly at 100%, 200% etc. If a figure for Young's modulus was required, this could be obtained from a more sensitive measurement of stress and strain in the very early part of the curve^ .
All the major international and national standards are fundamentally in agreement (the British standard is identical to ISO 37) and it will be

134 Physical testing of rubber
convenient to consider the test method section by section.
20
A
15
E z 2
1 10 B
5
1 1 1 1
-. /
yr-^"*^ ^ \ 1 \ 1
1 1
_J
1 -\
200 400 600 Elongation (%)
800 1000
Figure 8-8. Stress strain curve for pure gum vulcanizate illustrating the difference in stress between the inside (A) and outside (B) circumference of ring test piece
5.1 Form of Test Piece
Two shapes of test pieces are generally used - rings and dumb-bells - and both are covered by ISO 37 ^ and ASTM D412^^ The advantages of rings are that there are no gripping problems, as the ring may be mounted on two pulleys, and that the elongation is easily measured by monitoring the distance between the pulleys. Their principal disadvantage is that the strain distribution in the ring is not uniform and this will be considered in more detail below.
Dumb-bells, on the other hand, are rather more difficult to grip and the measurement of elongation cannot be taken from grip separation as the strain along the whole test piece is not uniform. However, the stress and strain is uniform throughout the central parallel portion of the dumb-bell and, hence, the problem of non-uniform strain in ring test pieces is avoided. In addition, by cutting dumb-bells in different directions, grain effects can be studied which is not possible with rings.

Short term stress-strain properties 135
Largely because of the uneven strain problem, but perhaps also because most laboratories consider rings to be more difficult to cut from sheet, dumb-bells are the most commonly used of the two test pieces.
When a ring is stretched the tensile stress and strain are not uniform over the cross-section but vary from a maximum on the inside circumference to a minimum at the outside. As the ring breaks when the maximum stress equals the breaking stress, the force registered at break does not correspond to the true tensile strength. This was pointed out many years ago and the extent of the non-uniformity is shown in the following figures given by Reece in 1935 ^ for the standard ring test piece:
El 100 200 300 400 500 600 700 800 900 1000 E2 80 163 247 331 415 499 584 668 752 857
where El = % elongation of inside diameter and E2 = % elongation of outside diameter
The effect of the difference between El and E2 on the force at break is shown in Figure 8.7. The approximate 'average' stress is !/2(A+B) which is the apparent tensile strength and may be considerably less than the true tensile strength, A. The discrepancy may be as much as 33%^^ and will vary with the steepness of the final part of the stress/strain curve. Although this may not be serious in pure quality control testing, the variation with slope of the stress/strain curve could make comparisons between different rubbers invalid.
ISO 37 specifies two rings, the well known 'Schopper' ring of 44.6 mm internal diameter and 52.6 mm external diameter and a smaller ring of 8 mm internal diameter and 10 mm external diameter. The preferred thicknesses are 4±0.2 mm and 1±0.1 mm respectively. ASTM D412 has four rings. These are the two ISO rings plus rings of 50 mm circumference, 1 mm radial width, and 100 mm circumference, 2 mm radial width. Both rings can have a thickness between 1 and 3.3 mm. Whereas it seems unnecessary to have four sizes of rings, the two peculiar to ASTM have the advantages of being suitable for standard 2 mm sheet and having been designed so that 50 mm of separation is equal to 100 and 50% elongation respectively.
Considerable effort has been expended on selecting the best dumb-bell shape and size, particularly by ISO Committee TC45. The type 1 dumb-bell of ISO 37 with a 6 mm wide centre portion and preferably cut from 2 mm thick sheet is very widely used (Figure 8.9) but the type 2 has gained in popularity simply because it is smaller and, hence, uses less material. The relative width of the centre and ends, and the radii where the two join, affect the ease of gripping and the incidence of shoulder breaks, and these standard dumb-bells were selected as the best compromise. However, the type lA dumb-bell used in Japanese standards has now been introduced because it has been shown to exhibit less frequent breaks outside of the gauge length

136 Physical testing of rubber
and finite element analysis shows that it does not have a stress concentration at the end of the parallel portion, as do types 1 and 2. The evidence for this is given in an annex and also in a conference paper . It should be noted that one reason for less breaks outside the gauge length for type lA is that the gauge length takes up the whole of the parallel portion. A need has been found for even smaller dumb-bells and Types 3 and 4 have now been introduced which have overall lengths of only 50 and 35 mm respectively. ASTM D412 includes the ISO type 1 but not the types lA, 2 and 3 and 4 in the six dumb-bells it lists! The type 1 is normally specified and it is not clear when the other five might be used. There are no very small dumb-bells but for small amounts of material the use of strip test pieces is allowed.
^
1 7 ^ 7 _
Dimension A Overall length (min) B Width of ends C Length of narrow portion D Width of narrow portion E Transition radius outside F Transition radius inside Gauge length
^
A
•C •
D
Typel 115 25 ±1.0 33 ±2
k
6 + 0.4/-0 14±1 25 ±2 25 ±0.5
Type \I 100 25±0.f 20 ± 21-5 ±0.1 11±1 25 ±2 20±0.f
V Type 2 75
; 12.5 ±1 0 25 ±1
4±0.1 8 ±0.5 12.5 ±1
5 20 ±0.5
,
— • •
L
B
: ;
Type 3 50 8.5±0.f 16±1 4±0.1
Type 4 35
) 6 ±0.5 12 ±0.5 2±0.1
7.5 ±0.5 3 ±0.1 10 ±0.5 10 ±0.5
3±0.1 10 ±0.5
Figure 8-9. Dumb-bell test piece dimensions (mm)
In the interests of standardisation it is desirable to limit as far as possible the variety of test piece sizes allowed. Success in this direction has not always been possible, as illustrated by the tensile test pieces detailed in ASTM D412. However, there would be no need to limit dimensions at all if it were not a fact that the size of test pieces can affect the magnitude of the result obtained, or at least the variability. In the case of tensile tests, the difference in level between results from rings and dumb-bells has already been mentioned. The variability of the two types of test pieces has been found to be similar. The measured tensile strength has a tendency to decrease with increasing cross-sectional area of the test piece and it is desirable to make comparisons only between groups of test pieces of nominally the same type and thickness. The difference between the results from type 1 and 2 dumb-bells is not normally significant but Bartenev and

Short term stress-strain properties 137
Gut^ found the tensile strengths of a butadiene-styrene rubber to be 21, 27 and 37 kg/mm for test pieces 2.2, 1.2 and 0.4 m thick respectively, and in an ISO comparison^^ there were highly significant differences between miniature dumb-bells and the ISO type 2 using thicknesses from 0.7 mm to 2 mm. A careful study of the phenomenon has been made by Nazeni^ . The ISO and British standards call for a preferred thickness of 2 ± 0.2 mm which implies that results are critically dependent on thickness. An unpublished report to ASTM found no significant difference over the range 1.3 to 3.3 mm but this was based on one type of material only.
Ring test pieces can be made by four methods: (a) stamping from sheet (b) cutting with revolving knives from sheet, (c) cutting from tube on a lathe, and (d) by moulding. Method (a) is not really satisfactory for a 4 mm x 4 mm cross section and method (b) is probably the most widely used. Cutting from tube has the inherent inconvenience of the need to first obtain the tube, and in any moulding method care must be taken to avoid interference from flash. Considerable detail of a rotating cutter for rings is given in ASTM D412, whereas ISO 37 only gives an apparatus for small rings - which are considered especially difficult to cut.
Dumb-bells can usually only be stamped or moulded, but the latter method is little used. Stamping is satisfactory using a sharp die if the thickness is restricted to 3mm for a type 1 dumb-bell and 2.5 mm for a type 2.
Any imperfections in the cut edge are potentially sites for premature failure. Patrikeev et af have investigated the effect of artificially introduced nicks as well as the effect of test piece width. Their paper is difficult to follow but, apparently, the critical depth of a nick (above which strength is affected) ranges from 0.1 to 0.9 mm for different rubbers! They also found a strong dependence of strength on test piece width, the magnitude again depending on rubber type. Deuri and Bhowmick' ^ also studied the effect of flaw size on tensile strength and found no critical cut length for some materials and, hence, strength decreased even with very small flaws.
5.2 Measurement of Test Pieces
The measurement of dimensions is covered in chapter 7. It is, however, necessary to stress the importance of accurate measurement of the small cross-sectional area of tensile test pieces.
For dumb-bells it is usual (see ISO 37) to take the width as the width of the die from which the test piece was cut, although for accurate work the test piece could be measured by a non-contact method. ISO 37 states that the width of rings should be measured using the standard gauge fitted with suitable curved feet, the nominal distance between the cutters not being precise enough due to distortion of the rubber during cutting. ISO 37

138 Physical testing of rubber
previously stated that for precise work the ring cross section was to be calculated from its mass, density and mean circumference, but that begs the question of whether the circumference can be measured accurately. Measurement of circumference is not particularly easy and the usual method, as now given in ISO 37, is to use a suitable graduated cone. The ASTM procedures are essentially the same.
5.3 Apparatus
5.3.1 Tensile machine
Sample preparation and measuring apparatus has been discussed and hence this section will deal with the principal item, the 'tensile machine', together with grips and extensometer. The 'tensile machine' is in fact very often a universal machine in that, apart from tensile tests, it can also be used for flexural, compression, tear and adhesion tests. The basic elements of a tensile machine are shown diagrammatically in Figure 8.10.
Drive screw
Crosshead
Moving grip
n
Load cell
Test piece
Fixed grip
Figure 8-10. Tensile test machine

Short term stress-strain properties 139
One grip is fixed and the other attached to a crosshead which is motor driven so as to extend the test piece whilst the force is monitored by the load cell. The output of the load cell, and an extensometer (or crosshead movement), is fed to a computer.
ISO 37 refers to ISO 5843^^ for specification of the test machine. This standard was produced to avoid the need to attempt description of a complex engineering instrument in a testing standard. It is intended that all test methods using a tensile machine will refer to this document, which specifies requirements quite comprehensively, including tolerances on the measurement of force and extension.
5.3.2 Grips
Rings are held by a pair of pulleys mounted on roller bearings, a mechanism being provided to rotate one or both pulleys automatically during the test. It is not satisfactory to use pegs or fixed pulleys because the rubber does not readily slip over the surfaces and is therefore not uniformly stretched. However, lubricated spindles are specified in ASTM D412 to try and overcome the problem.
Dumb-bells are rather less easy to grip and considerable ingenuity has been devoted to the design of a grip that will hold the end of a dumb-bell with a pressure uniform across its width and adequate to prevent slipping, but without setting up local strains liable to cause failure. The essential design feature is that the grip should close automatically as the tension increases. A widely used and successful design is that due to Gavin shown in Figure 8.11.
The dumb-bell end is held between rollers A, the ends of which pass through slots in the members B and C; the slots in C are horizontal and those in B steeply sloping. By depressing C by hand against the spring D, the rollers are forced apart for the insertion of the dumb-bell; on release the spring pushes C up until the rollers grip the dumb-bell. During the test the tension on the dumb-bell tends to pull the rollers further up and, hence, by reason of the inwardly sloping slots, closer together, thus increasing the grip.
Another mechanical design is a roller closing against a flat plate and in certain extreme cases this type of grip with the dumb-bell wrapped around the roller is the most successful. The alternative to achieving self closing by a mechanical device is to use pneumatic or hydraulic grips where flat parallel faces are pushed on to the dumb-bell end under air or fluid pressure. Although more expensive, this type of grip can be very effective and convenient to use.
Rather surprisingly, lubrication of the dumb-bell ends with talc sometimes improves gripping, presumably by permitting just enough slip to equalise the gripping pressure.

140 Physical testing of rubber
Figure 8-11. Gavin type grips for dumb-bell tensile test pieces
5.3.3 Application of force
The test piece must be stretched smoothly at substantially constant speed and to meet this requirement the drive must have sufficient power to maintain the speed even under maximum force. The standard rate of grip separation is 500±50 mm/min but this does not necessarily mean that the actual rate of strain in the test piece is being kept constant between equally close limits. If the dumb-bell slips in the grips or the loads cell has rather low stiffness, the rate of extension is less than the speed of the moving grip. In addition, with a dumb-bell, the rate of strain is not constant throughout its length. The actual strain rate in the centre narrow portion will depend on the free length of test piece between the grips, on the dumb-bell shape (especially the ratio of widths of central and end portions) and on the shape of the stress/strain curve. Hence, the strain rate in the centre portion will not always be the same in different tests or even constant during one test.
Generally, speed variations of ±10% have a negligible effect on the measured tensile strength at the effective strain rates realised in the standard test ^ (i.e. about 650%/min for large rings and 800-1300%/min for type 1 and 2 dumb-bells). Considering the closeness of results on types 1 and 2 dumb-bells, it is probable that rather larger variations from the arbitrary standard would not be significant. However, it is possible that for thermoplastic rubbers or tests made at low temperatures there could be

Short term stress-strain properties 141
greater sensitivity to strain rate, so it is sensible to avoid unnecessary variation. Very large changes in strain rate will affect tensile properties but there seems to have been little interest in very high rates for rubber since a falling weight driven machine for strain rates between 2.5 and 12.7 m/sec was described^ . Measures of modulus over decades of strain rate can be obtained with dynamic tests as discussed in chapter 9.
Instead of constant rate of traverse, it would be perfectly feasible to use a constant rate of strain testing machine for rubbers, but this complication and expense has never been considered worthwhile.
5.3.4 Force measurement
The days of reading force off the dial of a pendulum force measuring system are long gone (although these are still mentioned in ASTM D412) and tensile machines now use electrical force transducers that feed their signal directly to a computer. This means that there are negligible errors due to inertia or friction and the system is inherently stiff (i.e. there is little movement of the force measuring element). There is also the convenience of multiple force scales and automatic manipulation of data. The sophistication of tensile machines varies and the choice has to be one based on balancing range, accuracy, quality of construction and convenience against cost. It should be noted that increased sophistication of data manipulation does potentially introduce problems of verification of the software as computers cannot make value judgements in the same manner as a trained technician.
ISO 5893 specifies four grades of steady state accuracy and gives reference to detailed methods of verification. ISO 37 specifies Grade 2 which is ±2%. Although ISO 5893 considers dynamic calibration to be too difficult to specify at present, it does give recommendations to ensure that the recording system used with electrical load cells does not introduce significant inertia errors - it is not often realised that recorders may have very significant dynamic errors and, hence, lessen the inherent advantage of an 'inertialess' load cell. Modem instruments use a data capture system and a computer to store the force and displacement data in digital form.
ASTM also specifies a tolerance of ± 2% on force and refers to a calibration standard for force verification of testing machines in general.
5.3.5 Elongation measurement
As with pendulum force measuring systems, the use of a ruler or a piece of string to measure elongation of dumb-bells is largely history- to the relief of technicians whose fingers were frequently stung by the recoiling halves of the test piece after rupture.
As long as the deflection of the load cell is insignificant, the elongation

142 Physical testing of rubber
of rings can be taken as the crosshead movement. Alternatively, the pulley centre to centre distance can be measured. For dumb-bells, some form of recording extensometer is needed because the distance between the grips does not bear a simple exact relationship to the elongation of the rubber in the central test length and it is necessary to follow the movement of two marks placed on this narrow central part. The gauge length should be central on the narrow portion of the dumb-bell and 25 mm long for a type 1 dumbbell, 20 mm for types lA and 2, and 10 mm for types 3 and 4.
ISO 37 calls up ISO 5893 for elongation measurement and specifies grade D for type 1, lA and 2 dumb-bells and type A rings, and grade E for types 3 and 4 dumb-bells and type B rings. These grades have a tolerance of ± 2% and cover elongation of up to 1200% on gauge lengths of 20mm and 10mm respectively. Pedantically, referring to an extensometer for rings is not normally correct, however, in ISO 5893 the same level of precision applies to the measurement of extension by crosshead movement as to the use of an extensometer.
Whilst it is generally held that an extensometer is necessary, it would be rather less expensive if elongation of dumbbells could be obtained from crosshead movement. Tay and Teoh^^ devised a numerical scheme whereby the stress strain characteristics could be derived from measured load versus total elongation data from a finite element analysis of the dumb-bell shape. Their method was shown to work to within 10% of values measured with an infra red extensometer for two fairly soft plastics and a silicone rubber. To be effective, the tensile test must be carried out with grips which essentially prevent any slippage and it is, of course, necessary to have the computing facility set up to carry out the analysis.
ISO 5893 does not give any constructional details of extensometers and no longer even notes that there are two basic types - those attached to the test piece and the optical (non-contact) type. However, it does stipulate that, if attached, the extensometer grips must not slip nor affect the test piece in any way. Rather oddly, ASTM D412 doesn't actually specify any particular requirements for extensometers, simply implying that some sort of elongation device is needed. This would seem to be a hangover from the days when most people used a rule or a piece of string.
The traditional extensometer was some form of clip on device, i.e. grips were attached to the test piece and their movement as the test piece elongated was measured by a transducer. The transducer could be a LVDT, or even a dial gauge for small movements, or a cord and pulley system popular for rubber testing. A number of designs of attached extensometers have been developed but they all have certain characteristics. The extensometer grips must be attached with the lightest possible pressure compatible with no slippage to prevent preferential failure of the test piece at the attachment points. This means that whatever form of support is used for the extensometer grips it must be counterbalanced for its own weight and the

Short term stress-strain properties 143
grips must be able to move essentially without friction. One simplified form of extensometer recorded by means of an event marker each 10% elongation, which may be quite adequate for routine work. Slippage of extensometer grips when testing very highly extensible rubbers can be prevented by fitting rubber sleeves over the clamps.
All the contact methods have intrinsic disadvantages of possible grip slippage and influencing the result by placing a strain on the test piece. Furthermore, they are generally restricted in temperature range. Hence, using a non-contact extensometer: has two clear advantages:
(a) The problems of grip slippage and damage to the test piece are eliminated.
(b) For tests at non-ambient temperatures the extensometer can be placed outside the environmental cabinet.
The first commercial non-contact extensometers were optical extensometers which used either visible or infrared light to illuminate targets on the test piece. The essential difference between the optical and contact types is in the method of following the extension as illustrated in Figure 8.12, thereafter they both use some form of transducer to measure the movement which largely dictates the range and sensitivity.
TRANSDUCER TRANSDUCER
\ /
MECHANICAL GRIPS LIGHT BEAMS
/ \
Figure 8-12. Optical and contact extensometers
The principle and use of an optical non-contact extensometer available commercially has been described in some detail . Two photoelectric sensing devices automatically follow, by means of a servo mechanism, contrastingly coloured gauge marks on the test piece. The separation of the auto followers

144 Physical testing of rubber
is measured by some form of transducer and the resulting electric signal fed to a recorder. It is apparent that, in addition to the advantages given above, such a system can be used with very weak polymer films and could contribute to increased efficiency and time saving. An evaluation of optical extensometers was made by Hawley^ .
These devices eliminate the problems of contact but do introduce limitations of their own, such as the marks sometimes affecting the test piece and certain colours and surfaces being difficult to mark successfully. There is also the effort of applying the marks and, although in principle they will operate through an oven window, distortion of light may prevent this.
The next development was the laser extensometer which uses reciprocating or rotating mirrors to sweep a laser beam through an angle between two marks on the test piece. The angle is calibrated against the distance and corrections made for the changes in beam path length with changing angle (Figure 8.13).
LASER TRANSMITTER/ RECEIVER
VIDEO CAMERA
Figure 8-13. Laser and video extensometers
Laser extensometers are relatively cheap to produce compared to the optical type and can be used through the window of an oven but the problems of diffraction in the glass are more severe. There may also be difficulties with cord specimens or if the marks distort. Accuracy at low strains is limited by the measurement of angle but a useful advantage is that the gauge length need not be known.
The most recent development is the video extensometer which claims to overcome all of the disadvantages of the contact, optical and laser types. A

Short term stress-strain properties 145
video camera produces an image of the test piece together with it's gauge marks which is fed to a computer. Range may be varied by change of lens and resolutions down to a few micro metres can be achieved. Calibration can be carried out using an accurately marked calibration test piece so that distortion by glass can be taken into account. Whilst a camera, interface and special software is needed, the system is in one sense simple in that there are no moving parts. It also has the unique advantage of producing an image of the test piece so that there is a visual record of the mode of fracture. The use and benefits of video extensometers together with how they work and applications have been described^ ' .
The extensometers described above measure the overall strain. Bilgili ^ has argued that standard mechanical tests are inadequate for non-homogeneous rubbers and that measurement of full-field displacement is needed. The apphcation of speckle extensometry to rubbers to obtain the two-dimensional field of in-plane displacements has been demonstrated^^.
5.4 Calculation and Expression of Results
It is usual in rubber testing to calculate tensile stresses, including that at break, on the initial cross-sectional area of the test piece. Strictly, the stress should be the force per unit area of the actual deformed section but this is rather more difficult to calculate and in any case, it is the force that a given piece of rubber will withstand which is of interest. The stress calculated on initial cross-section is sometimes called 'nominal stress'.
Extension is always recorded as percentage elongation, i.e. the increase in length as a percentage of original gauge length. It is unusual to find strain units (increase in length divided by initial length) quoted and, to avoid confusion, the total stretched length should not be given. When data is to be used in Mooney Rivlin and similar relationships the extension ratio (ratio of strained to unstrained length) is required.
With dumb-bells, it is assumed that stress and strain are uniform throughout the gauge length and, hence, the calculation of stress presents no difficulties. Modulus as such is not normally measured but the stress quoted for a given elongation. It is sometimes debated whether the mean or the minimum cross sectional area should be used for ultimate stress but whatever the arguments in favour of the minimum, it is rather difficult to measure this and the mean is normally used.
As has been mentioned previously, rings present more of a problem because of non-uniformity of stress and strain. ISO 37 calculates strength at break from force divided by twice the cross-sectional area but this is not the true strength (see Section 5.1). The elongation at break is calculated on the increase in internal circumference on the assumption that failure starts at the internal, most highly stressed, surface. To be precise, a small correction

146 Physical testing of rubber
should be added to the elongation^^ so measured due to the fact that stretching is not uniform round the ring, some parts of which are flat and some curved. However, as the addition varies from about 6% at 100% elongation to 3% at 1000% it is usually ignored.
To calculate for rings the stress at a given elongation (or the elongation at a given stress), the mean elongation should be used, not that of the internal circumference, since the stress recorded will be the average over the whole cross section. In a paper comparing data from ring and dumb-bell test pieces, the relationship between internal and mean elongations is given by Scott ^ as:
2dE, -100(i)-t/)+1000(Z)-JX100 + ^ , ) ~ ' ' h^ =
D + d
where Em = mean elongation (%), Ei = elongation of internal circumference (%), d = internal diameter of unstretched ring, and D = external diameter of unstretched ring.
The magnitude of the error introduced by using the internal circumference elongation (Ei) instead of the mean elongation (E^) is dependent on the slope of the stress/strain curve but could be as much as 30-40%^l
ISO 37 gives a relation to calculate the distance between the pulley centres which corresponds to the elongation percentage for which the stress is required. This relation is equivalent to the simplification of Scotts equation:
D-\-d
and is a reasonable approximation. ASTM D412 calculates the increase in roller separation in the same way. The elongation at a given stress is calculated from the mean circumference at this stress and ISO 37 uses an adaptation of the relation for stress at a given elongation. ASTM D412 has no provision for making this measurement. The elongation at yield is calculated in a similar manner.
Having waded through the above account of calculation of results for rings together with the detail given in the references, it is not surprising that the majority of people opt for dumb-bell test pieces.
The median of the results for each property is reported. There is evidence that tensile properties at break (strength and elongation) follow a double exponential distribution when the mode would be the best measure of central tendency. This has never been widely adopted, largely because it is

Short term stress-strain properties 147
inconvenient to estimate, and some workers have questioned whether the double exponential distribution does indeed apply. The distribution is described and references given to its application to tensile data in the British standard for application of statistics to rubber testing " .
The reproducibility of tensile tests, hke so many rubber tests, was found to be less good than supposed by most people. Spetz^^ carried a similar investigation to that for hardness and found that no one factor could be blamed in particular but that careful control of contributing factors could halve the variability.
The standard methods do not require any attempt to be made to measure the modulus at very small strains by taking the slope of the stress strain curve at the origin. This is very difficult to do because of the near impossibility of eliminating slack, as illustrated by Rigby^ , who demonstrated modeling the very early part of the curve and also correlated the initial modulus with hardness. He successfully calculated the modulus at the origin using a relationship due to Yeoh. Peng et al ^ obtained the small strain modulus by both regression and incremental methods and correlated with hardness.
Kucherskii^^ has proposed a new measure to be taken from the tensile stress strain curve which he terms the knee-point strain. This is the point on the curve where the differential modulus stops decreasing and starts to increase, i.e. where the curve starts to go steeply upwards. It is difficult to find this point on the stress stain curve but it can be pinpointed by looking at where the first derivative of stress with respect to strain passes through a minimum. He relates the knee-point strain to structure and was able to normalize curves for both filled and gum rubbers.
5.5 Relaxed Modulus
There are two reasons for using a tensile stress/strain test other than the 'standard' method as typified by ISO 37. First, it can be sensibly argued that a more useful measure of stiffness is the so-called 'relaxed modulus', i.e. the stress at a given elongation after a fixed time of relaxation; this is essentially a short term stress relaxation test. Secondly, it may be more convenient for quality control purposes to have a simple test in which only one parameter is measured.
In some ways modem tensile testing machines have reduced the need for a separate, particularly simple, routine control test. However, a test which is both simple in the sense of measuring one parameter and provides a relaxed modulus is intrinsically attractive. Such tests in various forms have existed for a long time but do not seem to have attained widespread popularity. A version in which a fixed stress is applied and the elongation after 1 min noted is given in ASTM D1456^ . A specific instrument developed for this

148 Physical testing of rubber
test involves automatic application of weights resulting in a rather large and complicated apparatus. The mass (stress) to be applied needs to be specified by a product specification. This is clearly a very old method (there is mention of increments of 0.11b) and, judging from the lack of recent revision and no precision statement, little used. ISO quite recently added a simple method to the standard for tension set ^ where a force is applied by weights and elongation is measured after both 30s and 60 min, being termed elongation and creep respectively. Its value would seem to be for routinely obtaining a measure of creep in a very simple manner.
5.6 Biaxial Extension
There are currently no ISO standard methods for biaxial extension and such measurements are rarely made in industrial laboratories. However, biaxial stressing is of value in the consideration of the theory of elasticity and is preferred by many for producing data for input to finite element programmes, as well as being involved in certain practical applications of rubber. The British standard for finite element analysis on rubber ^ outlines the two approaches, equibiaxial stretching of a flat sheet and inflation of a flat sheet. The principles of these are illustrated in Figure 8.14.
The biaxial straining rig has two members to which the test piece is attached by gripping links. The two members slide past each other when a force is applied in the direction of the arrows, hence stretching the test piece. Means has to be provided to ensure that the pull remains normal to the edges of the test piece, for example by having rollers on the gripping hnks which run on the outside of the jig members. Clamping causes distortion near the edges of the test piece so strain measurements are made away from the edge, for example by using an optical extensometer to follow lines marked on the test piece.
For the inflation method the test piece is held with a circular clamp and pressurized through a central hole. The biaxial strain state holds near the apex and optical methods can be used to find the radius of curvature and the extension of a grid drawn on the test piece. The nominal stress is then:
2/
where P is the inflation pressure, r the radius of curvature and t the initial test piece thickness.
Various biaxial straining devices have been constructed, as for example those described in references 9 1 - 9 6 . References 92 and 96 cover the inflation method and reference 95 describes a device that will give unequal biaxial and sequential biaxial straining.

Short term stress-strain properties 149
Jig member Gripping links
Clamp
Air presssure
Figure 8-14. Ways of producing biaxial extension. Top equibiaxial straining jig; bottom inflation method
6. COMPRESSION STRESS/STRAIN
A compression stress/strain test is in many ways easier to carry out than a tensile test, and in view of the large number of appUcations of rubber in compression, should be more often used. Frequently, it would be logical for the 'test piece' to be the complete product and a compressive force applied as it would be in service. Usually a constant rate of deformation would be appropriate and the force and corresponding deformation recorded without attempts at calculating the resultant stresses and strains.
Specially prepared test pieces for measuring material properties are usually in the form of a disc or short cylinder, the compressive force being

150 Physical testing of rubber
applied to the circular faces. There are, in theory, two conditions under which the test pieces can be compressed: either with perfect slippage between the rubber and the compressing members or with complete absence of slip. Generally, perfect slippage is impossible to achieve and most applications involve either rubber bonded to metal or compressed between surfaces that virtually eliminate slip.
If there were perfect slippage, every element of the test piece would be subjected to the same stress and strain and a cylindrical test piece would remain a true cylinder without any barrelling. Under these conditions stress and strain are approximately related by (but see also Section 1):
^ = G ( A - - A ) = | ( A - - A )
where: F = compression force, A = initial cross-sectional area of test piece, E = Young's modulus G = shear modulus, X = ratio of compressed height to initial height.
The strain expressed as a fraction of the original height is 8, so that numerically A. = 1 - s.
Further approximations to the relation between stress and strains are sometimes seen:-
For strains up to about 30%, ignoring third and higher powers of e:
Es = E{r'^A) A \-s
For strains up to about 5%, 1-s - 1 and it reduces to:
A
The more usual case, both in applications and experiment, is where it is assumed that there is complete absence of slip, stress and strain are not uniform throughout the test piece and 'barrelling' takes place on compression. The pressure distribution over the flat ends of the test piece under these circumstances has been investigated by Hall .
The relationship between stress and strain in a test piece with bonded end pieces is very dependent on the shape factor of the test piece. This is usually defined as the ratio of the loaded cross-sectional area to the total force-free area (Figure 8.15). The larger the shape factor the more stiff the rubber appears and this property is much exploited in the design of rubber springs and mountings.

Short term stress-strain properties
Loaded area Force
151
Force free area
Figure 8-15. Definition of shape factor
The approximate stress/strain relationship incorporating the shape factor has been expressed in several ways but perhaps the most usual is:
F £
in its most general form:
A 2>^ ^
E^=E(A = BS')
where Ec = effective compression modulus, E = Young's modulus, F = compression force, A = initial cross-sectional area, = ratio of compressed height to initial height and S = shape factor.
The shape factor, S is the ratio of the loaded area to the force free area which for a disc is:
S = diameter
4 X thickness
and for a rectangular block (see Figure 8.15):
lb 2h{Ub)

152 Physical testing of rubber
For natural rubber at least, n = 2. For discs A = 1 and B = 2k where k is a numerical factor which varies with modulus. Values of k have been tabulated by Lindle/^
When the shape factor is high, such that Ec/K (where K = bulk modulus) exceeds 0.1, the effective modulus will be below that expected, due to the bulk compression being appreciable. The effective modulus can then be estimated from^ :
K
Gent' ^ has given a review of compression of rubber blocks which includes a relationship for the effective modulus of an annulus. Anderson et al ' ^ compared results on discs with vary large shape factors to various models and found large discrepancies. Yeoh et al ^ developed a model including relaxing the assumption of complete incompressibihty, whilst Gough et al ^ considered the case of materials containing compressible filler.
6.1 Test Methods
It was not until 1989, which in relative terms is quite late, that an international standard for compression stress strain was published. This is perhaps a sad reflection on the order of priorities that existed within the standardisation of rubber testing. However, ISO 7743 " is now well established.
The ISO standard clearly differentiates between bonded and unbonded test pieces and in an appendix gives the stress strain relationships, taking account of shape factor. In the scope it is pointed out that comparable results will only be obtained for bonded test pieces if they are of the same shape, and that lubricated and bonded test pieces do not give the same results. There is, however, a very curious little introduction that gives a very narrow view of when compression data is needed and makes a dubious claim about use on thin samples when hardness measurement would be difficult - so is an accurate compression test on thicknesses below 2 mm.
The test piece specified is a cylinder 29 ± 0.5 mm diameter and 12.5 ± 0.5 mm thick which can be used bonded or lubricated, in the former case the rubber can be directly bonded to metal plates or adhered later. Although cutting of the test piece, as opposed to moulding, is allowed, it is debatable as to whether cut test pieces can be readily produced with sufficient precision. In addition to the standard test piece, provision is made for using the product or a part of it but for some curious reason only under lubricated

Short term stress-strain properties 153
conditions. Clearly, this could not be the case for rubber to metal bonded parts. For lubricated test pieces, the plates are highly polished and a suitable lubricant applied, typically silicone fluid.
The compression machine is specified by reference to ISO 5893 grade 0.5! One suspects that this is an error as the 1% accuracy of grade 1 is more reasonable. The usual practice is to use a universal tensile machine in compression mode with autographic recording of force and deflection. If this is the case, care must be taken that the machine is sufficiently stiff such that the deflection reading is not significantly affected. The deflection measurement is to conform to class C of ISO 5893 which at ± 2% makes the force requirement overkill.
For the standard test pieces, force/deflection is recorded up to 25% at 10 mm/min, four cycles being made and from the fourth the secant moduli at 10% and 20% strain are obtained. The importance of mechanical conditioning has been discussed in Chapter 5 and this standard is one of the rare examples of where such a procedure is specified. Quite illogically, the test for products is normally done without mechanical conditioning and the force deflection curve is obtained to 30% so that the stiffness at 25% can be used as the result. Sensibly, provision would be made for the strain and the conditioning to be chosen to suit the particular application.
The British standard is identical and numbered as BS ISO 7743. ASTM D575^^^ does not primarily recommend the generation of a
stress/strain curve but details two methods - force at given deflection and deflection at given force. The test piece is a cylinder 28.6 ± 0.1 mm diameter and 12.5 ± 0.5 mm thick from which all moulded surface layers have been removed. The removal of moulded surfaces is presumably to eliminate skin effects, although such effects, if significant, would be present in a moulded product and one would expect to test in the same condition.
The stress at given deflection method is similar to the ISO Standard in that two conditioning cycles are applied before the third measuring cycle, all at 12 mm/min. The deflection at given force method specifies only a single cycle using some type of constant force machine, for example dead weights. Using dead weights rather than a power driven machine is intended as a rapid quality control test requiring only very simple equipment.
The ISO method using the recording of a stress/strain curve readily forms the basis for extension to cover variation in test piece geometry, strain rate and temperature of test. In particular, it can be an efficient quality control measure and useful for proving performance characteristics of whole products, as uncertainties of effect of geometry are removed. Compression stress strain testing in this manner for larger products does, however, require a substantial testing machine, which the constant load method of ASTM seeks to alleviate. Yeoh ^ has described a novel apparatus which enables the modulus at a given strain to be obtained without a relatively expensive universal test machine.

154 Physical testing of rubber
If compression stress strain is used to obtain input data for finite element analysis, the tests would be made with lubricated platens. ISO 7743 does not mention that if the lubrication really is near perfect the test piece can have the unfortunate habit of slipping out of the platens. To prevent this, a small pin should project from the centre of one platen.
There are some applications where the behaviour of rubber under impact conditions is of interest. Lee and Kim have described a dynamic technique^^^ and, if shock absorbing properties are needed, the procedures used for sports and play surfaces' ^ would be relevant.
6.2 Bulk Compression
Although rubber is generally considered to be incompressible, this is not strictly true, it is simply that the bulk modulus is very high, of the order of 10 times the Young's or shear moduli. It is certainly not common practice to make measurements of the bulk modulus and, not surprisingly, no standards are in existence. However, perhaps the most reliable way of obtaining Poisson's ratio is to calculate it from bulk and either Young's or shear moduli. Consequently, methods of measuring bulk modulus have been reported on a number of occasions ^ ' ^ . The two principal methods are using a hydraulically pressurised system and confining a test piece in a metal fixture whilst subjecting it to compression, with the latter being the more simple. In addition, a novel procedure has been described^ ^ for the determination of both Young's and bulk moduli with a single test piece fitted into an oversize enclosed test cell. Both this and a hydrostatic method have been compared by Stanojevic and Lewis " . Holownia and James ^^ devised a procedure using hydraulic compression to measure the dynamic bulk modulus. BS 903-5^^ also gives brief descriptions of constrained compression and compression in a fluid methods.
7. SHEAR STRESS/STRAIN
Shear, like compression, is a more important mode of deformation for engineering applications than tension. Nevertheless, tension remains the most common mode for laboratory stress/strain tests and even less testing is carried out in shear than in compression. The two commonly used geometries for obtaining shear strain are simple shear and pure shear, which are described below. The practical drawback to testing in simple shear is the necessity to bond the rubber test piece to rigid members to provide attachments for applying the shearing force. For pure shear, very wide grips are needed and care taken to avoid slippage. These factors doubtless contribute to discourage testing in shear, although interest in pure shear has

Short term stress-strain properties 155
increased due to the need of input data for finite element analysis.
7.1 Simple shear
The stress/strain curve in simple shear is approximately linear up to relatively large strains and can be represented by:
A ^
where: F = applied force, A = cross-sectional area, G = shear modulus, and y = shear strain.
1 i \ \ \ \ \ \ p • 1
t 1
(b)
^ f
Figure 8-16. Simple shear, (a) Double sandwich test piece; (b) sandwich test piece showing shear deformation; (c) shearing of rubber block. 1,1' undeformed shape; 2, 2' bending
deformation; 3, 3' true shear deformation; 4,4' resultant bending plus shear deformation
With reference to Figure 8.16, the strain is x/h and area A is 1 x the width of the rubber (not shown in the diagram) for a single sandwich and twice this for the double sandwich.

156 Physical testing of rubber
If the ratio of h to 1 is too great there will be an appreciable bending deformation in addition to the true shear, as shown in Figure 8.16(c).
This reduces the apparent shear modulus, Ga, which is given by:
G =
1 + \ h
for a test piece of circular cross section, radius r, and
Ga-
1 + -\(h
for a block of square cross section, side r. Relations between stress and strain for other shear and shear/compression
configurations are given by Freakley and Payne^^ . A shear test using a quadruple block test piece as shown in Figure 8.17 is
standardised as ISO 1827 ^ and BS 903:Part A14^^^ There is not an ASTM equivalent.
Figure 8-17. Quadruple shear test piece
The test piece comprises four rubber blocks 4 mm thick, 20 mm wide and 25 mm long, bonded to 5 mm thick rigid plates. This relatively complicated configuration is chosen because of its stability under stress. With single and double sandwich construction there is a tendency for the supporting plates to move out of parallel under load. With a thickness to length ratio of 0.16 the error due to bending will be negligible. Creep, dynamic and adhesion tests on rubber are also made in shear and some workers have used circular rubber blocks. The relevant standards committees have considered the possibility of a common test piece for all shear tests and circular blocks have been proposed, but this initiative seems to have floundered. The rubber is

Short term stress-strain properties 157
either bonded to the metal supports during vulcanization or moulded blocks are adhered with a high modulus adhesive.
The test piece assembly is strained in a tensile machine at 5 ± 1 mm/min until a maximum shear strain of 30 % is reached. Mechanical conditioning is optional but, if used, five conditioning cycles are applied before the measuring cycle. No details of apparatus to measure the strain are given but this could be a dial gauge or, with a stiff tensile machine, the crosshead movement.
The stress strain curve is recorded and the modulus determined at a shear strain of 25 %. For the quadruple test piece, the shear strain is half the measured deformation divided by the thickness of one rubber block. The shear stress is the apphed force divided by twice the area of a bonded face of one block.
These standards now also include the method for measuring shear adhesion, which is essentially the same as for shear but the test piece is strained at 50 mm/min and the force at break recorded.
7.2 Pure shear
A good approximation to pure shear is obtained with a strip test piece strained perpendicular to its length as shown in Figure 8.18.
Figure 8-18. Pure shear
The strip must be long relative to its width and also the thickness must be small relative to the width. BS 903-5^^ suggests that width is no more than one fifth of the length and that a strip 20 mm x 200 mm x 2 mm (excluding material in the clamps) is suitable. This is actually not very convenient as test sheets are commonly 150 mm wide and the approximation to pure shear is probably reasonable with using this length and having 30 mm between the grips to allow a 20 mm gauge length. Care has to be taken with clamping to ensure uniform extension along the length.

158 Physical testing of rubber
7.3 Torsion
In principle, the shear modulus could be measured using test pieces strained in torsion and in engineering practice components, such as torsion discs and bushes, do operate in this mode. However, it is not common practice to test rubber in this manner except as a low temperature test (see Chapter 15) when a strip test piece is twisted by means of a torsion wire. The instrument traditionally used is not really accurate enough for precise measurement of modulus at room temperature but it would seem reasonable to suppose that an accurate instrument could be devised.
For a strip, force and deflection are related by:
kbt^GO T =
/
where T = applied torque, k = shape factor, b = width of test piece, t = thickness of test piece, G = shear modulus, 0 = angle of twist, and 1 = effective length of test piece.
Values of k are quoted in the standards for low temperature stiffness (see Chapter 15).
Stress/strain relationships for other torsional configurations can be found in Engineering Design with Rubber *^ and Yeoh ^ examined the torsion of cylindrical test pieces by finite element analysis.
A procedure has been described^^', although the details are not too clear, for measuring the torque to twist a cylinder whilst it is under longitudinal compression.
8. FLEXURAL (BENDING) STRESS/STRAIN
Although rubbers are, by design or accident, deformed by bending in some practical applications, it is only very rarely that bending or flexural tests are carried out. This is in contrast to the situation with rigid plastics, including ebonite, where flexural tests are often used and are well standardised.
In most applications where bending apparently takes place, the rubber is also deformed in shear, tension or compression, for example in a shaped door seal, when the test for stiffness would be a 'compression' test on the actual part. Generally, rubbers are not stiff enough in flexure to support appreciable loads so that there is not much need for flexural tests and, at the same time, the lack of stiffness makes such tests a little difficult to carry out with precision. There are, however, some cases where stiffness in bend is of interest, for example with thin sheet and coated fabrics as a measure of

Short term stress-strain properties 159
'handle'. Flexural tests for plastics are usually of the three point loading type, as in
ISO 178 ^ , where the test piece in the form of a flat strip is supported near its ends and a load applied in the centre. On using such a test for soft rubbers, it is immediately apparent that very low forces are realised and that rubbers will deform vastly more than the small strains for which the test is valid. It would seem sensible that if the force/deformation characteristics of a rubber in flexure are required that the test is made on the particular geometry to be used in practice and no attempt made to calculate stresses or moduli. The theory for large strains (which are not large by normal rubber standards) is extremely complicated^^^ Alternatively, it is valid to make comparisons between materials using the same geometry, this approach having been adopted for films and coated fabrics ' .
9. TEAR TESTS
In a normal tensile test, taken to break, the force to produce failure in a nominally flawless test piece is measured. In a tear test the force is not applied evenly but concentrated on a deliberate flaw or sharp discontinuity and the force to continuously produce a new surface is measured. This force to start or maintain tearing will depend in rather a complex manner on the geometry of the test piece and on the nature of the discontinuity. Hence, it would be expected that different tear methods, using different geometries, will yield different tear strengths. However, there is evidence that, for at least a number of rubbers, the ranking of compounds is the same regardless of which tear method is used, ^ ' ^ ' ^^ and is the same ranking as found from a tensile test ^ Dozortsev^^^ goes so far as to say that tear measurements are unnecessary for the assessment of the quality of rubbers.
What is certain is that the initiation and propagation of a tear is a real and very important factor in the failure of rubber products, being involved in fatigue and abrasion processes as well as the catastrophic growth of a cut on the application of a stress. There is, therefore, considerable interest in the tearing resistance of rubbers. What is uncertain is how tear resistance should be measured and the results interpreted.
It is not surprising that, given the importance of tearing and the different levels of result obtained from different geometries, a considerable number of tear tests have been devised which, in part, reflect the different stress concentrations found in various products. The arbitrary nature of the geometries means that, in general, the measured tear strength is not an intrinsic property of the material and it is difficult to directly correlate the results of laboratory tests with the performance of products in service.
Rivlin and Thomas and others made a detailed study of rupture and in

160 Physical testing of rubber
particular tearing using a fracture mechanics approach which was described in a series of papers ^ " "*. They used the concept of'energy of tearing' which is the energy required to form unit area of new surface by tearing. This energy of tearing is a basic material characteristic and independent of test piece geometry; hence, using this concept and knowing the elastic characteristics of the material, the force needed to tear a given geometry can in theory be predicted. The concept also allows rational analysis of other failure processes in rubber, such as fatigue. Although the concept and importance of tearing energy is now well established, standard methods to date do not make use of it but report the arbitrary tearing force.
9.1 Forms of Test Piece
As mentioned above, a large number of different geometries have been used for tear strength measurements. Often they have been chosen with more thought for the convenience of testing than the significance of the results.
Distinction can be made between the force to initiate a tear as distinct from that to propagate a tear. Although it could be argued that once a tear has started the product has failed and the force or energy needed to continue the tear is of no interest, in most cases it is the resistance to growth of small flaws or cuts which is important. A small cut is often not a problem until it becomes a big cut.
In most standard tests the maximum force measured during the test is recorded and no distinction is made between initiation and propagation. Also, most standard tests start with an artificially introduced cut which can be thought of as the initiation. The discontinuity at which the stress concentration is produced is formed either by a cut, a sharp re-entry angle or both. Only in the case of a sharp angle without a cut will any measure of initiation force be possible.
The two most common basic forms of test piece are shown in Figure 8.19. In (a) the force is in the plane of the test piece and parallel to its length, so that the stresses in the tip of the tear are essentially tensile, whereas in (b), the trouser test piece, they must include shear stresses. There have been many variants of type (a) and the three most widely used are shown in Figure 8.20. ISO 34 ^ ' ^ now specifies five procedures: trouser, angle both with and without a cut, crescent and Delft. The Delft test piece is a variant of the type I with an internal slit and is of such a small size as to be more readily cut from finished products. The British standards are identical to ISO 34 with Part 1 being published as BS ISO 34-1 and Part 2 as BS 903:Part A3.2^^ . ASTM D624 ^ has five test pieces: a crescent without the tab ends (i.e. kidney shaped), the usual crescent with tab ends, the angle, the trouser and the trouser with reinforced legs. Hence, it omits the angle with a cut and the Delft but has two variants of the crescent and the trouser. The reason for

Short term stress-strain properties 161
the two forms of crescent is, presumably, that both have been traditionally used. The modified trouser test is considered below.
< ^
T T
- - • . i :
Figure 8-19. Forms of tear test piece. Solid line, original shape; broken line, shape after tearing
Delft Crescent
Angle
Figure 8-20. Variations on form of test piece
From studies comparing the various methods ^ " ^ ' ^ ' ^^^, a number of general deductions can be made:
a) The methods all give different absolute values for tearing force but for at least a number of rubbers the ranking order is the same for all methods. A more consistent correlation may be found between certain of the methods, for example trouser and angle as a group compared to crescent and Delft as a second group. b) The repeatability of the methods varies, the crescent being generally better than the trouser and angle. It could be argued that greater variability would be expected with the trouser test piece because of the real rubber variability over a long tear path. The variability of the crescent and Delft methods will be increased if the nick is not cut with

162 Physical testing of rubber
great care and precision and the angle method requires the angle of the cutter to be accurately maintained. c) The trouser test piece is particularly convenient for calculating tearing energy to give more fundamental results and allows the course of tear propagation to be followed, as well as being a relatively easy test piece to cut accurately. The Delft has size advantage when cutting test pieces from products and the angle is the only method without an artificially initiated tear.
Clearly, it cannot be concluded that one method is universally superior and it is not surprising that there are even more test pieces in use than the generally standardised ones discussed above. The trouser test piece sometimes produces difficulties in practice due to excessive leg extension or deviation of the tear through one leg. Veith'" ^ has described a modification with fabric reinforced legs designed to overcome these difficulties and Leblanc " ^ has approached the same problems by having a thinner centre strip to the test piece. ASTM D624 includes the reinforced trouser test piece. The Pohle method ^ uses a tensile ring with nicks on the internal diameter.
Rather than being just a means of restricting leg extension or deviation of the tear through a leg, reinforcement allows investigation of knotty tearing with respect to unreinforced width. Metal reinforcement was used for constraint by Gent and Henry " ^ and this approach was used by Stacer et al " " to help elucidate the mechanisms of slip stick tearing.
9.2 Preparation of Test Pieces
Tear test pieces are normally stamped from sheet with an appropriate die (see Chapter 4) and then a nick cut if required, although with the Delft test piece both operations are usually done simultaneously.
The depth of nick, or length of cut, is critical for the crescent and Delft test pieces and must be controlled within close limits to obtain consistent results. For the crescent, it is necessary to use a special jig to hold the test piece and move a blade across its edge. Such jigs are available commercially, one is referenced in ISO 34-1 and another described by Bugrov et al ' ^ The nick depth can be checked with a traveling or projection microscope, the main difficulty in measuring accurately arising from the concave edges formed by the stamping die (Figure 8.21). ISO 34 makes no mention of the difficulty in measuring the effective width below the nick but in ISO 816 a procedure for estimating the effective untom width is given in detail.
For angle test pieces with a nick added, the problem is essentially the same as with the crescent test piece. With unnicked angle test pieces, the essential requirement is the production of a reproducible re-entrant angle.

Short term stress-strain properties
which is very difficult even with careful die maintenance.
163
Figure 8-21. Cross section of die-cut tear test pieces, (a) Nicked crescent test piece; (b) Delft test piece, w = effective width of untom portions.
The trouser test piece presents the least difficulty as regards preparation because none of the dimensions, including the nick depth, are as critical as with the other test pieces.
9.3 Measurement of Tearing Force
Tear test pieces are gripped and stretched to break in a machine of the same type as used for tensile tests and, hence, the comments made in Section 5.3 also apply generally here. Because of the lower forces involved, gripping is less difficult than with tensile tests but small forces mean that a more sensitive load measuring device is needed. The rate of change of force can be high and with the trouser test piece the force will rise and fall alternately. Hence, the 'inertialess' type of tester with rapid response is essential.
The current standards specify a stretching rate of 500 ± 50 mm/min, the same as for tensile tests, except for the trouser test which is 100 ± 10 mm/min. These choices are somewhat arbitrary and, not surprisingly, tear strength can be expected to vary with testing speed. For example, the tearing energy for natural rubber may be raised or lowered by an increase in speed^^^ The change could be a few percent for a ± 10% speed change and although this would not cause serious discrepancies between results there is perhaps a case for a tighter tolerance on speed than currently standardised.
With crescent. Delft and angle test pieces only the maximum force reached is recorded, although the change of force along the short tear path could be obtained with a force measuring and recording system having very
164 Physical testing of rubber
fast response. Over the longer tearing length of the trouser test piece the force may vary very considerably and in an irregular manner, especially in the "knotty" tearing of some black reinforced rubbers. An accurate trace of force variation can be obtained with suitable measuring and recording equipment.
Normally, tests are conducted without any mechanical conditioning of the test piece but it has been found that pre-stretching can introduce very pronounced anisotropy in tear strength^^ .
9.4 Expression of Results
The quantity directly measured in a tear test is the force on the test piece during testing. Particularly with the trouser method, this force will fluctuate along the tear path. ISO 34 takes the maximum force reached in the case of crescent, angle and Delft methods but for the trouser method a median force is determined in accordance with procedures given in ISO 6133^^ , Analysis of multi-peak traces obtained in determinations of tear strength and adhesion strength.
ISO 6133 gives five procedures, for traces having less than 5 peaks, 5 to 20 peaks, more than 20 peaks, undulating traces and large number of peaks too close for counting, respectively. Illustrations of the traces for methods other than the first are included in the standard (an example of a multi-peak trace is also given in Chapter 18). For less than 5 peaks the median and range of them all is taken, for 5 to 20 peaks the median and range of the peaks in the central 80% of the trace is taken, for more than 20 peaks the trace is divided into tenths by nine lines, the peak nearest to each line noted and the median and range of these taken, for undulating traces the arithmetic mean (mid point of maximum and minimum of the trace) is taken and for too close to count traces the arithmetic mean (mid point of highest and lowest peaks) is taken. The method for 5 to 20 peaks is also recommended for use when peaks are automatically computed - clearly, the method would get a little tedious for over 20 peaks if done manually.
Having obtained the force (maximum or median), the tear strength is given in ISO 34-1 as:-
• d
where Ts = tear strength in kilonewtons per metre of thickness, F = force (maximum or median) in newtons, d = thickness in millimeters.
This method of expression of results could be taken to imply that tear force is proportional to thickness over a wide range. This would probably not be true and ISO 34 requires that for comparative results the thickness

Short term stress-strain properties 165
variation of groups of test pieces should be not greater than ±1.5% - which is extreme in the other direction. Mazich et al " ^ have reported a study on the effect of thickness on tearing energy which indicates that it may double when going from 0.7 to 2.6 mm thickness.
ASTM D624 also uses maximum force per unit thickness for crescent and angle test pieces. For the trouser test with knotty tear there is the choice of taking the mean of the peaks, the mean of the valleys or the mean of the peaks and valleys, plus the area under the trace. For the trouser test with a smooth trace the average is taken. If there are more than one smooth level in the trace the average weighted for the length of trace at each level is used. It is not clear whether average is mean or median as the report says either.
In ISO 34-2, the result for the Delft test piece is expressed as the force to tear a test piece of standard width and thickness, corrections for variation within tolerance of width and thickness being given:
' b,d
where Fo = tear strength in newtons, F = maximum force in newtons, bs = actual width in millimeters of the torn in the test piece, d = the actual thickness of the test piece, 8 is the product of the nominal torn width and thickness, 4 x 2 mm.
More emphasis than in ISO 34 is given to measuring the effective test piece width allowing for the curved edges of the slit. It must be noted that this method of expressing the result is not the same as for ISO 34 and, hence, results are not directly comparable. In fact, ISO 34 previously used this method and older results which may be found will be in different units to results from the current standard. The change was because it was found that variation of the untom width within the tolerance specified did not have a significant effect on the result, although evidence for this does not appear to be published. The untorn width is twice as large as for the Delft test piece.
The treatments in ISO 6133 are not exactly consistent and the use of the procedure for obtaining a median of the peak forces can be questioned. It could be argued that the maximum force (highest peak) be used or the lowest force on the basis that these give the best and worst representation of the rubber. Alternatively, a case could be made for the mean or median of both peaks and troughs. ASTM is better in this respect in that it at least gives the option of considering the troughs. ISO 6133 does in fact ask for the range of peak values to be recorded but this is not used in ISO 34, which is an unfortunate omission because with some rubbers the variation can be very large whereas with others a fairly smooth trace is obtained. The commonest quick procedure in the laboratory for tear or adhesion force recordings, which is akin to the ISO 6133 and ASTM methods for undulating or smooth

166 Physical testing of rubber
traces, is to estimate the average level with the aid of a transparent plastic ruler! (See also Chapter 18).
9.5 Fracture mechanics approach
The term fracture mechanics was coined many years ago to denote an energy balance approach to the failure of materials. As mentioned at the beginning of this section, the application of fracture mechanics to rubber resulted in the concept of tearing energy, the energy required to produce unit area of new surface. A very convenient summary account of the development of this understanding of failure of rubbers has been given by Thomas^''.
The result as regards tear testing is that, having obtained a measure of tearing force, it is possible with some geometries to easily derive the characteristic energy of tearing, which is the most useful measure of tearing performance.
The tearing energy for the trouser test piece is given by:
T = wW
where T = tearing energy, X = extension ratio in legs of test piece, F = measured force, w = width of test piece, t = thickness, and W = strain energy density.
W can be obtained by extending a test piece without a nick and plotting a stress/strain curve, W being derived from the area under the stress/strain curve up to the extension ratio.
If the legs of the test piece are sufficiently stiff so that extension is negligible A, = 1 and W is zero and the relationship reduces to:
t
This approximation has generally been found adequate for most purposes, even without reinforcing the legs of the test piece to prevent
141
extension . Other geometries which are convenient for obtaining tearing energy are
the simple shear and 'angled' and 'split' test pieces which are illustrated by, for example, Thomas " ^ but are not commonly used. The tensile strip with a small edge cut is a simple and important geometry but is less convenient for relating the measured force to energy. However, it can be shown that:

Short term stress-strain properties 167
T = IkWc
where k is a function of the extension ratio in the bulk of the test piece, W is the elastic energy density which can be calculated from the stress strain curve, and c is the cut length.
Tearing energy can be computed by finite element analysis and Yeoh ^ has applied this to some classical test piece shapes to address some unanswered questions.
The tearing energy is related to the diameter of the tip of the tear, an approximation being:
T~W,d
where W = work to break unit volume and d = tip diameter. b
Tearing energy cannot be, therefore, a unique material parameter but will depend on cut geometry, which is affected by many factors. A well known example is slip stick or knotty tearing of filled rubbers which is caused by periodic blunting of the cut tip. Generally, the sharper the cut the lower will be the tearing energy. Stacer et al " " have examined slip stick behaviour and discuss which measures of energy can be considered inherent material properties. Lake and Yeoh ^ studied the effect of cut tip sharpness and show that for very sharp cuts very low energies are required and the variation between materials is much less than for normal tear tests. They also discuss the relevance of sharp cut data to tensile strength.
9.6 Cutting Resistance
Although in practice the cutting of rubber by sharp objects is an important way in which damage is made to articles such as tyres, there are currently no general standardised test methods. Cutting can take place without any other stress on the rubber but, in the case where the rubber is cut whilst being held under stress, the situation might be considered as the sharp object assisting tearing.
The resistance to cutting is contributed to by both the strength properties of the rubber and friction. If the rubber is stressed whilst cutting takes place, one consequence is that friction is much reduced and with it the force needed to cause cutting. Most of the ad hoc tests which have been devised to measure cutting or puncture resistance operate under unknown and arbitrary friction conditions and, hence, do not measure an intrinsic strength property. An example would be a "stitch tear" test where a thread is looped through two holes in the test piece and the rubber between the holes torn by pulling the thread through it. Quite clearly, any such test will only have relevance to

168 Physical testing of rubber
essentially the same stress and geometry conditions in service. If conditions of service are such that there is a probability of objects
being present with sufficient force behind them to cause cutting even in high friction conditions, it might be argued that cuts are to be expected and it is resistance to catastrophic propagation of these cuts which is of importance and, hence, the appropriate test is one for tear strength.
If the cutting resistance of the rubber is required it would best be made under conditions of negligible friction. Lake and Yeoh ^ have described two test geometries which achieve this and also give a comprehensive account of the cutting process using the same fracture mechanics approach as for tearing energy. Obata et al ^ obtained measures of cutting energy by impacting a test piece with a sharp blade. They made corrections for the deformation of the rubber but not, apparently, for friction.
The Lake and Yeoh experiments found that there is a critical force at which catastrophic cutting occurs and that its relation with the tearing energy available is the same for different widths of test piece and for both constant force and constant rate tests. At lower tearing energies, there was a linear relationship between the critical force and tearing energy and the sum of critical force and tearing energy was constant for a given rubber and sharpness of the cutting blade. They believed that the behaviour in this region represented true cutting.
Puncture can be thought of as cutting with a very blunt instrument. Stevenson and Malek " used 1.5 and 0.5 mm diameter titanium indentors with both relatively sharp and rounded comers. They demonstrated the several stages of puncture and analysed the process in terms of tearing energy.
REFERENCES
1. Treloar L R G. The Physics of Rubber Elasticity, Oxford University Press, 1975. 2. Gent A N. Rubb. Chem. TechnoL, 67, 3, 1994, p549. 3. ScottJR.Trans.IRI, 11,1935. 4. Briscoe B J, Sebastian K S, Adams M J. J Phys. D, 27, 6, 1994, pi 156. 5. Laufer Z, Diamant Y, Gill M, Fortuna G. Intern. J. Polymeric Mater., 6, 1978, pl59. 6. Kugler H P, Stacer R G, Steimle C. ACS Rubb. Div. Meeting, Detroit, 1989, Paper 81. 7. Kent R E. Europe. Rubb. J., April, 1978, p29. 8. Turner D, Brennan M. Plast. Rubb. Process. Appln., 14, 3, 1990, pl83. 9. Davies C K L, De D K, Thomas A G. Rubb. Chem. Technol, 67,4, 1994, p716. 10. Charlton D H, Yang J, Teh K K. Rubb. Chem. Technol, 67, 3, 1994, p481. 11. Johnson A R, Quigley C J. ACS Rubber Division Meeting, Philadelphia, 2-5 *' May 1995,
Paper 7. 12. Yeoh O H. Rubb. Chem. Technol. 70,2,1997, pl75. 13. Vahdati N. ACS Rubber Division Meeting, Chicago, 13-16 ^ April 1999, Paper 21. 14. Haberstroh E, Stommel M. Int. Polym. Sci. & Tech., 27, 1, 2000, pTl.

Short term stress-strain properties 169
15. Chevalier L Marco Y. Polym. Eng. & Sci., 42, 2, 2002, p280. 16. Raos P. Kaut. u. Gummi Kunst, 45, 11, 1992, p957. 17. Constitutive Models for Rubber II Conference, Hanover, 10-12* Sept. 2001, Proceedings,
Balkema Publishers. 18. Constitutive Models for Rubber III Conference, London, 15-17* Sept. 2003, Proceedings,
Balkema Publishers. 19. BS 903-5, 2004. Guide to the application of rubber testing to finite element analysis. 20. Besdo D, Ihlemann J, Kingston J G R, Muhr A H. Constitutive Models for Rubber III
Conference, London, 15-17* Sept. 2003, Proceedings, Balkema Publishers, p309. 21. Kim W-D, Kim W-S, Woo C-S, Lee H-J. Polym. Int., 53, 7, 2004, p850. 22. Gough J, Muhr A H, Thomas A G. IRC '97, Kuala Lumpur, 6-9* October 1997,
Proceedings, p815. 23. Laraba-Abbes F, lenny P, Piques R. Polymer, 44, 3, 2003, p821. 24. Soden A L. A Practical Manual of Rubber Hardness Testing, Maclaren and Sons, 1951. 25. Kucherskii A M, Kaporovskii B M. Polym. Test., 16, 5, 1997, p481. 26. ISO 18517, 2005. Hardness testing - Introduction and guide. 27. ISO 48, 1994, AMD 1, 1999. Determination of Hardness (Hardness between 10 and 100
IRHD). 28. Hawley S. Polym.Test., 16,4, 1997, p327. 29. Stiehler R D, Decker G E and Bullman G W. Proceedings of the Int. Rubb. Conf, Kuala
Lumpur, 1975, p277. 30. Yeoh O H. Plast. Rubb. Process. Appln., 4, No. 2, 1984, pl41. 31. Busfield J J C, Thomas A G. Rubb. Chem. & Technol., 72, 5, 1999, p876. 32. Bassi A C, Casa F, Mendichi R. Polym. Test. 7, 3, 1987, pl65. 33. Brown R P and Hughes R C. RAPRA Bulletin, July 1972. 34. ISO 7267-1, 1997. Rubber and plastics covered rollers - Method of test - Determination of
apparent hardness (IRHD method). 35. ISO 7267-2, 1986. Rubber and plastics covered rollers - Method of test - Determination
of Shore hardness. 36. ISO 7267-3, 1988. Rubber and plastics covered rollers - Method of test - Determination of
apparent hardness by Pusey and Jones method. 37. BS 903 Part A26, 1995. Determination of hardness. 38. ASTM D1415 1988. International hardness. 39. ASTM D1414 1994. Standard test methods for rubber 0-rings. 40. ASTM D531 2000. Pusey and Jones indentation. 41. BS 7442-3.1, 1998. Rubber and plastics covered rollers - Method of test - Determination
of apparent hardness (IRHD method). 42. BS 7442-3.2, 1991. Rubber and plastics covered rollers - Method of test - Determination
of Shore hardness. 43. BS 7442-3.3, 1992. Rubber and plastics covered rollers - Method of test - Determination
of apparent hardness by Pusey and Jones method. 44. ISO 7619-1 2004. Determination of indentation hardness - Durometer method (Shore
hardness). 45. ISO 7619-2 2004. Determination of indentation hardness - IRHD pocket hardness meter. 46. Briscoe B J, Sebastian K S. Rubb. Chem. Technol., 66, 5, 1993, p827. 47. Qi H J, Joyce K, Boyce M C. Rubb. Chem & Tech., 76, 2, 2003, p419. 48. BS 903 Part A 57 1997. Determination of indentation hardness by means of pocket
hardness meters. 49. ASTM D2240, 2003. Durometer hardness.

170 Physical testing of rubber
50. Mareanukroh M, Eby R K, Scavuzzo R J, Hamed G R, Preuschen J. Rubb. Chem. & Tech.,73,5,2000,p912.
51. Unseld K, Albohr O, Herrmann V, Fuchs H B. Kautchuk und Gummi Kunststoffe, 53, 1-2, 2000, p52.
52. Neideck K, Franzel W, Grau P J. Macromolecular Sci. B, B38, 5&6, 1999, p669. 53. Li Z, BrokkeniZijp J C M, de With G. Polymer, 45, 16,2004, p5403. 54. Newton R G. J. Rubber Res., 17, 1948. 55. Spetz G. Polym. Test., 12,4, 1993, p351. 56. Brown R P, Soekamein A. Polym. Test., 10, 2, 1991, pi 17. 57. Kucherskii A M, Kaporovskii B M. Polym Test., 14, 3, 1995. 58. Taylor R H. ASTM Bulletin, Aug. 1943. 59. Casa F, Fenzi M Tontodonati L. Polym. Test., 14,4, 1995, p355. 60. Lackovic S, Morgans R and Reynolds D. ACS Rubber Division Meeting, Cleveland, 21-
24 *' October 1997, paper 4. 61. Morgans R, Lackovic S, Cobbold P. International Rubber Conference, Manchester, 7-10*
June 1999, materials paper 12. 62. Hodson R, Lackovic S. Elastomery, 6, 3, 2002, pi7. 63. BS ISO 37, 2005. Determination of tensile stress-strain properties. 64. ASTM D412, 1998 (2002). Tension. 65. Reece W H. Trans. IRI, 11, 312,1935. 66. Scott J R. J. Rubb. Res., 18, 1945. 67. Wada N, Takashima M, Kondo T, Mitsuhashi K. International Rubber Conference,
Prague, 1-4* July 2002, paper 74. 68. Bartenev G M. and Gul V E. Sov. Plas., No. 1,46, 1961. 69. ISO TC45, Interlaboratory Comparison 1973 (Not published). 70. Nazeni D I. Deutsche Kautschuk-Gesellschaft, Vortragstagung, 4-8th October 1960, West
Berlin. 71. Patrikeev G A, Thieu V V, Kondratov, A P and Cherepov S B. Int. Polym. Sci. and Tech.,
5, No. 9, 1978. 72. Deuri A S, Bhowmick K A. J. Appl. Polym. Sci., 35,2, 1988, p327. 73. BS ISO 5893, 2002. Rubber and plastics test equipment - Tensile, flexural or compression
types (constant rate of traverse). 74. Scott D C Jr and Villars D S. ASTM Special PubHcation No. 185, 1956, p.62. 75. Dannis M L. J. Appl. Polym. Sci., 6, 283, 1962. 76. Tay A O, Teoh S H. Polym. Test., 8,4, 1988, p231. 77. Bennett F N B. Polym. Test, 1, No. 2, 1980. 78. Hawley S. Polym. Test, 2, No. 1, 1981. 79. Pye C. Materials World, 1, 10, 1993, p557. 80. Spinka O. Polymer Testing Conference, Rapra, Shawbury, 1996, paper 9. 81. BilgiH E. Polym. &Polym. Composites, 12, 3, 2004, p221. 82. Laraba-Abbes F, Jenny P, Piques R. Polymer, 44, 3,2003, p807. 83. Scott J R. J. Rubb. Res. 18, 30, 1949. 84. BS 5324 1995 Applications of statistics to rubber testing 85. Spetz G. Polym. Test, 14, 1, 1995, pl3. 86. Rigbi Z. Kaut. u. Gummi Kunst.,44, 11, 1991,pl011. 87. Peng S H, Su H, Naderi A. ACS Rubber Division Meeting, Pittsburgh, 11-14* October
1994, paper 55. 88. Kucherskii A M. Polym. Test., 22, 5, 2003, p503. 89. ASTM D1456, 1986 (2001). Rubber property-Elongation at specific stress.

Short term stress-strain properties 171
90. ISO 2285, 2001. Determination of tension set under constant elongation, and of tension set, elongation and creep under constant tensile load.
91. Nottin J P, Blanc D, Evrard G, Leblanc F, Prou J. and Truntzer G. Proceedings of 27th Int. Sym. on Macromolecules, Strasbourg, Vol. 2, 1981.
92. Kent, R.E. (1978). Eur. Rubb. J., 160, No. 3, 1978, p29. 93. Kawabata S. and Kawai, H. (1977). Adv. Polym. Sci. No. 24. 94. Hitt D J, Gilbert M. Polym. Test., 13, 3, 1994, p219. 95. Hitt D J, Gilbert M. Polym. Test., 19, 1, 2000, p27. 96. Reuge N, Schmidt F M, le Maouh Y, Rachik M, Abbe F. Polym. Eng. and Sci., 41, 3,
2001, p522. 97. Hall M M. J. Strain Analysis, 6,1, 1971, p38. 98. Lindley P B. Nat. Rubb. Tech. Bull., No. 8, 3rd edn., 1970. 99. Gen AN and Lindley P B. Proc. Inst. Mech. Engrs., 173, 111, 1959. 100. Gent A N. Rubb. Chem. & Technol, 67, 3, 1994, p549. 101. Anderson M L, Mott P H, Roland C M. Rubb.Chem. & Technol., 77, 2, 2004, p293. 102. Yeoh O H, Pinter G A, Banks H T. ACS Rubber Division Meeting, Cincinnati, 17-19*
October 2000, paper 84. 103. Gough J, Muhr A H, Thomas A G. Constitutive Models for Rubber III Conference,
London, 1-17* September 2003, Balkema Publishers, p283. 104. ISO 7743, 2004. Determination of compression stress-strain properties. 105. ASTM D575, 1991 (2001). Rubber properties in compression. 106. Yeoh O H. J. Rubb. Res. Inst. Malaysia, 32,3,1984, p227. 107. Lee O S, Kim K J J. Mat. Sci. Letters, 22/16,2003, pi 157. 108. Brown R. Polym. Test., 7,4, 1987, p279. 109. 01,khovik O E and Grigoryan E S. Vys. Soed. A, 16, 9, 1975, p2155. 110. Peng S H, Shimbori T, Naderi A. ACS Rubb. Div. Meeting, Chicago, 1992, Paper 2. 111. Kaporovskii B, Azarkh M Z, YurtsevNN. Polym. Sci. USSR, 27, 10, 1985,p2481. 112. Lepie A H, Moran M B J. Appl.. Polym. Sci., 30, 8, 1985, p3153. 113. Worfield R W, Cuevas E and Bamet, F R J. Appl. Polym. Sci., 12, 1147, 1968. 114. Stanojevic M and Lewis G K. Polym. Test. 3, No. 3, 1983. 115. Holownia B P, James E H. Rubb. Chem. Technol, 66, 5, 1993, p749. 116. Freakley P K and Payne A R. Theory and Practice of Engineering with Rubber, Applied
Science Publishers, 1978. 117. ISO 1827, 1991. Determination of modulus in shear or adhesion to rigid plates -
Quadruple test method. 118. BS 903:Part A14, 1992. Determination of modulus in shear or adhesion to rigid plates -
Quadruple test method. 119. Payne A R, Scott J R. Engineering Design with Rubber, Maclaren and Sons, 1960. 120. Yeo O H. Rubb. Chem. and Tech., 76, 5, 2003, pl212. 121. Glushchenkov V A, Simagina S G. Int. Polym. Sci. Technol, 23, 5, 1996, pT27. 122. ISO 178, 2003. Determination of flexural properties. 123. Heap R D, Norman R H. 'Flexural Testing of Plastics', Published by the Plastics Institute,
1969. 124. Brown R P. RAPRA Members Journal, 3, No. 2, 1975. 125. Clamroth R and Kempermann Th. Polym. Test, 5, No. 6, 1985. 126. Warhurst D M, Slade J.C, Ochiltree B C. Polym. Test., 6, 6, 1986, p463. 127. Brezik R. Int. Polym. Sci. and Tech., 9, No. 4, 1982. 128. Dozortsev M S. Int. Polym. Sci. and Tech., 11,9, 1984. 129. RivHn R S and Thomas A G. J. Polym. Sci., 10,3, 1953, p291. 130. Thomas A G. J. Polym. Sci. 18, 177, 1955.

172 Physical testing of rubber
131.GreensmithH WandThomas AG. J. Polym. Sci. 18, 189, 1955. 132. Greensmith H W. J. Appl. Polym. Sci., 21, 175, 1956. 133. Thomas A G J. Appl. Polym. Sci., 3, 8, 168, 1960. 134. Greensmith H W J. Appl. Polym. Sci., 3, 8, 183,1960. 135. ISO 34 Part 1, 2004. Determination of tear strength - Trouser, angle and crescent test
pieces). 136. ISO 34 Part 2, 1996. Determination of tear strength - Small (Delft) test pieces. 137. BS 903:Part A3.2, 1997. Determination of tear strength - Small (Delft) test pieces. 138. ASTM D624, 2000. Tear strength of conventional vulcanized rubber and thermoplastic
elastomers. 139. ISO TC45. Interlaboratory Comparison. 1973. Unpublished. 140. Desbrieres D. Caout. Plast. No. 612, 1981. 141. Veith A G. Rubb. Chem. and Tech., 38, 4, 1965. 142. Leblanc J L. 5th Europ. Plast. Rubb. Conf, Paris, Vol. 2, 1978, Paper E22. 143. Gent A N, Henry A W. Proc. Inst. Rubber Ind., 1967, pi93. 144. Stacer R G, Yanyo L C, Kelley F N. ACS Rubber Division Meeting, Denver, October
23-26, 1984, Paper 27. 145. Bugrov V P, Sirotin V M, Kopylov E P, Shkeleva N P. Int. Polym. Sci & Tech., 4, 6,
1977, pT24. 146. Janssen H J J. Third Rubber Technology Conference, London, 22-25* June 1954, Paper
24. 147. ISO 6133, 1998. Analysis of multi-peak traces obtained in determinations of tear
strength and adhesion strength. 148. Mazich K A, Morman K N, Oblinger F G, Pan T Y, Killgoer P C. ACS Rubb. Div.
Meeting, Cleveland, 1987, Paper 58. 149. Thomas A G. Rubb. Chem. Technol., 67, 3, 1994, p G50. 150. Yeoh O H. ACS Rubber Division Meeting, Nashville, 29* September- 2" October 1998,
paper 2. 151. Lake G J, Yeoh O H. Polym. Sci. Polym. Phys., 25, 6, 1987, pi 157. 152. Lake G J and Yeoh O H. Rubb. Chem. Technol., 53, No. 1, 1980. 153. Obata Y, Arai K, Kurauchi C. Int. Polym. Sci. Tech. 18, 6, 1990, p T/58. 154. Stevenson A, Malek K A. Rubb. Chem. Technol, 67, 5, 1994, p743.

Chapter 9
DYNAMIC STRESS AND STRAIN PROPERTIES
The term dynamic test is used here to describe the type of mechanical test in which the rubber is subjected to a cyclic deformation pattern from which the stress strain behaviour is calculated. It does not include cyclic tests in which the main objective is to fatigue the rubber, as these are considered in Chapter 12. Dynamic properties are important in a large number of engineering applications of rubber including springs and dampers and are generally much more useful from a design point of view than the results of many of the simpler 'static' tests considered in Chapter 8. Nevertheless, they are even today very much less used than the "static" tests, principally because of the increased complexity and apparatus cost.
1. PRINCIPLES OF DYNAMIC TESTS
Before considering particular test methods, it is useful to survey the principles and terms used in dynamic testing. There are basically two classes of dynamic motion, free vibration in which the test piece is set into oscillation and the amplitude allowed to decay due to damping in the system, and forced vibration in which the oscillation is maintained by external means. These are illustrated in Figure 9.1 together with a subdivision of forced vibration in which the test piece is subjected to a series of half-cycles. The two classes could be sub-divided in a number of ways, for example forced vibration machines may operate at resonance or away from resonance. Wave propagation (e.g. ultrasonics) is a form of forced vibration method and rebound resilience is a simple unforced method consisting of one half-cycle. The most common type of free vibration apparatus is the torsion pendulum.

174 Physical testing of rubber
There is an international standard, ISO 4664^ which is written as a guide to dynamic testing and which can be referred to for definitions of terms used and also includes classifications of test machines, preferred conditions, recommended test piece shapes and a bibliography. The British standard is identical (BS ISO 4664). ASTM has taken the same approach but the equivalent^ is more like a small text book and includes some rather unnecessary definitions (e.g. lubricated and relative). Whilst it is some ways a valuable reference, in other respects it is "over the top" for many peoples testing needs.
Time
(c)
Time
Figure 9-1. Forms of strain and stress cycles, (a) Continuous constant amplitude; (b) continuous decaying amplitude; (c) successive half waves
The static tests considered in Chapter 8 treat the rubber as being essentially an elastic, or rather 'high elastic', material whereas it is in fact viscoelastic and, hence, its response to dynamic stressing is a combination of an elastic response and a viscous response and energy is lost in each cycle. This behaviour can be conveniently envisaged by a simple empirical model of a spring and dashpot in parallel (Voigt-Kelvin model).
For sinusoidal strain the motion is described by:

Dynamic stress and strain properties 175
Y = YQ sin Q)t
where: y= strain, yo = maximum strain amplitude, co = angular frequency, and t = time.
If the rubber were a perfect spring the stress (x) would be similarly sinusoidal and in phase with the strain. However, because the rubber is viscoelastic the stress will not be in phase with the strain but can be considered to precede it by the phase angle (5) so that:
T = Tr, s m {(Dt + 5)
This is the same as saying that the deformation lags behind the force by the angle 5.
It is convenient to consider the stress as a vector having two components, one in phase with the displacement (x') and one 90° out of phase (x") and to define corresponding in-phase, out-of-phase and the resultant moduli. The sinusoidal motion is illustrated in Figure 9.2 and the vector in Figure 9.3.
i
(A
$ Q
c o tn
.^"^ " A / x \ X iv/ / \ \
/ / \ \ / / \ \
/ / \ \ / / 1 ^ \ l l
U^\\ ^^ 1/ Ny] \ \ \ \ N
c i n \ 1 \
1 - ^ 1 1 1 1 1
-*1 ^
-
i
\ >
I
) C
' ^
/
X / X /
V..X-—!-7-1 \ \ / / / / 1 \ V / / / /
TT \ ^ — I / \ \ / /
Time or phase angle
Figure 9-2. Sinusoidal stain and stress cycles. I strain, amplitude a; II in-phase stress, amplitude b; III out-of-phase stress, amplitude c; IV total stress (resultant of II and III,
ampHtude d. a is the loss angle

176 Physical testing of rubber
T' or G'
Figure 9-3. Vector strain or stress diagram
Considering Figure 9.3, the vector moduli in shear are defined by:
G* = G' + iG"
where G* = complex (resultant) modulus, G' = in-phase or storage modulus, and G" = out-of-phase or loss modulus.
It can also be shown that:
T Tn G' = — = —^cos(5 = G* cos j^
To To
\G'\ = (G''+G'''Y'
tan S (the loss factor or loss tangent) = G'

Dynamic stress and strain properties 177
[G*] is the absolute value of the complex modulus but in practical dynamic testing is often written as G*.
In Figure 9.2, the in-phase modulus G' = b/a and this is the modulus G assumed to be measured in a static test. The out-of-phase modulus G" = c/a. The magnitude of the complex modulus is:
IG*| = ^ = . ^b'^c'^
V ^ y
The loss tangent, tan 5 = c/b.
Similarly, in tension or compression:
Young's modulus, |^*| = (E'^ + E"^ ) ^ ^ ^
If, in a dynamic test with forced sinusoidal oscillation, force is plotted against deflection a hysteresis loop is obtained as shown in Figure 9.4.
Figure 9-4. Hysteresis loop

178 Physical testing of rubber
The dynamic stiffness is the ratio of force ampHtude to deformation amplitude:
ing in shear,
G*
5 = ^ XQ
AXQ a
(i.e. stress oc strain) where h = test piece thickness and A = effective cross-sectional area.
VAJCAJ AX(\
and
/ ,
The viscoelastic behaviour of rubbers is not linear; stress is not proportional to strain, particularly at high strains. The non-linearity is more pronounced in tension or compression than in shear. The result in practice is that dynamic stiffness and moduli are strain dependent and the hysteresis loop will not be a perfect ellipse. If the strain in the test piece is not uniform, it is necessary to apply a shape factor in the same manner as for static tests. This is usually the case in compression and even in shear there may be bending in addition to pure shear. Relationships for shear, compression and tension taking these factors into account have been given by Payne^ and Davey and Payne" but, because the relationships between dynamic stiffness and the basic moduli may be complex and only approximate, it may be preferable for many engineering applications to work in stiffness, particularly if products are tested.
The results of dynamic tests are dependent on the test conditions: test piece shape, mode of deformation, strain amplitude, strain history, frequency and temperature. ISO 4664 gives a good summary of basic factors affecting the choice of test method. Forced vibration, non-resonant tests in simple shear using a sinusoidal waveform are generally preferred for design data as

Dynamic stress and strain properties 179
the stress strain curve is linear to higher amplitudes than in other modes, the effects of frequency and strain amplitude can be investigated and also there is a substantial proportion of manufactured article operating in this mode. It has the disadvantage that test pieces have to be bonded to metal end pieces. Compression has the disadvantages of shape factor needing to be considered and needing higher force capacity but can be useful to match service conditions. For material characterization and comparison, tension or bending have the advantage of needing lower forces and test pieces are easily produced. For free vibration tests, torsion is normally used and the tests are restricted to low frequencies and amplitudes. Testing at resonance is generally restricted to bending and amplitude and frequency effects cannot be measured
ISO 4664 gives advice on suitable test pieces dimensions, strain amplitudes and frequencies for forced vibration tests in the form of tables. Distinction is made between small and large sized apparatus, which is essentially separating the larger servo-hydraulic machines used for product testing and obtaining design data from the thermo-mechanical analysers used for material characterization. The oscillations may be superimposed on any form or level of static strain and ISO 4664 suggests this for general use in tests in tension and compression. A prestrain may be particularly relevant for product tests and the mode of static strain may be different to the mode of the dynamic strain.
The repetition of strain cycles, as is the normal procedure in a forced oscillation test, may cause progressive change in the dynamic properties for two reasons. First, at the beginning of the test there may be stress softening as a result of mechanical conditioning (see Chapter 5) and the dynamic properties will, for practical purposes, reach a steady equilibrium level after a few cycles. More troublesome, is a continued change in property level due to the generation of heat within the test piece raising its temperature. This is most likely to occur with materials having a large loss factor tested at high strain amplitudes. Hall and Thomas^ give an example of a high loss material where the time to give a temperature rise of 2°C would be 30 sec at 15 Hz.
The effect of strain amplitude is most pronounced in compounds containing reinforcing fillers and can result in a reduction in shear modulus of as much as a factor of 4 when going from a very small strain to about 10%. This is due to breakdown of filler structure which is associated with energy losses that cause a peak in the tan5 value. It was because of this that earlier British and international standards called for tests to be made at 2 and 10% shear strain, a sensible recommendation that has been overlooked in the present version. Turner^ produces an interesting model based on frictional elements to explain this behaviour.

180 Physical testing of rubber
Dynamic properties are dependent on both frequency and temperature and it is possible to approximately relate the two effects quantitatively. Preferably, results would be obtained over the range of frequencies and temperatures of interest but, if it is required to transform modulus results to other temperatures or frequencies, use may be made of the so-called Williams, Landel and Ferry (WLF) equation^. The general form of the effect of temperature on complex modulus and tan5 is shown in Figure 9.5. The effect of increasing or decreasing frequency is to shift the curves to the right or left respectively along the temperature axis. At room temperature the order of magnitude of the effect of temperature on modulus for a typical rubber is 1% per °C and the effect of frequency of the order of 10% per decade.
TEMPERATURE
Figure 9-5. Effect of temperature on dynamic properties
To obtain consistent and reproducible results it is normal practice to mechanically condition tests pieces before forced vibration tests. ISO 4664 advises scragging for at least six cycles at the maximum strain and temperature to be used in the test series followed by recovery at room temperature for at least 12 hours.

Dynamic stress and strain properties 181
2. REBOUND RESILIENCE
Rebound resilience is a very basic form of dynamic test in which the test piece is subjected to one half-cycle of deformation only. The strain is applied by impacting the test piece with an indentor which is free to rebound after the impact. Rebound resilience is defined as the ratio of the energy of the indentor after impact to its energy before impact expressed as a percentage and, hence, in the case where the indentor falls under gravity, is equal to the ratio of rebound height to the drop height, which is the measure used in most instruments. The resilience is also equal to the ratio of the square of velocities before and after impact and timing gates have been added to apparatus to enable automation of the data reading.
Resilience is not an arbitrary parameter but is approximately related to the loss tangent:
R = —^ = exp(- TT tan S)
E,
where ER = reflected energy, Ei= incident energy, and EA = Ei - ER = absorbed energy.
The relationship is not particularly accurate because tan 6 is strain dependent and in an impact test the form of applied strain is complex and its magnitude not controlled. The value of tan 8 is assumed to be that relevant to a frequency of l/2t where t is the dwell time of the indentor.
Despite resilience being such a crude measure of a dynamic property it is an attractive test, especially for quality control purposes, because of its simplicity and the fact that the apparatus required is inexpensive. The two basic forms of resilience apparatus are a ball falling under gravity and an indentor attached to a swinging pendulum; over the years a large number of instruments based on these principles have been devised. Although the falling ball method was probably the earliest in use, the pendulum type is now the most widely used and standardised. It is not particularly clear why this should be the case because the falling ball is rather more simple in concept and is usually a smaller instrument and at the same time robust. It is also free from friction and vibration in the suspension members. However, an advantage of the pendulum is that a greater range of equivalent frequencies can be easily obtained without change of indentor size.

182 Physical testing of rubber
2.1 Pendulum Methods
A number of pendulum methods have been standardised over the years but the present ISO standard, ISO 4662^ is not based on any particular pendulum design but on giving limits for various parameters. A few years ago, extensive interlaboratory investigations were carried out within TC45 to determine the effect of pendulum parameters on measured resilience and the conclusions from those investigations has led to the present standard.
The standard states that "apparent strain energy density" which, with certain assumptions, can be related to impact strain, should be held constant to obtain equivalent results. The body of the standard gives conditions and procedures to obtain 'standard' resilience values and the following parameters are specified:-
Indentor diameter D = 12.45 - 15.05 mm Test piece thickness d = 12.5 ± 0.5 mm Impacting mass m = 0.35 Q J kg Impact velocity V = 1.5 ;! ^ m/s
2
Apparent Strain energy density = j - =351^2?^ kJW
In fact, these values correspond to those for the well known Lupke pendulum and also for a modified version of the Schob pendulum.
It is also necessary for the rigid parts of the pendulum to be sufficiently stiff to avoid spurious vibrations, for the impact to occur at the centre of percussion and for corrections to be made for friction if necessary. The test piece must either be bonded to a backing plate or very firmly clamped by mechanical means or vacuum.
In an appendix to ISO 4662, apparatus parameters for five different test piece thicknesses are given which it is claimed result in results very near to the "standard" parameters.
In a second appendix, very brief details of three particular penduli are given together with references to full descriptions. The Lupke takes the form of a horizontal rod with a hemispherical indentor end suspended by four cords such that it describes an arc of a circle of 2000 mm radius as shown in Figure 9.6. The scale is normally mounted horizontally and calibrated directly in percentage resilience. The Schob consists of a simple rod pendulum with the majority of the mass located in the 15 mm diameter indentor. The Zerbini pendulum, which exists in various sizes, consists of a rod carrying the indentor and rotating under the action of a torsion wire (see Figure 9.6).

Dynamic stress and strain properties 183
(P)
(d)
SUPPORT CORD
(0 0
Figure 9-6. Rebound resilience apparatus, (a) Lupke pendulum; (b) Schob pendulum; (c) Dunlop pendulum; (d) Goodyear-Healey pendulum; (e) tripsometer (m = off-centre mass); (f)
Zerbini torsion pendulum
The British standard, BS 903:Part A8^, is not identical because it also specifies the Dunlop tripsometer. A previous version additionally included the Dunlop pendulum which is a compound pendulum shaped to ensure high rigidity, attached by a spindle and ball races to a massive structure. The indentor is 2.5 cm diameter and the test piece a 50 mm square block 25 mm thick. The ISO method is included, but in different format, as Method B and two appendices.
The Dunlop tripsometer is an unusual design of pendulum consisting of a 42 cm diameter steel disc mounted on bearings and with an out of balance mass in the form of a bracket carrying the 4 mm diameter indentor attached to its periphery. It operates at considerably higher strain energy density than the ISO method but is claimed to have high accuracy and can be used with a relatively small test piece. Compared to the Lupke pendulum, it is also a very compact apparatus.
ASTM D1054^^ now specifies only the Goodyear-Healey pendulum (it previously also included the Schob). The Goodyear-Healey is a simple pendulum consisting of a rod mounted on ball races with an additional mechanism for measuring the depth of penetration of the indentor. A note

184 Physical testing of rubber
indicates that it is no longer made, from which one assumes that it is httle used. The dimensions of the components are given and it is much larger and heavier than the ISO parameters. Hence, a thick (50 mm) test piece is needed. One curious instruction is for boiling the test piece to conduct tests at elevated temperature.
At the time of writing, there is an ASTM project to produce a standard for the Schob pendulum which seems to be making slow progress. The draft has little detail of the pendulum dimensions, which is probably so that the standard will encompass the two (at least) versions of the apparatus that have existed.
Characteristics of various penduli together with typical results obtained in ISO work are shown in Table 9.1.
Table 9-1. Variation of resilience with characteristics of the apparatus
Instrument Velocity Contact time (s) Resilience (%) (cm/s)
Schob Lupke
Dunlop Tripsometer Goodyear-Healey
0.0075 0.0091
0.00127 0.031 0.032
Calculated
0.0087 0.011
0.019 0.070 0.028
Payne and
Scott
0.003 to 0.005 0.04 0.2
Natural
70 80
85 87 87
SBR
47 55
63 63
67.5
Neoprene
42 52
60 58
65.5
Butyl
sl 11
20 23
31.5
The contact times are calculated by using the formula given in Chapter for indentation by a ball, from which Scott derived that:
Contact time (seconds) = C\ -1 n-0.278 V-'R
where W = striking energy (kgf cm), V = striking velocity (cm/sec), E = Young's modulus (kgf/cm), R = striker radius (cm) and C = constant, approximately 3.2.
The radius R is involved in the energy W and it is found that contact time is proportional to radius.
The calculated times in Table 9.1 are for E = 25 kgf/cm and the measured (?) times those given by Payne and Scott^^ (Payne and Scott did not make it absolutely clear that the times in question were measured.) The frequency can be taken as the reciprocal of twice the dwell time. In general, resilience is lower the higher the frequency but the Goodyear-Healey gave surprisingly

Dynamic stress and strain properties 185
high resihence figures, which could be associated with lack of rigidity. It should be noted that the modified specification for the Schob given in the ISO standard yields results equivalent to the Lupke.
1.1 Falling Weight Methods
One of the oldest and best known falling weight instruments is the Shore Scleroscope in which a hemispherically headed striker is allowed to fall under gravity down a graduated glass tube. This instrument has been used with metals, plastics and rubbers and is sometimes wrongly described as measuring hardness. Another falling weight instrument is specified in ASTM D2632^ , sometimes called the Bashore Resiliometer, in which a shaped plunger weighing 28 g falls under gravity with the guidance of a vertical rod. It is obviously essential that care is taken to minimise friction between the plunger and rod.
Most developments of falling weight resilience apparatus following the scleroscope have used a steel ball as the striker. A number of instruments have been described including that of Robbins and Weitzel ^ and the ADL tester'"^ and claims made*^ that improved falling ball apparatus can be more sensitive than an advanced pendulum such as the tripsometer. An apparatus produced at Rapra^^ illustrates several of the improvements which can be made relative to the scleroscope. A wide tube in relation to ball size is used to ehminate friction and the ball, which is dropped by a magnet, can be varied. Test pieces down to 2 mm thickness can be used, clamped by the dead weight of the dropping tube. Such an apparatus has many advantages such as robust construction and small size and offers possibilities of automation. One disadvantage is that, although frequency is readily varied by change of ball size, the level of frequency is usually much higher than the pendulum apparatus and higher than many applications require. As might be expected, lower values of resilience are recorded than with the Lupke pendulum'^.
The Bouncemeter*^ is a novel variation on resilience measurement where the ball strikes the test piece at an angle of approximately 45^ and the horizontal distance traveled after rebound measured. The advantage is that the distance is easily measured by observing where the ball lands in a sand bed. The paper gives results for different ball sizes and test piece thickness and derives a relationship with Bashore resilience. Actually, this form of apparatus has previously been used to measure the ball/surface response for tennis when higher velocities where obtained by firing the ball from an air gun and speeds measured by timing gates. More recently, a procedure has been standardised^^

186 Physical testing of rubber
3. FREE VIBRATION METHODS
In free vibration methods, the rubber test piece, with or without an added mass, is allowed to oscillate at the natural frequency determined by the dimensions and viscoelastic properties of the rubber and by the total inertia. Due to damping in the rubber, the amplitude of oscillations will decay with time and, from the rate of decay and the frequency of oscillation, the dynamic properties of the test piece can be deduced.
Free vibration methods generally have the advantage that the apparatus is relatively simple compared to forced vibration methods. There are, however, a number of disadvantages; the amplitude of oscillation changes due to damping and, to avoid changing conditions because of amplitude dependence of the dynamic properties, the method is limited to small amplitudes. The method is also restricted to relatively low frequencies and to change frequency the test piece size and/or auxiliary weights or springs must be changed. Generally, free vibration methods are more appropriate to fundamental material characterisation than to generating engineering data, and, with small sized forced vibration apparatus becoming more widely available, the use has declined.
The equation of motion of a freely vibrating rubber and mass system can be expressed as:
d^x S" dt ^, ^
dt CO dx
where: m = vibrating mass, x = displacement, t = time, S" = out-of-phase component of stiffness, S' = in-phase component of stiffness, and co = angular frequency.
The solution of this equation gives:
S' = mco' 1 + - ^ 4;r'
S" = !!l^ n

Dynamic stress and strain properties 187
tan J = A
d l + _A_
4 ^
where A = log decrement
3.1 Yerzley Oscillograph
The Yerzley oscillograph is specified in ASTM D945^^ and is shown schematically in Figure 9.7. It consists of a horizontal beam pivoted so as to oscillate vertically and in so doing deform the test piece mounted between the beam and a fixed support. A pen attached to one end of the beam records the decaying train of oscillations on a revolving drum chart. The dynamic deformation of the test piece can be superimposed on a static strain and the mode of deformation can be either shear or compression. The mass and, hence, the inertia of the beam can be varied by attached weights.
Figure 9-7. Yerzley oscillograph, (a) Apparatus; (b) trace of decaying wave train
It would seem reasonable to derive values for in-phase and out-of-phase moduli and tan 8 from the data generated. However, D945 specifies the calculation of the in-phase component of modulus and a number of other

188 Physical testing of rubber
parameters including set and creep from static loading and the Yerzley resilience and hysteresis. Yerzley resilience is defined as the ratio A3/A2 in Figure 9.7 expressed as a percentage. This quantity approximately equals exp(-y2tan8) and must not be confused with rebound resilience. Yerzley hysteresis is defined as (100 - Yerzley resilience).
The amplitude of deformation with this apparatus must change by a fairly large amount to obtain reasonable precision and, consequently, it is likely that the stress/strain curve will be non-linear over the range measured, particularly in compression. Hence, only an 'effective' modulus ia then measured. The range of frequency obtainable is small at a level of a few hertz.
It seems curious that such an "old fashioned" apparatus continues to be standardised but one must assume that there are a number in existence which continue to give good service.
3.2 Torsion Pendulum
The most widely used type of free vibration apparatus is the torsion pendulum which in its simplest form consists of a strip test piece clamped at one end and with a mass to increase inertia at the other. If the strip is twisted and released it, will execute a series of decaying torsional oscillations. A number of different designs of torsion penduli have been described of varying complexity and examples are given in references 20-26. A particular form of torsion pendulum, termed torsional braid analysis^'' ^ ' ^ , uses a wire or cord coated with the polymer to be tested. The instrument described by Gergen and Keelen^^ is an example of the torsion pendulum moving into the classification of forced oscillation by applying external power to the pendulum to maintain constant amplitude.
Torsion pendulum methods are standardised in ISO 4663^ . Three methods are given, in method A the mass of the inertia member is supported by the test piece, in method B the mass of the inertia member is counterbalanced via a fine suspension wire and in method C the oscillations are maintained at constant amplitude by supplying energy to the system. Hence, method C is not really a free vibration method but it will be convenient to consider it in this section. Schematic diagrams of the apparatus are given in Figure 9.8. BS 903:Part A31^^ specifies one method which is essentially the same as method B of the ISO standard, and notes alternative means of suspending the test piece and of recording the oscillations. ISO 4663 has a bibliography giving reference to original descriptions of the procedures standardised.
The scope of ISO 4663 states that the methods cover the relatively low range of frequencies from 0.1 to 10 Hz at low strains of less than 0.05% in

Dynamic stress and strain properties 189
shear. The methods are primarily intended for determining transition temperatures by measuring modulus and damping as a function of temperature, and it is suggested that they are not particularly accurate for absolute determination of modulus.
MIRROR
COUNTER WEIGHT
TEST PIECE
Figure 9-8. Types of torsion pendulum, (a) Free oscillation apparatus with inertia member supported by test piece; (b) free oscillation apparatus with inertial member supported by a
fine wire. In both types of apparatus, a lamp and scale is used in conjunction with the mirror to observe the oscillations. The broken lines indicate compensation devices to produce a
constant amplitude apparatus
Few details of the apparatus are given in ISO 4663, it is simply stated that means shall be provided to measure frequency to ±1% (±5% in a transition region), amplitude to ±1% and, for method C, the supplied energy to ±2%. It is suggested that a moment of inertia of about 0.03 gm is suitable for the inertia member which may be a disc or rod. For methods B and C the torsion wire should be of such dimensions that its restoring torque is not more than 25% of the total restoring torque due to the test piece and suspension. BS 903 (equivalent to method B of ISO 4663) suggests that moments of inertia between 50 and 500 g cm are suitable and states that the tensile strain on the test piece should be between 0 and 5%. The British

190 Physical testing of rubber
Standard also gives methods for determining the moment of inertia of the pendulum.
For rotational oscillations, the appropriate relationships are:
R' = I(D \ . ^ 4;r^
R"=l^ TV
tan o = —7-
n. 1 + ^ AK
where R' = in-phase component of rotational stiffness(torque/radian), R" = out-of-phase component of rotational stiffness, I = moment of inertia of the vibrating system, co = angular frequency, and A = log decrement.
Modulus can be obtained from rotational stiffness by using the formula for static torsion of a strip test piece:
bh'k
where 1 = free length of test piece, b = test piece width, h = test piece thickness, and k = numerical factor depending on test piece geometry. Then:
2 r 7 / - 2 | - ^ I 1 G' = AK^Iin\ + An' bh'k
G" = A7dlf-A ^ bh'k
where f = frequency in hertz. For methods B and C of ISO 4663 and the BS method, the effective
fi-equency term is f - fo and the associated log decrements Aand Ao where f

Dynam ic stress and strain properties 191
= frequency with the test piece, fo = frequency without the test piece, A = log decrement with the test piece and AQ = log decrement without the test piece.
The comphcation of AQ in the term 1 + A/4n^ is ignored. For method B of ISO 4663 and the BS method, the log decrement of the
rubber is given by:
A „ = A - A . ^ V
For method C of ISO 4663:
K A . =
47df^A
where K = compensating mechanical moment and A = amplitude of oscillations.
The above relationships indicate what may be derived from torsional pendulum measurements. In fact, BS 903 calls for G' and G" and the log decrement, although it does not actually say how to calculate the log decrement for the rubber. BS 903 also allows a circular cross section test piece, when the term 1/bh k is replaced by dW32 where d is the diameter of the test piece.
In the current (1986) version, ISO 4663 calls for the dynamic modulus and log decrement. The dynamic modulus is calculated from:
G* =12;rV// V An' bh'k
This is in fact the in-phase modulus G'. The factor 12 appears to be an error carried over from the previous edition when the factor k (called C in the ISO) was three times the factor defined in the British Standard, but in this latest version is actually the same.
ISO 4663 is in the process of being revised as ISO 4664-2 to update it editorially and to correct the errors, although it has been questioned whether torsion penduli are still sufficiently used to warrant a standard.
ISO 4663 gives no advice as to the relative merits of the three methods it specifies. Method C, which is not strictly a free vibration method, removes the difficulties associated with changing amplitude through the course of the test but at the expense of a rather more complex apparatus. When the inertia member is supported by a torsion wire, as in method B, the tensile strain in the test piece can be controlled to a low level by means of counterweights.

192 Physical testing of rubber
4. FORCED VIBRATION METHODS
There are several possible approaches to the measurement of dynamic properties using forced oscillation of the test piece and the methods can be classified in various ways. The first distinction is between forced vibration at or near resonance and forced vibration away from resonance, with measurements at frequencies away from resonance being by far the most common.
The forced vibration methods away from resonance can again be subdivided into those which apply deformation cycles and those which apply force cycles, the more usual being deformation cycles. An alternative form of test uses transient loading instead to continuous cycling.
The range of frequency covered can be roughly divided into bands of consequence to different applications:
Low frequency <1 Hz Medium frequency 1 to 100 Hz High frequency > 100 Hz Another way of classifying apparatus is according to the means of
driving the test piece into oscillation, which can be mechanical, electromagnetic, hydraulic or by wave propagation.
A distinction which is increasingly used, and is adopted in ISO 4664, is between large and small sized apparatus. Essentially, the term large apparatus generally applies to servo-hydraulic machines which can apply quite large forces in compression and shear. This type of test machine is used to generate design data and also to test products. The term small apparatus refers to modest capacity bench mounted machines generally termed dynamic mechanical thermal analysers (DMTA). These use various deformation modes and are generally used to characterise materials as a function of temperature and frequency.
4.1 Brief review of forced vibration apparatus
Mechanical activation can be applied in at least three ways. A screw type machine, similar in concept to a 'static' tensile machine can be made to apply force or displacement cycles but is limited to low frequencies, perhaps up to 2 Hz. A rotating eccentric weight will apply force cycles and an eccentric cam can be used to apply displacement cycles. Quite large strain amplitudes can be realised with mechanical activation, being limited only by the force on bearings, etc. but the frequency is restricted, generally to a maximum of about 50 Hz, and fatigue life of the machine may be poor. Generally, mechanically driven machines have been superceded by servo-hydraulic apparatus.

Dynamic stress and strain properties 193
Electromagnetic vibrators can cover a very wide frequency range, in particular being capable of very high frequencies up to at least 10" Hz, although at this level considerable care is needed. Quite high power is obtainable, but electromagnetic drive is more commonly applied to relatively small machines and low strains. It is also used in forced oscillation methods at resonance.
Closed-loop servo-hydraulic activation is generally limited to frequencies of up to 100 Hz but in all other respects it is the most versatile method. A servo-hydraulic test system is shown diagrammatically in Figure 9.9. Either force or strain can be controlled in the same machine and it is possible to use waveforms other than sinusoidal. Relatively large forces sufficient to test products and at large deformations can be realised, usually in the combination of high forces and small deformations or lower forces and large deformations. Multi-axis and mixed mode stresses can be applied to give full characterisation of products. The penalties for this versatility are high cost compared to simple machines and the complexities of operation.
STATIC AND DYNAMIC SIGNAL GENERATOR
^ f
CONTROLLER
^ f SERVO VAI VF
[POWER [AMPLIFIER
^ ivv
J FORCE 1 AMPLIFIER
> I
r J - ^ [
1
vcy
HYDRAULIC POWER SUPPLY
r L
I
^
FORCE TRANSDUCER
TEST •^ PIECE DISPLAY 1
D A ^J
DISPLACEMENT AMPLIFIER
DISPLACEMENT > TRANSDUCER
^
Figure 9-9. Schematic diagram of servo-hydraulic dynamic test apparatus
The number of particular designs of dynamic test machine is virtually legion and there is no question of considering each of them here but reference can be given to a number of types that have been, or are, used.

194 Physical testing of rubber
Of the mechanically driven machines, the Roehg^^ used a rotating eccentric weight whereas the RAPRA sinusoidal strain machine^^'^' used an eccentric cam. The Rotary Power Loss Machine^^ is also in this latter category but the mode of deformation is not simple shear or compression. Two electric motors with suitable clutches and belt drives were used to strain a hyperbolic profile ring test piece bonded to two metal rings such that frequencies from below 1 up to 50 Hz could be achieved^^
Servo-hydraulic test machines have been around for a surprisingly long time and the principles were outlined by Owens " in 1973. They would be much more widely used were it not for their very high cost. For descriptions of machines commercially available reference is best made to the literature of manufacturers of advanced testing systems. Some of the potential errors in servo-hydraulic systems and their correction, particularly for high frequencies, have been discussed^ ' ^ and equipment for multi-axial tests described^''^^
One of the early examples of an electromagnetic machine which became very well known was the Rheovibron originally developed by Takayanagi^^. This used small test pieces in tension generally in the frequency range 3.5 -110 Hz and over a range of temperatures. The apparatus could also be adapted for use in compression" ^ and shear" ^ and at high elongations' .
The Rheovibron could be thought of as one of the first dynamic mechanical thermal analysers. DMTA is typified by small electromagnetically driven apparatus but can also cover free vibration apparatus and a large variety of analysers have appeared on the market, representing numerous different geometries and control systems. As a generalisation, they are machines working with small test pieces which are especially efficient at characterising materials as functions of temperature and frequency to give comparative results, but may not give accurate absolute values and are not suitable for characterising products over a range of strains and deformation modes. Perhaps their greatest importance has been in encouraging a much increased amount of dynamic testing because of their efficiency in use and relatively modest cost. There is of course no fine distinction as to whether an apparatus is a dynamic analyser and the so called analysers vary considerably in their capability.
The Polymer Laboratories instrument" ^ is one of the best known and is driven electromagnetically. It typifies the analyser concept in allowing automatic scanning through frequency and temperature. Also driven electromagnetically is an instrument developed at the NPL " which can be used with standard shear test pieces. Honing the efficiency of dynamic testing by using strain and frequency scans rather than more time consuming temperature scans has been investigated"^ . Rather against the trend, an apparatus described by Yokouchi and Kobayashi" ^ uses a mechanical drive

Dynamic stress and strain properties 195
in order to obtain higher driving forces. A review of the development of DMTA apparatus and their use for polymers has been given by Geering" .
One difficulty with DMTA is the potential for uneven temperature distribution and temperature lag when scanning as temperature is ramped up or down. The consequences of lag were considered by Lacik et al" , and methods of calibration using pure substances of known melting point" ^ and liquid filled polymer matrices^^ have been suggested.
The Dynaliser^ ' ^ is rather different to most dynamic test machines, the mode of deformation being indentation and the dynamic characteristics are deduced from a force relaxation curve. McGuiggan and Yarusso^^ used a modified atomic force microscope to measure dynamic properties of a polymer and compared to results for tan5 obtained with a hemispherical indentor.
Another novel mode of deformation for a dynamic test is the "wobble plate" device devised by Gent et al " in which a rubber disk is subjected to a rotating tilting action by a ball that compresses the disk off-axis. A dynamic mechanical analyzer has also been specially designed to make measurements in liquid environments^^ and can operate in several modes of deformation. A new method of applying dynamic strains is by a linear moving magnet motor and instruments using this method of force generation are said to bridge the gap between traditional servo-hydraulic and DMTA machines^ .
Any rubber test piece with or without added mass has a natural or resonant frequency of vibration determined by the dimensions and viscoelastic properties of the rubber, the total inertia of the system, and the mode of deformation. If constant force amplitude cycles are applied to the rubber and the frequency varied, the resulting deformation cycles will have a maximum value when the applied frequency equals the resonant frequency of the test piece system.
At resonance (where the external mass » sample mass):
and
where fa = resonant frequency, S' = in-phase component of stiffness, m mass of vibrating system, AR = deformation amplitude at resonance, F applied force amplitude, and S" = out-of-phase component of stiffness.

196 Physical testing of rubber
Fortunately, complications due to inertia effects do not affect these calculations at resonance. From S' and S", the moduli (working in shear) G', G" and G* can be deduced. Usually, a mass is added to the rubber test piece to reduce the resonant frequency to levels of practical interest and it is quite feasible to vary the mass at a constant frequency until the system is at resonance.
Normally, electromagnetic actuation is used, as in Moyal and Fletcher's machine^^ and the resonant beam apparatus that was widely used in the motor industry to test mountings. The latter method involves transmitting the vibration to the test piece via a heavy pivoted beam made to oscillate at resonance by an electromagnetic shaker. The characteristics of the beam significantly affect the results and discrepancies can be large^ . The vibrating method in which the test piece in the form of a simple cantilever is directly vibrated without added mass has mostly been used for rigid materials but can be applied to rubber. The Du Pont DMA^ is a dynamic analyser working at resonance. Tangorra^^ described what could be seen as a sort of vibrating hardness tester, the deformation being produced by an electromagnetically driven Shore indentor at resonance. A relatively simple portable instrument on these lines would seem to have potential but the idea has not apparently been developed.
The dynamic properties of rubber can be deduced from the velocity and attenuation of waves passing through it. Quite a variety of systems have been tried and several methods using frequencies up to 200 Hz have been described by Payne and Scott^^ Sonic or ultrasonic waves can be used, although in the latter case the frequencies are much higher than are usually of practical interest. However, pulsed ultrasonic methods have been successfully used for measurements of moduli of non-isotropic plastics, but with rubbers the attenuation is too great to sustain a transverse wave at frequencies greater than 1 MHz^\ This was also found by Gerspacher et al ^ with more modem ultrasonic equipment.
4.2 Standard Methods
This will be a very brief section because the present situation is that the only ISO, BS and ASTM standards to cover forced vibration dynamic apparatus are the guides ' discussed earlier in the chapter, plus the ASTM moving die processability test covered in Chapter 6.
It is an illustration of development in standardisation to note that the 1964 edition of BS903:Part A24 described three particular types of apparatus in an appendix, whereas the 1976 edition simply required that any apparatus could be used as long as it met the stated performance requirements. From this we reach the present situation where ISO, BS and ASTM all take the

Dynamic stress and strain properties 197
approach of only giving guidelines. The logic behind this trend is that with so many different machines, particularly analysers, in use there would have to be multiple standards if they were all to be specified precisely. ISO TC 61 took the multi-standard approach for plastics, but the rubber standards committees concluded that this was unwieldy and that it was more useful to simply advise on the advantages and disadvantages or limitations of the various factors and to recommend tolerances and general procedures.
5. COMPARISON OF DYNAMIC METHODS
There does not seem to be a fully comprehensive and up to date critical account of dynamic test machines and methods for rubbers, which is particularly unfortunate because of the large variety of machines now available and the sometimes confusing claims of manufacturers. Descriptions of several machines available prior to 1960 are given by Payne and Scott* and there were reviews in the 1974 ASTM publication^^. Also of course, the ISO, BS and ASTM standard guides give a useful outline of the pros and cons of the different approaches.
Previously, standards concentrated on forced vibration in shear away from resonance, the torsion pendulum and rebound resilience. Dynamic mechanical thermal analysers are now far more popular than any of those methods because of their balance of capability and cost. Resilience remains useful because it is such a simple method for quality control purposes, whilst non resonant forced vibration methods using versatile and relatively high powered servo-hydraulic apparatus are generally considered the best for generation of engineering design data. Torsion penduli allow the determination of limited dynamic data at relatively low apparatus cost but their use has greatly diminished. Resonance methods are rarely used due to the restrictions of frequency and strain amplitude. The latest standard guides recognise the popularity of dynamic analysers in their considerable variety.
Certain of the general characteristics can be summarised: Servo-hydraulic machines can provide relatively large amplitudes of force and deformation with a continuous variation of frequency up to 100 Hz. Electromagnetic actuation is necessary for much higher frequencies but the strain amplitude is more limited. Free vibration methods are not suited to the study of amplitude variation and the frequency range of any apparatus is limited. Forced vibration non-resonant apparatus also has the advantage of being applicable to materials with a large value of tanS, whereas with free vibration apparatus the vibrations may die out rather too quickly, and with resonance methods the amplitude maximum is then not clearly defined. The strain distribution generated by some analysers may be complex and be most
198 Physical testing of rubber
suited to comparative work but they are very efficient in operation as a means of dynamically characterising materials. Resilience is the most elementary of dynamic tests and its simplicity makes it valuable for quality control purposes. In principle all methods can be used over a range of temperatures.
In theory at least, all the methods should be in agreement if all the effects of frequency, temperature, amplitude and test piece geometry are taken into account, but in practice large discrepancies are found between different machines and different laboratories. Comparisons of selected machines have been given by Del Vecchio^^ Dlubac et al " , Hagen et al^^ Lechtenbchmer^^, Ramorino et al , and Poumoor and Seferis^ . The last cited paper tested plastics but is interesting because it includes wave propagation. Wetton et al have compared stressing modes^ . Much of the difficulty of obtaining consistent results can be attributed to differences in test piece geometry and the limitations of the instruments and procedures used. Potential errors have been considered by Diamond and Henderson^^ and methods to obtain equivalent data presented by Poumoor and Seferis^ . Further useful discussion of factors important in dynamic testing is given in references 71 -74. Luo has considered results from different forms of applied deformation^^ and distinguishes three regions of behaviour in relation to amplitude^^.
Rebound resilience is so simple and different in concept to the other methods that its correlation with them is often questioned. Results provided by Bulgin are quoted by Payne and Scott" showing virtually perfect agreement between measured resilience and that calculated from three types of dynamic testing apparatus. Linear agreement was also obtained by Kainradf^ using a Schob pendulum, except that the measured values were about 20% lower than those calculated. From this, it could be deduced that Bulgin's results were obtained with a Dunlop pendulum (see Section 2.1)! Demarest ^ illustrates the calculation of resilience from DMTA testing.
REFERENCES
1. ISO 4664-1,2005. Determination of dynamic properties - General guidance. 2. ASTM D5992, 1996 (2002). Guide for dynamic testing of vulcanized rubber and rubber
like materials using vibratory methods. 3. Payne A R. Engineer, 207, 328, 1959. 4. Davey A B and Payne A R. Rubber in Engineering Practice, MacLaren and Sons Ltd.,
1964. 5. Hall M M and Thomas A G. J. IRI, April 1973, p65. 6. Turner D M. Plast. Rubb. Process. Appl, 9, 1988, pi97. 7. Ferry J D. Viscoelastic Properties of Polymers, J. Wiley and Sons, 1970. 8. ISO 4662, 1986. Determination of rebound resilience of vulcanisates. 9. BS 903:Part A8, 1990. Method for determination of rebound resilience.

Dynam ic stress and strain properties 199
10. ASTM D1054,2002. Resilience using a Goodyear-Healey rebound pendulum. 11. Payne A R and Scott J R. Engineering Design with Rubber, MacLaren and Sons Ltd.,
1960. 12. ASTM D2632 2001. Resilience by vertical rebound. 13. Robbins R F and Weitzel D H. Rev. Sci. Instrum., 40, 8, 1969, pl014. 14. Raphael T and Armeniades C D. SPE Transactions, 83, April 1964. 15. Madan R C. Rubb. and Plastics Weekly, 144,679, 1963. 16. Brown R P and Boult B G. RAPRA Members Journal, July/Aug. 1975, p64. 17. Rodriguez F, Acevedo M A. ACS Polymeric Materials Science and Engng., volume 75,
1996, p464. 18. BS EN 13865 2003. Surfaces for sports areas. Determination of angled ball behaviour.
Tennis. 19. ASTM D945 1992 (2001). Rubber properties in compression or shear (Mechanical
oscillograph). 20. Fahmy I, Abdul-Wahab M S and Shalash R J. Polym. Test., 9, 2, 1990, pl27. 21. Gillham J K. and Roller M B. Polym. Eng. and Sci., 11,4, 1971, p295. 22. Gergen W P. and Keelen T L. Rubb. Journal, Sept. 1970, p81. 23. Bell C L M, Gillham J K and Benci J A. SPE 3rd Annual Tech. Conf. Antec 74,
California, May 1974. 24. Anzani I, Xiang P Z and Pritchard G. Polym. Test., 5, No. 4, 1985. 25. Gillham J K. Polym. Eng. and Sci., 7, 225, 1967. 26. Cowie J.M and Fergusson R. Brit. Polym. J., 15, No. 1, 1983. 27. ISO 4463, 1986. Determination of dynamic behaviour at low frequencies - Torsion
pendulum method. 28. BS 903 Part A31, 1976. Determination of the low frequency dynamic properties of
rubbers by means of a torsion pendulum. 29. RoeUg H. Rubb. Chem. and Tech., 18, 62,1945. 30. Payne A R. RABRM Res. Report 76, 1955. 31. Payne A R. RABRM Res. Memo. R411, 1958. 32. Bulgin D and Hubbard D G. Trans. IRI, 34, 201, 1958. 33. Tangorra G. Kautschuk und Gummi Kunststoffe 23,3, 1979, plOO. 34. Owens J.H. SAE/ASTM Symposium, 'Measurement of the Dynamic Properties of
Elastomers', Detroit, Jan. 1973, p.43. 35. Diamond W C, Henderson G E. ACS Rubber Division Meeting, Detroit, October 17-20,
1989, Paper 75. 36. MTS Systems Corporation. Indian Rubber J., 30, Nov.-Dec. 1997, pi06. 37. Coveney V A, Jamil S, Johnson D E. Constitutive Models for Rubber III Conference, 1-
\f^ September 2003, Proceedings, p381. 38. White L. Eur. Rubb. J., 175,2, 1993, p22. 39. Takayanagi M. Memoirs of the Faculty of Engineering, Kyushu University, 23,41, 1963. 40. Murayama T. J. Appl. Polym. Sci., 20, 9, 1976, p2593. 41. Murayama T. J. Appl. Polym. Sci., 19, 12, 1975, p3221. 42. Voet A and Marawski J C. ACS Div. of Rubb. Chem., Paper 42, Preprint 012, May, 1974. 43. Wetton, R E. Polym. Test. 4, No. 2-4., 1984. 44. Dean G O, Duncan J C and Johnson A F. Polym. Test., 4, No. 2-4., 1984 45. Deckman H, Peterson U, Gearing J. Polymer Testing '95,15-16* June 1995, Paper 11 46. Yokouchi M. and Kobayashi Y. (1981). J. App. Polym. Sci., 26, p4307. 47. Gearing J. In Handbook of Polymer Testing, R Brown Ed., Marcel Dekker, New York,
1999.

200 Physical testing of rubber
48. Lacik I, Krupa I, Stach M, Kucma A, Jurciova J, Chodak I. Polym. Test., 19, 7, 2000, p755.
49. Lotti C, Canevarolo S V. Polym. Test., 17, 7, 1998, p523. 50. Mano J F, Cahon J P. Polym. Test., 23,4 2004, p423. 51. de Meersman C and Vandoven P. Int. Polym. Sci. and Tech., 8, No. 9, 1981, pT71. 52. de Meersman C. ACS Rubber Division Meeting, Cleveland, October 13-16 1981, Paper
68. 53. McGuiggan P M, Yarusso D J. ACS Polymeric Materials: Science and Engineering, New
Orleans, 23-27 '' March 2003, Proceedings, p532. 54. Gent A N, Thompson T T, Ramsier R D. Rubb. Chem. Tech., 76,4, 2003, p779. 55. van de Velde J G, Foreman J, Weddle B. Proceedings of 60 * SPE Annual Technical
Conference, San Fransisco, 5-9**' May 2002, Paper 643. 56. Biegler K K. ACS Rubber Division Meeting, Pittsburgh, October 8-11* 2002, Paper 10. 57. Moyal J E and Fletcher W P. J. Sci. Instrum., 22, 167, 1945. 58. Hilberry B M. ASTM STP553, 1974, p.l42. 59. Gill P, Lear J O and Leckenby J N. Polym. Test. 4, No. 2-4, 1984. 60. Tangorra G. Rubb. Chem. and Tech., 34, 1, 1961, p347. 61. Brown R P, Hughes R C and Norman R H. RAPRA Members Journal, Sept. 1974, p.225. 62. Gerspacher M, O'Farrell C P, Nikiel L, Yang H H, Le Mehaute F. ACS Rubber Division
Meeting, Montreal, 5-8* May 1996, Paper 6. 63. Del Vecchio R J. 144th ACS Rubb. Div. Meeting, Orlando, 1993, Paper 35. 64. Dlubac J, Lee G F, Duffy J V, Deigan R J and Lee J D. Polymeric Materials Sci. and
Engng.Vol.60, 1989,p579. 65. Hagen R, Salmen L, Lavebratt H and Stenberg B. Polym. Test. 13,2, 1994, pi 13. 66. Lechtenbchmer A. Int. Rubb. Conference Paris, 1990, p573 67. Ramorino G, Vetturi D, Cambiaghi D, Pegoretti A, Ricco T. Polym. Test., 22, 6, 2003,
p681. 68. Poumoor K and Seferis J C. Polymer, 32, 3, 1991, p445. 69. Wetton R E, Foster G M, Marsh R D and Duncan J C. ANTEC '89, New York, 1989. 70. Diamond W C and Henderson G E. ACS Rubb. Div., Las Vegas, 1990, Paper 75. 71. Howgate P G and Berry J P. 125th ACS Rubb. Div. Meeting, Indianapolis, 1984, Paper
14. 72. Howgate P G. 118th ACS Rubb. Div. Meeting, Detroit, 1980, Paper 35. 73. Gregory M J. Polym. Test. 4, No. 2-4, 1984. 74. Clamroth R. Polym. Test., 2, No. 4, 1981. 75. Luo D Z. Polym. Test., 9, 1, 1990, p39. 76. Luo D Z. Polym. Test., 8, 2, 1988, p83. 77. Kainradl P. Rubb. Chem. Tech., 29, 1082, 1956. 78. Demarest C. Plast. News, 18, 20„ 1989, p 16.

Chapter 10
CREEP, RELAXATION AND SET
Creep, stress relaxation and set are all methods of investigating the result of an apphed stress or strain as a function of time. Creep is the measurement of the increase of strain with time under constant force; stress relaxation is the measurement of change of stress with time under constant strain and set is the measurement of recovery after the removal of an applied stress or strain. It is important to appreciate that there are two distinct causes for the phenomena of creep, relaxation and set, the first physical and the second chemical. The physical effect is due to rubbers being viscoelastic, as discussed in Chapter 9, and the response to a stress or strain is not instantaneous but develops with time. The chemical effect is due to 'ageing' of the rubber by oxidative chain scission, further crosslinking or other reaction.
In practice, it is often rather difficult to distinguish between the two causes and it could be argued that if tests are made under the same conditions as in service it matters relatively little what caused, for example, the creep as long as it can be measured. However, if any form of accelerated conditions, such as increased temperature, is used it follows that results could be very misleading. Generally, distinction is helped by the fact that physical effects are dominant at short times and low temperatures and chemical effects more apparent at longer times and higher temperatures.
Apart from being simply measures of how much a rubber creeps, relaxes or sets under any given conditions, these tests can also be used as measures of ageing characteristics, low temperature resistance or resistance to chemicals. These other applications of the tests are not generally considered in this chapter but it is impossible to make a complete distinction. In particular, set tests commonly used as a quality control tool involve heat

202 Physical testing of rubber
ageing, and stress relaxation tests to measure the efficiency of rubbers as seals often involve both heat ageing and exposure to liquids.
1. CREEP
A creep test is in essence very simple - a constant force is applied to the rubber and the change in deformation with time monitored - but detailed procedures were not standardised internationally until 1988 and there is still no general ASTM method. This reflects the relatively small amount of creep testing carried out on rubbers, which in turn is due to the relatively few rubber products where creep is a problem. This is in contrast to the situation with thermoplastics where creep performance is a prime engineering factor. However, for particular applications of rubber where creep is important, for example bridge bearings, a considerable amount of data has been generated.
The present ISO standard for creep is ISO 8013^ which specifies procedures for measurements in compression and shear. In earlier standards, creep and stress relaxation were covered in the same documents and creep in tension was included. One reason for the separation was that stress relaxation became more important for seal performance, whereas creep remained a more minority interest. Measurements in tension were dropped on the basis that engineering components are not generally stressed in this manner. However, it is worth noting that, if a general indication of creep performance is required, the strains in tension can be relatively large and only quite simple apparatus is necessary. Such a simple method is included in the ISO standard for tension set described in Section 3.2. The British equivalent, BS903:Part AlsMs identical to ISO 8013.
There has been some controversy over the definition of creep which should be used. Traditionally, creep was defined in the rubber industry as the increase in deformation after a specified time interval expressed as a percentage of the test piece deformation at the start of that time interval. In other industries creep is normally defined as the increase in deformation expressed as a percentage of the original unstressed dimension of the test piece. Consequently, care has to be taken when comparing creep values obtained from different sources. ISO 8013 has both definitions, calling them creep index and creep increment respectively. The definition of creep increment in the standard refers to the original dimension as thickness, which would not apply to tension. ISO 8013 also defines a compliance index which is the ratio of the increase in strain to the constant applied stress.
If, as is frequently the case with rubbers, the deformation change is linear with log(time), it is convenient to express results as a creep rate, which is the

Creep, relaxation and set 203
ratio of the creep to the logarithm of the time interval and is often quoted as percent per decade. Rather surprisingly, this is not included in ISO 8013.
In the International Standard, the test pieces for measurements in compression are discs either 29 mm in diameter and 12.5 mm thick or 13 mm in diameter and 6.3 mm thick, i.e. the same as used for compression set. It is optional whether the test pieces are bonded to end plates; i.e. the measurements can be made with no slippage at the compressed surfaces or with some slip, lubrication being recommended (see Section 6 of Chapter 8). For measurements in shear, a double sandwich test piece is used as discussed in Section 7 of Chapter 8, preferred dimensions being 25 mm diameter and 5 mm thick.
The principal requirements for the apparatus in compression tests are that one compression plate is fixed and the other is free to move without friction. The force must be applied smoothly and without overshoot and the mechanism must be such that the line of action of the applied force remains coincident with the axis of the test piece as it creeps, and the force maintained to within ±0.1%. The compression of the test piece should be measured to ±0.1% of the initial test piece thickness. Apparatus for measurements in shear is essentially the same as for compression except for the differences in geometry of the test piece and its mounting. Although adequate creep data can be obtained with relatively simple apparatus, care must be taken in the design to minimise friction, to ensure smooth application of the load which then always acts coincident with the axis of the test piece and to avoid drift in the strain measuring device over long time periods. An example of a fairly sophisticated creep apparatus for rubbers which can operate in compression or shear is very briefly described by Hall and Wright^, and an arrangement for a compression test is illustrated in Figure 10.1.
ISO 8013 recommends that the test piece is mechanically conditioned by straining 5 times to a higher strain than used in the test between 16 and 48 hours before test, which is intended to remove any irreversible structure. It is then specified that a force shall be applied within 6sec such that an initial strain of 20 ± 2% is reahsed. The deformation of the test piece is measured after 10 min with further measurements after 10, 100, 1000 min etc. The calculation of results calls for creep increment, creep index and compliance increment after the specified time. Obviously, the strain and time scale could be adjusted to suit individual applications and the creep could be presented graphically as a function of log(time).
A hardness test can be used to measure creep by continuing the test over a series of times. This was used many years ago by Wood and Roth" to comprehensively investigate creep behaviour of several compounds at temperatures from -60 to 25^C.

204 Physical testing of rubber
(\
M Pivot
Load
3 2 : T T
transducer
V/A Tostptooe
Figure 10-1. Arrangement for creep in compression
2. STRESS RELAXATION
Stress relaxation measurements can be made in compression, shear or tension, but in practice a distinction is made as regards the reason for making the test which is generally related to the mode of deformation. The most important type of product in which stress relaxation is a critical parameter is a seal or gasket. These usually operate in compression and, hence, stress relaxation measurements in compression are used to measure sealing efficiency.
Stress relaxation measurements can also be used as a general guide to ageing, and it is particularly relaxation due to chemical effects which is then studied. Such measurements are normally made in tension and will be considered in Chapter 15 as an ageing test. Hence, in this section, only relaxation tests in compression will be discussed as this mode of deformation is the only one commonly used and standardised to directly estimate the relaxation of rubbers in service. For an application in tension, the methods described in Chapter 15 could, of course, be adapted. It must be appreciated that the methods in compression do not only measure relaxation due to physical effects, especially when elevated temperatures and liquid environments are used, so that the distinction is a little blurred.
The measurement of decay of sealing force with time is a most important design consideration and, although this has been long appreciated, the widespread use of such tests was inhibited by the inherent instrumental
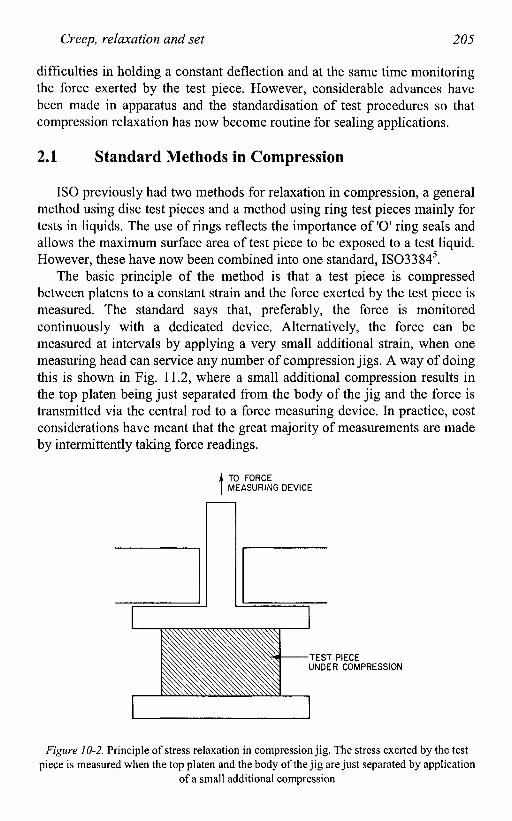
Creep, relaxation and set 205
difficulties in holding a constant deflection and at the same time monitoring the force exerted by the test piece. However, considerable advances have been made in apparatus and the standardisation of test procedures so that compression relaxation has now become routine for sealing applications.
2.1 Standard Methods in Compression
ISO previously had two methods for relaxation in compression, a general method using disc test pieces and a method using ring test pieces mainly for tests in liquids. The use of rings reflects the importance of'O' ring seals and allows the maximum surface area of test piece to be exposed to a test liquid. However, these have now been combined into one standard, 1803384^.
The basic principle of the method is that a test piece is compressed between platens to a constant strain and the force exerted by the test piece is measured. The standard says that, preferably, the force is monitored continuously with a dedicated device. Alternatively, the force can be measured at intervals by applying a very small additional strain, when one measuring head can service any number of compression jigs. A way of doing this is shown in Fig. 11.2, where a small additional compression results in the top platen being just separated from the body of the jig and the force is transmitted via the central rod to a force measuring device. In practice, cost considerations have meant that the great majority of measurements are made by intermittently taking force readings.
TO FORCE MEASURING DEVICE
TEST PIECE UNDER COMPRESSION
Figure 10-2. Principle of stress relaxation in compression jig. The stress exerted by the test piece is measured when the top platen and the body of the jig are just separated by application
of a small additional compression

206 Physical testing of rubber
In ISO 3384, the specified accuracy offeree measurement is ±1% and the compression must be maintained to within ±0.01 mm. If a small extra stress or strain is added when force is measured, this must be less than IN or 0.05 mm. The compression plates must be flat to within 0.01mm with surface finish not worse than 0.4|Lim Ra and, for ring test pieces, have a central hole to allow the circulation of liquid. The stiffness of the plates must be such that they bend by less than 0.01 mm under load.
The disc test piece is 13 mm in diameter and 6.3 mm thick, the same as the smaller button specified for creep and for compression set. Previously, the larger 29 mm diameter and 12.5 mm thick button was also specified, but its use meant heavier, and hence more expensive, jigs to take the higher loads. The alternative ring test piece is 15mm inner diameter, radial width 2mm and thickness 2mm ,but other size rings and seals or gaskets of different configuration are allowed. The test pieces are not bonded to end pieces but compressed with lubrication of the ends with either a fluorosilicone fluid or the immersion liquid used in the test.
Two test procedures are given but for both the preferred applied compression is 25%, with 15% or lower being allowed for stiff materials. In procedure A, the test piece is compressed at the test temperature and all force measurements are made at that temperature, whilst in procedure B compression and force measurements are made at 23°C, the test piece being subjected for intervals to the test temperature. In a previous version of the standard there was also a procedure C in which the compression was applied at 23^C and force measurements made at the test temperature, but this hybrid has been dropped. With procedure A, there may be difficulty with some designs of apparatus in loading hot, and with procedure B an apparatus with a large thermal capacity may take a long time to cool. It should be noted that the standard does not cover the use of temperatures below ambient because experience has shown that very poor reproducibility is likely due to the relatively large force that can be generated by the additional over-compression.
Thermal and mechanical conditioning of the test pieces has been made normal practice in this edition. The procedure involves heating to 70^C for 3 hours, then holding at standard laboratory temperature for 16 to 24 hours, followed by five cycles of compressing to the compression to be used in the test. The reason for the conditioning is explained as being to help improve reproducibility rather than to emulate service conditions. The requirement here can be compared to that for creep, and in some cases it might be better to follow the advice given for dynamic tests (see Chapter 9).
The test pieces are compressed in a time between 30 s and 2 min, and in both methods A and B the initial force measurement FQ is made 30 min after compressing the test piece. The counterforce is then measured again at

Creep, relaxation and set 207
intervals, the standard length of test being 168 h, and a logarithmic time scale is recommended for longer times. For method B, the jig and test piece is cooled for 2hrs before measurement, force cooling being applied if necessary.
The exposure can be either in air or a liquid chosen to simulate service conditions. Commonly, ring test pieces are chosen for liquid exposure, so simulating the geometry of practical seals and giving a relatively large surface area to volume ratio so that equilibrium swelling is reached reasonably quickly. It should be noted that the swelling effect of the liquid will affect the relaxation pattern measured and an increase in stress may be seen over a limited time period if there is a volume increase.
The force measurements are normalised to the initial force measurement and expressed as a percentage:
F
where Rt is the stress relaxation after time t. With this method of expressing results, the force units used are of no
importance and the result is not, in general, critically dependent on the degree of applied strain. If stress relaxation values are obtained after a number of times, the results are plotted as a function of time on a logarithmic scale. The standard also notes that for some applications plotting the ratio FI/FQ is more useful, and in fact this is common practice.
The British standard is identical to ISO 3384, being numbered as both BS ISO 3384 and BS 903 Part A 42^ Whilst interest in stress relaxation measurements was increasing in Europe because of its relevance to sealing applications, the general ASTM method was withdrawn because of lack of interest. However, that has now been rectified and ASTM D6147^ has two procedures similar to ISO. The test pieces specified are compression set buttons and a 2 mm thick washer 19 mm OD and 17.5 mm ID. It is not known why the ring or washer dimensions differ between ISO and ASTM. An interesting feature in D6147 is that two well known commercial compression jigs are described as examples.
There are also ASTM methods for gasket material^ and laminated composite gasket materials^ which uses the expansion of a calibrated steel bolt to measure the force. The test is restricted to 22hrs compression, usually at lOO^C.
Experience with compression stress relaxation measurement was not particularly widespread when the ISO standard was first formulated, a variety of apparatus was in use and reproducibility was not good. Birley et al ^ studied a number of factors and made recommendations for change.

208 Physical testing of rubber
some of which were incorporated into the latest revision. Other improvements resulted from interlaboratory testing trials. The reproducibility figures in the current standard show method A to be considerably better than method B, which is no doubt a consequence of the repeated heating and cooling.
2.2 Apparatus
A force measuring element permanently attached to the test piece holding jig may be the preferred way of monitoring the force and it certainly eliminates some instrumental problems. However, as mentioned earlier, cost considerations have resulted in most apparatus having individual jigs which are placed under a single force measuring head in turn.
Although the principle of a jig such as that illustrated schematically in Fig. 11.2 is fairly simple, in practice there are many difficulties. The two essential problems are to provide an efficient and reproducible detection system for the point at which the extra compression is applied and to prevent the platens tilting whilst not introducing appreciable friction.
The force measuring head, together with provision for applying the extra compression, can be a beam balance, as used in the well known Lucas apparatus, a universal tensile machine or a specially designed electronic load cell unit ' ^ The point at which the small amount of extra compression has been applied can be detected by breaking an electrical circuit. An early apparatus used a load cell attached to an arbor press. The operator manually lowered the press until the break in the electrical circuit was indicated visually by the extinction of a light. The Lucas apparatus had a similar detection system, the balance weights were adjusted manually until the force exerted by the beam just overcomes the force exerted by the test piece. Both of these approaches involve a somewhat delicate operation. The use of a tensile machine affords some reduction in experimental difficulty but a very slow speed must be used to avoid overshoot as the increase in compression is very small, less than 0.05 mm in ISO 3384.
Apparatus, such as that developed at RAPRA^^ has been designed to reduce as far as possible operator dependence. A load cell is driven onto the jig by a pneumatic ram; at the moment when a very small additional compression on the test piece is detected electrically, the ram is automatically stopped, the force reading digitally recorded and the ram reversed. The Rapra measuring head can be used with a variety of jig designs including Lucas.
The jigs illustrated in an earher ASTM standard utilised ball bushings for the load application to slide in and the electrical contact was made through a circular plate. In principle, this arrangement gives good lateral stability but

Creep, relaxation and set 209
introduces friction which may be excessive, and the large electrical contact area is not conducive to a clean break.
The Lucas jigs use a ball contact to make and break the electrical circuit which is very effective but, as they have no lateral constraint, are prone to tilting and, hence, can only be used with rings having a large diameter to height ratio.
The RAPRA jigs use a ball electrical contact but provide lateral support through circular leaf springs with high lateral but low vertical stiffness which eliminates friction. A small correction is made to the measured force for the vertical spring stiffness. These jigs utilise a ceramic insulator element and corrosion resistant steel which has allowed several years stable use in water, and are of relatively massive construction to accommodate stiff button test pieces. The disadvantage is the relative complexity and high cost.
An alternative approach to detecting slight over-compression with an electrical circuit is to arrange for a preset amount of over-compression. Simple jigs of this type relying on a mechanical stop will probably produce excessive over-compression and be somewhat variable in use. The actual amount of over-compression of the test piece will depend on the stiffness of the load cell and errors can be introduced by any lack of parallelism of the plates and plunger. However, if they are machined to tight tolerances, this type of jig can be very effective and relatively cheap.
Fernando et al*"* have introduced the concept of an ideal loading curve, which is the condition when a completely smooth and instantaneous uptake of load occurs on compression. They show that this does not occur with a fixed over-compression jig and, hence, errors are likely. They do not present data for electrical contact jigs saying that, although they are ideal in theory, they have other disadvantages. The one disadvantage the best ones certainly have is complexity and cost and probably this was an important reason why they developed a non-electrical contact jig to have as near a perfect loading curve as possible. Their jig is constructed with particular attention to parallelism of the important surfaces to give a smooth and stable uptake of load which is deduced from a recording of the stress strain curve.
Addy et al ^ designed a rig especially for use in gamma irradiated environments which is unusual in having the load cell dedicated to a single jig. The ASTM method for gaskets ' is a novel approach to having a dedicated force measuring system using the expansion of a calibrated bolt to indicate force. The degree of relaxation with many composite gaskets would be relatively large and it is not known whether this approach would be satisfactory with low relaxation rubbers. Cook et al ^ describe a device of similar concept using a bolt and load washer.
With any of the designs of apparatus, considerable care must be taken to ensure accurate alignment of components and to standardise procedures if

210 Physical testing of rubber
reproducible results are to be obtained. James and Peppiat ' made a detailed study of the Lucas jig and suggested improved test procedures.
If, as is usually the case, it is required to make measurements at non-ambient temperatures, the detailed mechanical design and thermal capacity are important. For example, the Lucas jigs are very lightweight and the apparatus has an 'oven' built into the measuring head. Hence, they are fairly convenient for procedure B of the ISO method for rings but are very difficult to load hot and, therefore, not convenient for procedure A (this apparatus is not suitable for ISO 3384 using disc test pieces). On the other hand, the Rapra jigs have relatively high thermal capacity which makes them less good for procedure B.
The difficulties and expense of compression stress relaxometers led Bassi and Zerbini ^ to consider an alternative approach which they term pressure relaxation. Compressed air is applied through a small hole in the centre of the one platen and the pressure when air leaks past the test piece recorded. This pressure, being nominally that to equalise the pressure exerted by the compressed rubber, is related to the compression force.
2.3 Use of Stress Relaxation Data
The standard methods for stress relaxation are generally restricted to periods of about a week, whereas in practice the performance of seals is required to be known over periods of years. In a large scale study conducted at RAPRA on behalf of industry (but not published), the stress relaxation of a range of rubbers for pipe seals was measured in both air and water for several years. A generalised conclusion was that in most cases a simple extrapolation of short term data was not valid, particularly in liquids. Meier and Kuster ^ made measurements for up to 17 years in the dry and obtained some success in correlating results from short term tests by the method of reduced variables, but noted that at longer times the dominance of chemical relaxation could cause errors. Burton et al ^ made measurements for one year and applied an Arrhenius relationship to predict for five years.
Predictions to longer service times are clearly complicated by ageing and the effect of fluids. Gillen et al ^ investigated the diffusion limited oxidation effect on relaxation measurements in compression and produced a method to eliminate the errors than can arise. Derham^^ demonstrated the effects that arise from the cycling of temperature and immersion in liquids and concluded that, whilst swelling effects could be adequately described by theory, temperature effects would need to be measured for each set of circumstances.
When purely physical relaxation is of interest, there is advantage in making tests at very short times. To this end, Birley and Ahmad^^ devised a

Creep, relaxation and set 211
relaxometer that loaded the test piece rapidly such that measurements could be made from 50|as.
Tahir and Birley " have considered the tangent modulus at intervals on the stress relaxation curve and compared it to the modulus of the initial loading curve to derive what they termed the Modulus Enhancement Factor, hence adding to the information which can be gained from a stress relaxation test.
Because compression set measurements have been used traditionally as an indication of sealing performance and because they are relatively simple tests to perform, it is of interest to know what correlation exists between compression set and compression stress relaxation. Ebbul and Southem^^ have investigated the correlation for a number of compounds and conclude that, although a reasonably good general correlation existed, it was not good enough to predict one property from the other. The RAPRA work mentioned above also included compression set measurements and did not find good correlation with stress relaxation. In theory, set can be related to the difference between continuous and intermittent stress relaxation, but this is generally of little use in the case of seals when only continuous relaxation is of interest. However, Sprey^^ has demonstrated that predictions of compression set can be made from intermittent and continuous tension relaxation measurements.
3. SET
The rubber industry has traditionally paid more attention to measuring the recovery after removal of an applied stress or strain, i.e. set, than to creep or stress relaxation. This is partly because relatively simple apparatus is required and it is a convenient way to get an indication of the state of cure, but also because it appears at first sight that set is the important parameter when judging sealing efficiency. Set correlates with relaxation only generally and it is actually the force exerted by a seal that usually matters, rather than the amount it would recover if released.
Set tests are made in either tension or compression and for their prime use, quality control, the choice of mode can be made according to the convenience of the test piece available. If intended to simulate service conditions, e.g. indentation of flooring, the most relevant mode of deformation would be used. Tests can be carried out in which the test piece is subjected to either constant stress or constant strain but, as the latter is by far the most widely used, the illustration of set measurement given in Figure 11.3 is based on constant strain in the compression mode.

212 Physical testing of rubber
THICKNESS OF
TEST PIECE ( / )
TIME
Figure 10-3. Illustration of compression set. to = initial thickness; ts = compressed thickness; tr = recovered thickness
Referring to Figure 11.3, the test piece is more or less instantly compressed and held at that compression for a fixed length of time. The test piece is then released and its recovered height measured. It is common practice to measure the recovered height 30 min after release of the test piece but this is an arbitrary time. The term permanent set is sometimes used but if this has any meaning it would be referring to the set remaining after an infinite recovery time. Set is normally expressed as a percentage of the applied deformation, i.e.
Set ^^—^xlOO%
but can be expressed as a percentage of the original thickness. The measurement of set is a very effective quality control test as it is
relatively simple and the results are sensitive to state of cure. However, because of the widespread use of set measurements as an indication of seal performance, it is worth pointing out that the usual short term set measurements do not necessarily correlate well with long term performance^ ' ^ If set is to be used as a measure of performance, it is necessary to largely disregard the arbitrary conditions specified in standard methods and test under conditions relevant to service which may, for

Creep, relaxation and set 213
example, involve recovery at the test temperature and measuring set as a function of time and/or temperature.
3,1 Tests in Compression
At the time of writing, there is only one international standard for compression set, ISO 815^ , which covers tests at ambient, elevated and low temperatures, the previous separate standard for low temperature having been withdrawn. However, drafts are being progressed in ISO TC 45 so that there will again be a separate standard for low temperatures. This indecision is perhaps understood if you consider that the test is basically the same whatever the temperature, but in practice those made at low temperature required changes in apparatus and are generally not made with quite the same objective in mind.
In ISO 815, two sizes of disc test piece are allowed, either 29 mm in diameter and 12.5 mm thick or 13 mm in diameter and 6.3 mm thick, the same as used for creep. The larger size is preferred for low set materials because of the greater accuracy. The measurements of test piece thickness are made using a flat foot and not with a domed foot as was earlier practice (see Section 2.1 in Chapter 7).
Only a constant strain method is specified with a standard strain of 25% for rubbers up to 80 IRHD, 15% for those 80 - 89, and 10% for those over 90. The compression is made between very smooth platens which are lubricated and, hence, the compression is made with some attempt at perfect slippage. Fairly obviously, the degree of slip and the test piece shape factor can affect the measured values of set. At one time it was standard to use glass-paper between the test piece and the platens to prevent slip but this produces greater concavity of the ends after release.
The test piece is compressed at 23 °C and then held at the test temperature for a set time, commonly 24 h. For elevated temperatures the test piece is either immediately removed and allowed to recover at 23' C for 30 min before measurement or allowed to cool whilst still compressed and measured after a further 30 min recovery. The first procedure has been standard for many years but is not a particularly logical sequence as it allows recovery at an undefined cooling rate, which must differ between the two sizes of test piece. A third alternative, not included, is to allow recovery at the test temperature. Recovery is speeded up at an elevated temperature and slowed down if cooling takes place under compression.
For tests at low temperature, the test piece is released at the test temperature and a series of measurements made over the period up to 2 hours. It is necessary that the test piece can be released and the measurements made within the low temperature cabinet without touching the

214 Physical testing of rubber
test piece. The thickness is plotted against log time and the set can be calculated at one or more times of recovery. This procedure of recovery at the test temperature is essential for low temperature tests because set at low temperatures is totally due to physical mechanisms and the degree of set will be critically dependent on the recovery temperature.
The British Standard for compression set, BS903 Part A6, ^ is identical to ISO 815. Originally, it also contained a procedure for compression set under constant stress but this was deleted in 1974 because of lack of use. At intervals there have been suggestions that it should be reinstated because of its resemblance to the service conditions of certain products such as flooring and footwear. The truth one suspects is that there is no need for this test for quality control purposes but a constant stress method with conditions chosen to simulate a particular application may be useful. The standard method used a calibrated spring to apply the compression force which ranged from 1100 N to 7300 N depending on test piece and test temperature, and set was expressed as a percentage of original thickness.
When the standard is revised as two parts of ISO 815 it is expected that there will be more details of the special apparatus needed for low temperature work and tightening of some tolerances to aid reproducibility.
ASTM has not succumbed to the changing of mind about combining or separating tests at low temperatures and has stayed with having D395^^ for normal and elevated temperatures and D1229^^ for low temperatures.
D395 specifies both constant strain and constant stress methods for use in air. The constant strain procedure is similar to the ISO and British methods, but only recovery at room temperature is specified. The constant stress method uses a cahbrated spring to apply a force of 1.8 kN on the larger compression set disc and expresses the result as a percentage of the original thickness. One slight oddity is that it appears to favour cutting test pieces from sheet, as moulding is given as optional. D1229 is a constant strain method, essentially the same as D395, with the measurement of recovery being made, as in the ISO equivalent, at the test temperature. D1414 refers to D395 and includes tests in liquids as well as air.
ASTM D945 refers to set measured when dynamically testing with the Yerzley oscillograph (see Chapter 9), and D1414^^ is a collection of test methods for 'O' rings that includes both compression and tension set. The compression method is an adaptation of D395 for ring test pieces. ASTM F36 ' and F806^^ for gasket materials appear to be very short term compression set measurements with conditions depending on the gasket in question.
The rate at which a rubber recovers after compression can be an important consideration and Isayev et al ^ devised an apparatus to measure recovery at very short times. For quality control, the time to complete a

Creep, relaxation and set 215
compression set test is relevant and Spetz^^ described an instrument for obtaining results in only 25 min. Tests at low temperatures are often subject to large variability which is especially likely to be a problem as the glass transition is approached. Many years ago, Jahn^^ found that the confidence interval of individual measurements could increase by a factor of about 8 in this region, and it has more to do with the rapid change with temperature than the tolerances on set measurement.
3,2 Tests in tension
The standardization process is often considered to be very slow but, since the last edition of this book, a new simple procedure for tension set at constant stress using weights (ISO 12244) has been published and then withdrawn because the method was incorporated into the long established constant strain method, ISO 2285" . The "traditional" method for tension set uses a constant strain procedure with either strip, dumb-bell or ring test pieces. The actual length of a strip test piece is not specified but the preferred reference length is 50 mm and this is also the preferred distance between the square ends of the dumb-bell. The advantage of the square-ended dumb-bell is that it can be simply clipped into a slotted bar and does not need grips as such. Similarly, rings are relatively easily fitted over pulleys. It is doubtful whether the difference in size between the various test pieces would significantly affect the results as long as the necessary precision in measurement was maintained but, clearly, the longer the gauge length the greater the tolerance that can be accepted.
The test apparatus is simply a rod or other suitable guide fitted with a pair of grips or pulleys, one of which is movable, and a measuring device accurate to 0.1 mm. It should be noted that, although simple, the straining and measuring devices need to be carefully constructed as the tolerances on measurement are quite small. More precision is required than in earlier standards when a dumb-bell with a reference length of 100 mm was used. It is usual to measure the reference length of ring test pieces along a straightened portion of the ring, in which case a rigid channel is required to straighten the test piece.
A choice of strains is given, with 100% the preferred value; the most usual test time is 24 h and the test temperature is commonly 70°C or lOO^C. The test piece is strained at between 2 and 10 mm/s and the reference length measured between 10 and 20 min later. If it does not fall within given tolerances about the nominal strain, the test piece is rejected. Presumably, if appreciable relaxation occurs in this period, it may be necessary to overstrain initially with test pieces clamped well outside of the reference length. For

216 Physical testing of rubber
tests at elevated temperatures, the test piece is placed in the oven between 20 and 30 min after applying the strain.
At the end of the test exposure period, the test piece is allowed to cool under one of three alternative methods. In method A, the preferred procedure, the strain is released and the test piece allowed to recover for 30 min at ambient temperature; in method B the recovery is at the test temperature for 30 min followed by 30 min at ambient temperature, whilst in method C the strained test piece is cooled for 30 min at ambient temperature, the strain then released and the measurement made after a further 30 min. The preferred recovery procedure corresponds to the traditional one for compression set and is a marked change from earlier versions of the standard where only method C was specified. Set is expressed as a percentage of the applied extension.
It is apparent that this standard procedure is a little more involved than the corresponding procedure for compression set, and also that the procedures differ in the details of timing and the choice of conditions under which recovery takes place. This will affect, as will the large difference in the bulk of the test pieces, the correlation between the two types of set measurement, all of which illustrates the arbitrary nature of these standard methods. An interesting comparison of compression and tension set was made, recovery being made after a succession of heating cycles, showing that results for tension were always lower than for compression"^ . Apparently, this has not been considered more recently and no explanation was given.
The constant stress method in ISO 2285 uses a dumb-bell with a 100 mm long straight portion. The standard load is 2.5 MPa with set measured as a percentage of the original length after 60 min of loading and 10 min recovery at ambient temperature. The elongation after 60 min under load is used to obtain a measure of creep. These measurements, together with the elongation after loading for 30 s, are intended simply as rapid quality control methods. Indeed, as regards the tension set part, it represents in many ways a return to the procedure, including the dumb-bell, which was in ISO 2285 several decades ago!
The equivalent British Standard is identical to ISO 2285 and numbered as BS ISO 2285. Apart from a procedure in the standard D1414 for 'O' rings, the only ASTM method for tension set is that given in ASTM 0412" ^ for tensile properties. Two very simple procedures are given, either a test piece is strained, held for 10 min, released and the reference length measured after a further 10 min, all at room temperature; or the set at break is found by fitting the broken pieces back together and measuring the reference length. Clearly, ASTM does not give tension set the same status or attention as compression set.

Creep, relaxation and set 217
REFERENCES
1. ISO 8013, 1988. Determination of creep in compression or shear.
2. BS 903 Part A15, 1990. Determination of creep in compression or shear. 3. Hall M M and Wright D C. RAPRA Members Journal, No. 5, Sept./Oct. 1976. 4. Wood L A, Roth F L. Fourth Rubber Technology Conference, London, 22-25* May 1962,
Preprint 28. 5. ISO 3384, 1999. Determination of stress relaxation in compression at ambient and at
elevated temperatures. 6. BS 903 Part A42, 1999. Determination of stress relaxation in compression at ambient and
at elevated temperatures. 7. ASTM D6147, 1997 (2002). Determination of force decay (stress relaxation) in
compression. 8. ASTM F38, 1999 (2003). Creep relaxation of a gasket material. 9. ASTM F1276, 1999 (2003). Creep relaxation of laminated composite gasket materials. 10. Birley A W, Fernando K P, Takir M. Polym. Test., 6, No. 2, 1986. 11. Aston M W, Fletcher W and Morrell S H. 4th Int. Conf on Fluid Sealing, Philadelphia,
1969. 12. Solid Rubber Seals and Joints, RAPRA Technical Review, No. 53, Nov. 1970. 13. Brown R P and Bennett F N B. Polym. Test., 2, No. 2, 1981. 14. Fernando K P, Birley A W, Hepburn C and Wright N. Polym. Test. 3, No. 3, 1983. 15. Addy S W, Clegg D W, CoUyer A A, Crum P. Polym Test., 6, 5, 1986, p379. 16. Cook N, Dawson D, Thomas K. Deformation Yield and Fracture of Polymers, Cambridge,
Proceedings, 1991, pi 7/1 17. James, D I and Peppiatt A. Polym. Test. 2, No. 4, 1981. 18. Bassi A C and Zerbini V. Polym. Test. 6, No. 1, 1986. 19. Meier U, Kuster J and Mandell J F. Rubb. Chem. Technol. 57, No. 2, 1984. 20. Burton T, DeLanaye J L, Rader C P. Rubb. Plast. News, 18, 10, 1988, p22. 21. Gillen K T, Keenan M R, Wise J. Angew. Makromol. Chem., 261/262, Dec. 1998, p83. 22. Derham C J. IRC'96 Conference, Manchester, June 17-21,1996. 23. Birley A, Ahmad S. Brit. Plast. Rubb., Sept. 1994, pi 1. 24. Tahir M, Birley A W. Polym. Test, 7, 1, 1987, p3. 25. Ebbul M D and Southern F. Plas. & Rubb. Proc. and Appl. 5, No. 1, 1985. 26. Sprey R. Rubb. World, 191, No. 1, 1984. 27. Moakes R C. RAPRA Members Journal, Sept./Oct. 1975.p.77. 28. Brown R P, Butler T, Hawley S W. Aging of Rubber. Accelerated Heat Ageing Resuhs,
Rapra Technology Ltd., 2001. 29. ISO 815, 1991. Determination of compression set at ambient, elevated or low
temperatures. 30. BS 903 Part A6, 1969. Method for determination of compression set at ambient, elevated
or low temperatures. 31. ASTM D395, 2003. Rubber property - Compression set. 32. ASTM D1229. 2003. Rubber property - Compression set at low temperatures. 33. ASTM D 1414, 1994 (2003). Test methods for rubber 'O' rings. 34. ASTM F36, 1999. Compressibility and recovery of gasket material. 35. ASTM F806,1999. Compressibility and recovery of laminated composite gasket material. 36. Isyev A I, Cao D, Dinzberg B. ACS Rubber Division Meeting, Cleveland, 17-20* October
1995, Paper 47. 37. Spetz G. Polym. Test., 14, 2, 1995, p 203. 38. Jahn H-J. Technical Notes for the Rubber Industry, N° 43, Bayer, Germany, 1970.

218 Physical testing of rubber
39. ISO 2285, 2001. Determination of tension set under constant elongation and of tension set, elongation and creep under constant tensile load.
40. Loan L D, Rowe P D. Polymer Letters, 2, 1964, p63. 41. ASTM D412, 1998 (2002). Tension.

Chapter 11
FRICTION AND WEAR
It is well appreciated that friction and wear are interrelated subjects simply because friction is involved in wear mechanisms. Indeed, both friction and wear can be studied and measured in the same experiment and this is done in, for example, the investigation of bearings and sliding joints. Friction plays its part in rubber wear mechanisms and needs to be considered when these mechanisms are being studied. Furthermore, with a major rubber product, tyres, friction (resistance to slip) and wear are two of the most important performance parameters. However, when it comes to laboratory measurements on rubber the two tests are generally considered as separate subjects and historically have not been accredited equal status. Whereas friction tests have rarely been standardised and are carried out in relatively few laboratories, dozens of wear or abrasion tests have been developed, quite a few have been standardized and abrasion apparatus is relatively common in rubber laboratories. It can be argued that this situation is not unreasonable, as far more than simply friction is involved in rubber wear processes and wear is probably seen to be directly a problem in more applications of rubber than is friction. On the other hand, the role of friction in slipping accidents and in sports activities has assumed huge importance over the last couple of decades. This has resulted in a large amount of testing and test method development which is relevant to rubbers in flooring and footwear.
1. FRICTION
Friction of rubber is a very complicated phenomenon but is generally thought of as being composed of two parts, adhesive friction and hysteresis

220 Physical testing of rubber
friction. The adhesive friction arises from the repeated formation and breaking of molecular bonds between the surface during sliding, whilst the hysteresis friction is a result of the dynamic deformation of the rubber with energy being lost. From the testing point of view, the main significance of the mechanisms of friction is that we must expect the level of friction to be dependent on both the external factors, such as the roughness of the surface, and the internal factors associated with the rubber's viscoelastic properties.
1.1 Factors affecting friction
It would appear that no account of friction is complete without first stating Leonardo da Vinci's (or Amonton's) laws and Coulomb's law of friction and pointing out that, in general, polymers do not obey them. The laws are:
(a) The frictional force opposing motion is proportional to the normal force, the constant of proportionality being the coefficient of friction (see Figure 11.1), i.e.:
where F = frictional force, \x = coefficient of friction and N = normal force.
N
F = |aN
Figure 11-1. Coefficient of friction
(b) The coefficient of friction is independent of the apparent area of contact.
(c) The coefficient of friction is independent of the velocity between the two surfaces provided that the velocity is not zero.
In practice, rubbers do not normally obey these rules and the coefficient is a 'variable constant', its value depending on the real contact area, normal load, velocity and other factors. In fact, friction is sensitive to just about

Friction and wear 221
anything, including breathing on the test piece, and any single-point measurement is of very limited use. The factors influencing friction of polymers have been discussed by, for example, James who gives a useful bibliography, and Ohhara^ who outlines the theory of rubber friction. Only the factors of most importance as regards the test method will be considered briefly here.
The apparent area of contact between two surfaces is much larger than the actual area over which they touch, even if the surfaces appear smooth. The frictional force is proportional to the real contact area, so anything that changes the real contact area will change the force measured.
When rubber is brought into contact with another surface it deforms elastically and the real area of contact will increase with increasing normal load and, hence, the coefficient of friction will decrease with increasing normal load. It is also apparent that the real contact area is dependent on the surface geometry of the test piece. It is, hence, desirable to measure the friction of rubber over the range of normal forces of interest and to test with the surface geometry to be used in service, which may mean using the product or part of it as the test piece.
An interesting aspect of contact pressure is that it is not uniform over the surface of a thick rubber block, but increases towards the edge. The effect of this on friction has been discussed by Nakajima and Takahashi^.
The distinction is sometimes made between static and dynamic friction, implying that there is one level of the coefficient of friction just at the point when movement between the surfaces starts and another level when the surfaces are steadily separating. There can of course be no measure of friction without movement so that 'static' friction is actually friction at an extremely low velocity and thereafter the coefficient of friction of rubbers may vary markedly with velocity. Hence, it is necessary to measure friction over the range of velocities of interest. Friction is also dependent on temperature, which can lead to inaccuracies at high velocities because of heat build-up at the contacting surfaces.
During a friction test, a condition known as 'slip-stick' sometimes occurs in which the relative velocity and the coefficient of friction between the two surfaces both oscillate about a mean value. The essential condition for slip-stick to occur is that in the velocity region being considered the coefficient of friction falls with increasing velocity. An over-simplistic description of the phenomenon is that for a short time the surfaces stick together and the force builds up as in a spring until it exceeds the 'static' coefficient of friction when movement occurs and the friction falls to a lower kinetic value and the spring releases until sticking again takes place. Slip-stick can in fact occur at high velocities, when the frequency of vibration can be high enough to cause audible squeals. The amplitude and frequency of the slip-stick vibrations

222 Physical testing of rubber
depend on the rigidity and damping of the testing system as well as on the properties of the surfaces. To minimise slip-stick it is necessary to construct the test apparatus, particularly the drive and force measuring elements, to be as stiff as possible. If slip-stick can occur in service, its presence can be more important, or rather troublesome, than the actual mean level of friction.
It is fairly obvious that other factors such as lubricants, wear debris, ageing of the surfaces and humidity can also affect friction and, once again, test conditions must be chosen that resemble those found in service.
1.2 Methods of measuring friction
The essential requirements for a friction test are two contacting surfaces, a means of creating relative motion between them and a system to indicate the frictional force. A number of different arrangements are then possible, a selection being shown in Figure 11.2.
(a)
/
\ ZZy
\ /
N
A
' i-// " I V
(b)
( c ) ,/V
'm^mmmmmmmm ^ V
\N^wcoze
Figure 11-2. Arrangements for friction tests, (a) Linear track; (b) rotating shaft; (c) towed sled; (d) pin and rotating place (e) inclined plane. N = normal force, V = direction of motion,
W = weight of test piece

Friction and wear 223
An example of a driven sled apparatus has been described by James"*, Griffin^ devised a test for small cylindrical plastic test pieces and Mustafa and Udrea^ used a rotating steel disc and a stationary plastic test piece. A ball and peg machine is described by Bailey and Cameron^, a hemispherically ended pin and flat plate device by West and Senior , a steel pin running on a plastic ring by Jost and a combined inclined and horizontal plane by Wilson and Mahoney^ . A computerised plane on plane reciprocating apparatus was developed by Benabdallah^^ and a ring on disc was used by Bielinski et al . Roberts and Alhston-Greiner^^ developed a machine with ball or cylinder on flat geometry whilst Bandel and Di Bernardo " aimed at simulating tyres with a rotating wheel on a rotating flat arrangement, but this list is by no means exhaustive.
The towed sled is the most common form of test and many such apparatus have been devised. Whilst simple in principle, there are practical problems in that the sled will tend to tilt if it is not towed on the plane where the surfaces meet, and if the means of applying the force is a wire or cord, the lack of stiffness can cause slip-stick.
An attractive basis for a good quality friction test is a universal tensile testing machine because it can be suitably stiff, gives a very wide range of speeds and has a precise force measuring system. The only difficulty is that such machines operate in a vertical plane and, if the normal load on the test piece is applied by a weight acting vertically under gravity, the linkage to measure the frictional force must turn through 90°, and in doing so there is a danger of introducing friction at a pulley and decreasing the stiffness of the system.
Appreciating these difficulties of precisely measuring the frictional properties of polymers, a novel apparatus operating vertically in a tensile machine was developed at Rapra and has been described by James and Newell . The advantages of the apparatus (Figure 11.3) are that, in conjunction with a suitable tensile tester, a very stiff system results with very accurate measurement of small forces and a good range of velocity. The construction used also overcomes the inherent problem in sled devices of accurately aligning the force direction with the plane of the sliding surfaces. It can be operated in an environmental chamber, so giving a wide range of temperatures and the test piece geometry can be readily changed, including tests on products or parts of products. Using this apparatus, James and Mohsen^^ have illustrated the importance of specifying sample preparation and test conditions for rubber.
Product areas where friction of rubber is particularly important are roads and floor surfaces where it is convenient if measurements can be made in-situ. Consequently, a considerable number of portable devices have also been developed.

224 Physical testing of rubber
Load cell
Pivot
Figure US. Rapra friction apparatus
The friction of road surfaces is often measured with a skid tester developed by the Road Research Laboratory'"^ and this has also been widely used on other surfaces and floors, including artificial sports surfaces. It is a pendulum device, the movement of which is arrested by the foot of the pendulum skidding on the surface to be measured. The 'skid resistance' indicated can be approximately related to coefficient of friction by:
Skid resistance-330// 3 + //

Friction and wear 225
A number of other instruments have also been developed for this purpose, including the Tortus apparatus^^, which is essentially a self-propelled, four wheeled trolley with a sliding foot, and various portable towed sleds. Other devices developed for sports surfaces are the Leroux pendulum, which is similar in principle to the skid tester, a traction apparatus that works in torsion and a sliding resistance tester comprised of a large trolley given momentum by a ramp. The use of these methods in artificial sports surface testing has been discussed by Brown^ . Tests for flooring and footwear are not always portable, some utilise a whole shoe with linear motion such, as the Satra slip test^^'^\ and many workers favour walking on a full sized ramp^ . The reasoning behind test methods for slip resistance and descriptions of several apparatus, together with a large bibliography, have been given by James^ . James pointed out a long time ago the importance of kinetic friction in shoe/floor interaction " but strut devices measuring "static" friction have been popular in the USA^ ' ^ . Summaries of European investigations have been given ' ' ^ but there is no doubt that the subject of pedestrian friction is extremely complex and there is no general agreement as to the best measurement methods. The Hughes gauge, a really novel but simple apparatus which would let us all do our own slip measurements, relies solely on the geometry of the slider .
Because of the sensitivity of friction to so many variables, it is often desirable, if not essential, to test the actual product in a prototype test rig. Certain of the slip resistance tests have headed in that direction by using complete shoes as the slider. Similarly, instrumented systems are used to investigate the grip of tyres under real road conditions. Generally, a product test rig will be the best approach for items such as bottle closures and bearings.
Reviews of methods and equipment for friction and wear of rubbers have been given by Mitsuhashi^^ and Sviridyonok and Kirpichenko" ^ and a number of comparisons between machines have been reported^ " . Correlation between different methods and with service can be relatively poor, which is perhaps not surprising considering the variety of geometries and test conditions in use and the complexity of the interaction between surfaces in such actions as walking.
1.3 Standard methods
An ISO standard for the frictional properties of rubber was published in 1999 ^ and is probably one of the most comprehensive of friction standards. It is based on plane on plane geometry on the basis that rubber samples are most readily available in sheet form and for many applications measurement between two planar surfaces most nearly approaches service behaviour.
226 Physical testing of rubber
However, it recognises that with this basic geometry involving linear motion it is often possible to substitute other shapes for one of the sliding members, for example a product such as a windscreen wiper blade.
A problem with plane on plane geometry is that if the friction plane does not contain both the line of action of the load cell and the line of the towed force then there will be a tilting moment which introduces errors. For this reason, the standard notes the preference of some workers to use a ball on plane geometry^ . Whilst this overcomes one problem, frictional force is then not proportional to normal load and the contact area must be estimated from knowledge of the modulus of the rubber. Lining up of the friction plane with load cell and towing force is achieved with plane on plane using an apparatus such as described by James and Newall^ .
The standard is not one apparatus specific but requires tight control of the important parameters and gives considerable guidance both in the text and in annexes on factors to be considered in making friction measurements. It allows for testing at a number of velocities and normal loads and procedures are given for preparing the sliding surfaces.
Three procedures for determining dynamic friction are given, the initial friction, friction after repeated movement between the surfaces and friction in the presence of lubricants or contaminants. The presentation of results gives considerable detail on the interpretation of the friction traces, including dealing with shp stick.
The ISO standard was developed from a British standard and the two are now identical, the British standard being numbered both BS ISO 15113 and BS 903 Part A 61^^ ASTM does not have a method for determination of rubber friction.
An inclined plane method is specified for coated fabrics in BS3424" . The test piece is attached to a sled resting on an inclined plane which is covered with the other surface to be tested. The inclination of the plane is varied until sliding takes place. This is probably the simplest form of friction test but not an accurate one and, of course, cannot operate at any given velocity.
BS 3424 also has a simple towed sled method which is very briefly described such that there is too little control of apparatus parameters for it to be adequate for more general or accurate work. The drive linkage is not specified in detail and some apparatus in use would lack stiffness. A better text for a towed sled is given in the international, British and European standard for plastics film" ^ which recognises the importance of parameters such as stiffness of the drive.
When evaluating the friction of surfaces such as roads or sports floors, it is necessary to standardize in some way the slider. Not surprisingly, leather has been used but it is can be variable. An early development was the rubber

Friction and wear 22 7
used in the skid tester and since then there has been detailed investigation leading to a rubber particularly suited to pedestrian friction" ' ^'^. The objective was to have a material that gives the best correlation with service experience together with good reproducibility between laboratories. Any rubber standardised for this purpose must be produced to a very precise specification and the material now very widely used is controlled by its dynamic properties at a number of temperatures.
2. WEAR
The terms wear and abrasion are used so loosely that confusion sometimes results. Wear is a very general term covering the loss of material by virtually any means. The dictionary says that abrasion is the wearing away by means of friction, although in everyday life we think of it as the rasping action of a rough surface. As wear usually occurs by the rubbing together of two surfaces, abrasion is often used as a general term to mean wear. The mechanisms by which wear occurs when a rubber is in moving contact with any material are somewhat complex, principally involving cutting of the rubber and fatiguing of the rubber. Nevertheless, we call the tests to measure this wear abrasion tests.
2.1 Wear mechanisms
An account of the mechanisms of both friction and wear has been given by Lancaster" ^ and one section of a collection of translations of papers" " describing extensive Russian work on abrasion is devoted to mechanisms. Further discussion of wear mechanisms is given, for example, by Gent and Pulford" ^ and Schallamach'* "'* . Efforts have been made to find a relationship between wear and fundamental properties of rubber" ^ and a review has been presented^^ which attempts to clarify what is understood about the abrasion process and what is still unclear.
It is possible to categorise wear mechanisms of rubber in various ways and one convenient system is to differentiate between three main factors:
(a) Abrasive wear, which is caused by hard asperities cutting the rubber. (b) Fatigue wear, which is caused by particles of rubber being detached as a result of dynamic stressing on a localised scale. (c) Adhesive wear, which is the transfer of rubber to another surface as a result of adhesive forces between the two surfaces.

228 Physical testing of rubber
Wear by roll formation is where there is progressive tearing of a layer of rubber which forms a roll. The result is a characteristic abrasion pattern of ridges and grooves at right angles to the direction of movement. The term erosive wear can be applied to the action of particles conveyed in a liquid stream and there can also be corrosive wear due to direct chemical attack of the surface.
From these definitions, it can be seen that the more specific meaning of abrasion is wear by the cutting action of hard asperities. The common practice in the rubber industry of using abrasion as a general term for wear probably results from the fact that most wear tests for rubbers use the action of sharp asperities, for example abrasive paper, to produce wear.
The wear or abrasion of rubber caused by hard asperities is not just simply cutting but involves both plastic and elastic deformation of the rubber^ However, abrasive wear requires the abradant to have hard, sharp cutting edges and high friction, while fatigue wear occurs with smooth or rough but blunt surfaces and does not need high friction. Adhesive wear is not so important for rubbers but can occur on smooth surfaces. Roll formation requires high friction and relatively low tear strength. Fatigue processes produce much less rapid wear than cutting processes.
Generally, in any wear process more than one mechanism is involved although one mechanism may predominate. The mechanism, and hence the rate of wear, can change with change of conditions such as contact pressure, speed and temperature. The most important consideration in practice is that the wear process will be complex and critically dependent on the service conditions. It is, therefore, necessary that any laboratory test must essentially reproduce the service conditions if good correlation is to be obtained. Even a comparison between two rubbers may be invalid if the predominant wear process in the test is different from that in service. It is failure fully to appreciate this which has led to the conclusion that all laboratory abrasion tests are useless except for quality control.
It follows, that there cannot be a universal standard abrasion test for rubber and the test method and conditions have to be chosen to suit the end application. In some applications, for example tyres, the range of conditions encountered is so complex that they cannot be matched by a single laboratory test. However, for many products meaningful results can be obtained by careful modification of standard abrasion tests, but great care has to be taken if the test is intended to provide a significant degree of acceleration.

Friction and wear 229
2.2 Types of abrasion test
A large number of different abrasion apparatus have been used for testing rubbers and an even larger number of permutations of the various factors would be possible. The first division of test types can be to distinguish between those using a loose abradant and those using a 'solid' abradant.
A loose abrasive powder can be used to impinge on the rubber rather in the manner of a shot blasting machine, or tumbled with the rubber test pieces in a rotating drum. These are logical ways to simulate the action of sand or similar abradants impinging on the rubber in service, as may be the case with conveyor belts or tank linings, but this type of test is not very common.
'Solid' abradants could consist of almost anything but the most common are abrasive wheels (vitreous or resilient), abrasive papers or cloth, and metal 'knives'. The possible geometries by which the test piece and a solid abradant can be rubbed together are legion and it is not sensible to make any general classification. Some well-known configurations are shown in Figure. 11.4. In type (a) the test piece is reciprocated linearly against a sheet of abradant, but alternatively a strip of abradant could be moved past a stationary test piece. A further variation is to have the abradant as a rotating disc with the test piece held against its side (b). Both the abradant and the test piece can be in the form of wheels, type (c), with either being the driven member. In type (d) the abrasive wheel is driven by a rotating flat test piece, and in type (e) both the test piece and abradant are rotated in opposite directions. Type (f) the test piece is held against a rotating drum with the abradant on its surface. The test piece can also be made to traverse along the length of the drum.
A loose abradant can also be used between the two sliding surfaces in what could be considered as a hybrid of loose and solid abradant tests. This situation occurs in practice through contamination and as a result of the generation of wear debris from a 'solid' abradant. A car tyre is an example of the situation where there is a combination of abrasion against a solid rough abradant, the road, together with a free flowing abradant in the form of grit particles.
2.3 Abradants
Abrasive wheels are characterized by the nature of the abrading particles (their size and sharpness), the structure of the wheel and the manner in which the abrasive is bonded (resilient of vitreous). Clearly, a wide range of abrasive properties is possible. Wheels are probably the most convenient abradant because of their low cost, mechanical stability and the fact that a consistent surface can be maintained by simple refacing.
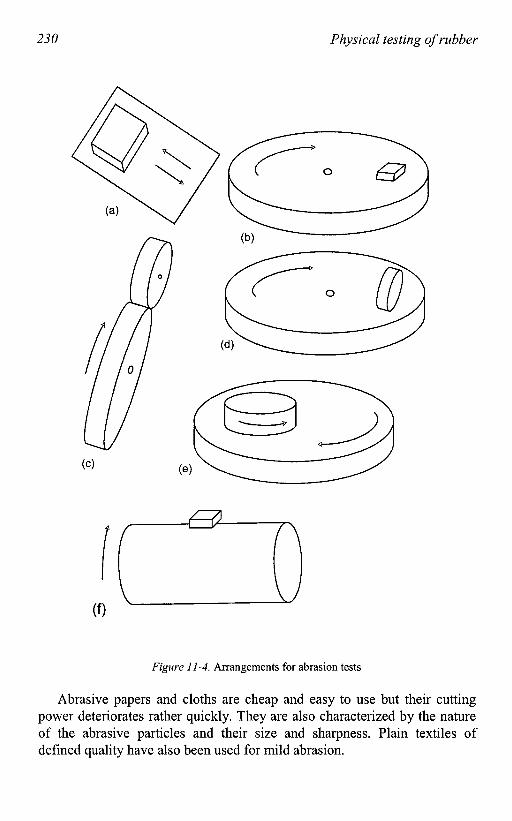
230 Physical testing of rubber
S}-
Figure 11-4. Arrangements for abrasion tests
Abrasive papers and cloths are cheap and easy to use but their cutting power deteriorates rather quickly. They are also characterized by the nature of the abrasive particles and their size and sharpness. Plain textiles of defined quality have also been used for mild abrasion.

Friction and wear 231
Loose abradants are usually particles of the same types of material that are used to form abrasive wheels or paper, and are characterized in the same way.
Metal "knives" can have various geometries, including a mesh and a raised pattern on a wheel. The important characteristic is the sharpness of the edges in contact with the rubber test piece, and this can be difficult to accurately maintain. Plane smooth surfaces are usually metal and are characterized by the material and the surface roughness.
The choice of abradant should be made primarily to give the best correlation with service, and the usual abrasive wheels and papers really only relate to situations where cutting abrasion predominates. Materials such as textiles and smooth metal plates may be more appropriate for other applications. In practice, the abradant is often chosen largely for reasons of convenience and surfaces such as plain steel have the disadvantage of abrading slowly and, if the conditions are accelerated, give rise to excessive heat build-up. Consequently, abrasive wheels and papers are used in situations where they are inappropriate for assessment of service performance.
2,4 Test conditions
Abrasion occurs when the rubber slips relative to the abradant and the amount of slip is a critical factor in determining the rate of wear. In type (a) of Figure 11.4 the slip is 100% because the rate of slipping is equal to the rate of movement of the test piece (or abradant). In contrast, with the type (c) arrangement a range of levels can be used by varying the skew angle between the two wheels, or in type (d) by varying the distance of the wheel from the centre line of the test piece. Typically, the rate of abrasion with a type (c) apparatus is proportional to something between the square and cube of the slip angle.
An important difference between apparatus of type (a), (b), (e) or (f) and (c) or (d) is that in the former case the test piece is continuously and totally in contact with the abradant and there is no chance for the very considerable heat generated at the contact surface to be dissipated. The actual rate of slip will influence the rate of wear because, as the speed is increased, heat buildup will rise. Temperature rise during test is one of the important factors in obtaining correlation between laboratory and service.
The contact pressure between the test piece and abradant is another critical factor in determining wear rate. Under some conditions, wear rate is more or less proportional to pressure but, if with changing pressure the abrasion mechanism changes, perhaps because of a large rise in temperature.

232 Physical testing of rubber
then the wear rate may change quite drastically. Again, this is a critical factor in obtaining correlation with service.
Rather than consider contact pressure and degree of slip separately, it has been proposed^^ that the power consumed in dragging the rubber over the abradant should be used as a measure of the severity of an abrasion test. The power used will depend on the friction between the surfaces and will determine the rate of heat build-up.
Although temperature has a large effect on wear rate, it is extremely difficult to control the temperature during test, but it is clearly the temperature of the contacting surfaces which is of importance rather than the ambient temperature.
The rate of wear will quite naturally be affected by any change in the nature of the contacting surfaces. Apart from the abradant changing because of its own wear, there can be effects from lubricants, wear debris between the surfaces and clogging of the abradant. Not many commonly used apparatus are suitable for testing in the presence of a liquid lubricant, but it is common practice to remove wear debris by continuously brushing the test piece or by the use of air jets, in which case care must be taken to ensure that the air supply is not contaminated with oil or water from the compressor. Clogging or smearing of the abradant is a common problem with abrasive wheels and papers and its occurrence will invalidate the test. It is normally caused by a high temperature at the contact surfaces and, although the problem can sometimes be reduced by introducing a powder between the surfaces, it should be treated as an indication that the test conditions are not suitable. If high temperatures are to be realised in service, a test method in which new abradant is continually used should be chosen. It may be noted that a practical example of a powder influencing abrasion is a car tyre running on a dusty surface. If the abrasion is unidirectional, abrasion patterns will develop which can markedly affect abrasion loss.
It should again be emphasised that, if correlation between laboratory tests and service is to be obtained, the test conditions must be chosen extremely carefully to match those found in the product application.
2.5 Expression of results and standard rubbers
In standard abrasion tests, it is usually weight loss which is the parameter measured, although in certain cases the change in test piece thickness is more convenient. Because it is the amount of material lost which matters, it is usual to convert the weight loss to volume loss by dividing by the density. The volume loss can be expressed as the loss per unit distance travelled over the abradant, per 1000 revolutions of the apparatus, or whatever. A less usual practice is to express the result as loss per unit energy consumed in

Friction and wear 233
causing abrasion which is sometimes referred to as abradability and can be linked to the sHding speed through the Wilhams Landel Ferry (WLF) relation. The volume loss may also be calculated per unit surface area to give a specific wear rate.
Whatever the loss is related to, it must be remembered that the rate of wear may not be constant because of inhomogeneity of the test piece and gradual change in the nature of the abradant. The experiment should be designed to minimise the latter effect by using standard rubbers, refacing the abradant and running repeat test pieces of a series of materials in reverse order. To investigate test piece or abrasive effects, wear rate can be plotted against number of cycles or the distance travelled.
Largely because of the critical dependence of the wear rate on the test conditions, and particularly because of the difficulty in maintaining a precisely reproducible abradant, it is common practice to refer all abrasion results to the results obtained at the same time on a 'standard' rubber. This is an eminently sensible practice as it goes a long way towards eliminating variability due to differences between nominally identical machines and abradants. There is only one drawback, the difficulty of producing an accurately reproducible standard rubber. This produces something of a chicken and egg situation where it is difficult to decide whether it is the abradant or the rubber which has changed.
There does not appear to be evidence to demonstrate the variability of either abrasion standards or abradants but within one laboratory the coefficient of variation of abrasion results using different batches of a standard rubber would probably be not much less than 8%, and the between laboratory variation could clearly be very much greater. Some abradants will certainly be more variable than this but other materials can be reproduced with better precision. Although it is a fact that standard rubbers are themselves variable, they are of very considerable value, particularly when reference is made only to standards from one batch and where they are used to monitor the change with time of one sample of abradant or to compare a number of abradants.
Standard rubbers are given in several of the test method standards. Some are purely for normalizing the abrasive and have no particular service relevance. Others, such as those based on a tyre tread compound or a shoe sole type material, have the advantage of a practical significance as well as a normalizing role. There is no reason at all why, for a particular investigation, an in-house standard representative of the type of material being evaluated should not be used.
Devotees of the use of standard rubbers then finally express the result as an abrasion resistance index defined by:

234 Physical testing of rubber
V Abrasion resistance index = ^ x 100%
where Vs = volume loss of standard rubber and Vr = volume loss of rubber under test.
Abrasion resistance is the reciprocal of volume loss. If the volume loss or abrasion resistance only is quoted, it is desirable to have some certification of the abradant used. This is naturally supplied to some extent by specifying a particular grade and source of supply but leaves open to question the variability of that source of supply. Some workers prefer to use a standard rubber to test the abradant and to calculate a relative volume loss:
V xV. Relative volume loss = -^
where Vr = volume loss of rubber under test, Vd = the defined volume loss of the standard rubber and Vs = the measured volume loss of the standard rubber.
Whichever approach you take, the result is still dependent on the variability of the standard rubber and, arguably, it could be better to rely on the reproducible manufacture of, for example, an abrasive wheel. It would not seem beyond the bounds of ingenuity to find a standard material which is inherently more reproducible than rubber! It could then be used either to certify the abradant or to use in the calculation of abrasion index.
If abrasion loss is measured as a function of test parameters such as speed, temperature, degree of slip, contact pressure etc, it may be possible to combine the results in some way to produce a composite measure of abrasion resistance. Obtaining data as a function of test parameters is impossible, or at least very tedious, with most apparatus, but can be achieved automatically with the LAT system (see Section 2.6).
2.6 Test apparatus
There is an International standard for abrasion in the form of a guide^ . This covers wear mechanisms, types of abrasion test, test conditions, procedures and expression of results, as discussed above, as well as giving summaries of thirteen particular abrasion apparatus. The content of the guidance document was in fact developed from an earlier version of this chapter.
For many years, the only abrasion test method standardized internationally was the apparatus commonly known as the DIN abrader

Friction and wear 235
because the test was based on the German method. This was standardized because of its very widespread use for quahty control but the standardization of other methods was resisted to avoid a potential proliferation of methods. One objective of having the guidance standard was to allow various instruments to be referenced in an international standard but to avoid multiple standards. As will be seen below, this attempt to restrict the number of standards seems to have failed.
The DIN method is given in ISO 4649 " . The principle of the machine is illustrated in Figure 11.5; a disc test piece in a suitable holder is traversed across a rotating drum covered with a sheet of the abradant, which is why it is also called the rotary drum abrader. In this way, there is a relatively large area of abradant, each part of which is passed over in turn by the test piece, so that wear of the abradant is uniform and relatively slow. In the standard method there is no provision for changing conditions from those specified, other than a lower force for soft rubbers, but it would be possible to use other abradant cloths or papers and to vary the force on the test piece. The degree of slip is 100% and it would be inconvenient to test in the presence of a lubricant. Although not versatile, the method is very convenient and rapid and well suited to quality control.
ABRADANT
TEST PIECE
Figure 11-5. Principle of DIN abrader
The details of procedure and expression of results are something of a compromise, being a compilation of the German approach and the British approach. Two procedures are specified, using a rotating or non-rotating test piece respectively. In principle, the abrasion should be more uniform if the test piece is rotated during test. The standard abradant is specified in terms

236 Physical testing of rubber
of weight loss of a standard rubber using a non-rotating test piece and has to be run in against a steel test piece before use.
Results can either be expressed as a relative volume loss with the abradant normalized relative to a standard rubber or as an abrasion index relative to a standard rubber. The former is the original German approach and the latter is that approach favoured by, for example, British standards. Two standard rubbers are specified which originate from the German and British standards. This is a fine example of the chicken and egg problem of standard rubber and abradant. To understand the situation it must be appreciated that an accurately specified standard abradant has been available in Germany for many years, but the rubber used to check it has a formulation of no relevance to real products and is very difficult to reproduce in laboratories other than that of its origin. The British standard rubber is based on a tire tread and, hence, has practical relevance.
Either way of expressing results can be used with either rotating or non-rotating test pieces but, normally, only the German standard rubber would be used with relative volume loss. In previous versions, only the abrasion index approach had the option of using a rotating test piece.
There is an identical British standard numbered as BS ISO 4649 which has partially superceded BS 903 Part A9 to update the DIN method. This leaves BS 903 A9 ^ with procedures for the DuPont, Akron and Taber apparatus.
The DuPont apparatus uses a disc of abrasive paper which rotates whilst a pair of moulded test pieces are continuously pressed against it (type (b) of Figure 11.4) either with a constant force or with a force adjusted to give a constant torque on the arm holding the test pieces. It is a relatively simple apparatus using an easily replaced abradant but has several disadvantages. The abrasive paper is prone to smearing with soft materials due to heat build-up, few parameters can be varied and the irregular-shaped test piece has to be specially prepared.
The Akron machine is of the form (c) in Figure 11.4. The test piece is a moulded wheel driven at constant speed and held against the abrasive wheel by a constant force. Its main advantage is that by varying the angle of the test piece relative to the wheel the degree of slip can be varied and, hence, its effect studied. Any point on the test piece is not continuously in contact with the abradant so that heat build-up is less troublesome than with the DuPont. It is not particularly convenient to change the abradant and the test piece must be specially prepared. The standard allows for the addition of a loose powder between the test piece and the wheel to prevent clogging of the wheel with soft rubbers.
For both the DuPont and Akron procedures, the standard specifies a trial run to establish the level of abrasion rate and a running in period before the

Friction and wear 23 7
actual test runs. The running in period is to bed in the test piece and abradant, and for the DuPont also serves to condition a new piece of abrasive paper.
The 'rotary-platform, double-head' or Taber abrader, unlike those mentioned above, was not developed by the rubber industry but was intended for very general use. It is of the form (d) in Figure 11.4 but uses a pair of abrasive wheels. Although the degree of slip cannot be varied, the Taber is in other ways a very versatile apparatus. It uses a simple flat disc as the test piece which could, if necessary, be fabricated from more than one piece. The force on the test piece and the nature of the abradant are very readily varied and tests can be carried out in the presence of liquid or powder lubricants. When using the usual type of abrasive wheel, a refacing procedure is carried out before each material tested.
Four standard rubbers are specified, two of which are the same as those given in ISO 4649. The other two are a high abrasion resistant SBR compound and a low abrasion resistant material which may be preferred for comparison with high and low abrasion resistant test materials respectively. For all three methods, the calculation of abrasion resistance index is specified.
ASTM has the DIN abrader specified as D5963^ . It has the rotating and non-rotating methods and both standard rubbers but does not cater for the lower force for soft rubbers. The details are said to be equivalent to the 1985 version of ISO 4649 and there is no indication of why it has not been updated.
The Pico abrader is specified in D2228^ . This device uses a pair of tungsten carbide knives which rub the test piece whilst it rotates on a turntable. The direction of rotation is reversed at intervals throughout a test and a dusting powder is fed to the test piece surface, which doubtless helps to avoid stickiness. The apparatus is calibrated by the use of no less than five standard rubbers and the result also expressed as an abrasion index. Force on the test piece and speed of rotation can be varied and, presumably, different abradant geometries could be used, although the distinctive feature of the Pico is the use of blunt metal knives in the presence of a powder.
In addition, the rotary-platform, double-head abrader is specified for coated fabrics^^ and the NBS abrader for shoe soles and heels^ . The NBS abrader uses rotating drums with abrasive paper wrapped around them onto which the test pieces are pressed by means of levers and weights, but there is no provision for traversing the test piece across the abradant as in the DIN machine.
No attempt will be made to give a comprehensive survey of abrasion testers as so many designs have been tried and even some of the standardised types of apparatus are not very commonly used. A review was given by

238 Physical testing of rubber
Buist in 1950^" but many machines have appeared since them. Twenty one methods are listed in a study of wear of flooring materials^^ and several machines developed in the USSR are described in Section 3 of reference 44.
The Lamboume abrader is essentially the Dunlop apparatus which used to be specified in BS 903, and which uses a wheel test piece with the degree of slip being controlled by an eddy current brake. An improved Lambourne machine is now being proposed for standardization in ISO TC 45. This instrument has both the test piece and the abradant in the form of wheels (type (c) of Figure 11.4) but both are driven at different speeds to give slip.
The Conti is used as another name for the DIN apparatus, although Buist ^ gives it as a separate machine, and the Grasselli is the same as the DuPont.
The Martindale abrader is usually seen as a four station machine which uses cloth as the abradant, but coarser and faster acting materials can be substituted. The principal feature of this machine is that the test pieces are rubbed successively in different directions as the motion takes the form of a Lissajous figure. It is mostly used with coated fabrics^ .
The Schiefer abrader, which is also known in Britain as the WIRA carpet abrader, is of the form (e) in Figure 11.4. Its principal feature is that it produces a constant relative speed between the test piece and abradant at all points on the test piece, whilst the direction of relative motion changes steadily around a full circle. It is a versatile machine in that a variety of test piece holders can be fitted and the abradant is readily changed, including the use of serrated metal surfaces. It is used for testing polymeric artificial sports surfaces.
The Frick-Taber^^ test is a modified Taber, in which loose abradant is introduced between wheel and test piece, used particularly in the evaluation of flooring materials. It is specified in EN 660-2 " .
The Laboratory Abrasion Tester 100 (LAT 100) ^ uses a wheel test piece on an abrasive disk geometry so is the type (d) of Figure 11.4. The abrasive disk is driven and the speed, contact force and the slip angle of the test piece can all be varied. What makes this apparatus so different from all the others is not only the versatility but the sophistication of the instrumentation and the computer control. This means that it can be used to obtain data as a function of several parameters and combine results to make predictions of wear for the extremely complicated service conditions of tyres. Not surprisingly, it is very expensive and unlikely to be used on a routine basis outside of tyre companies. Nevertheless, is has now been proposed for standardization in ISO TC 45.
A further attempt to better simulate the wear conditions for tyres resulted in the FKK wear tester^ . An abrasive belt is run over two drums and it is claimed that the same friction conditions as service are achieved. The test

Friction and wear 239
runs under constant braking force and the temperature is controlled by cooling fluid in the drums.
Nah et al ^ developed a modified form of blade abrader which is similar in concept to the Pico abrader but covers a larger area to give better sensitivity. The development included an arrangement to give constant frictional torque and the movement of the knife is suggested as an alternative to weight loss for measuring abrasion.
A number of tests have been developed with particular products in mind. The use of loose abradant to impinge on the rubber^ ' ^ is particularly suited to surface coatings and a reciprocating test specifically for coatings has also been described^^ Loose particle tests and tests to simulate wear by slurries have application for pipes and conveyors ' " and there is an ASTM publication on wear by slurries^^ The NBS test ^ is specifically for sole and heel materials and there are a number of other tests used in the footwear industry. A good example of a specialised approach is a machine for 0-rings^^ where the abradant is a roughened metal disc which is immersed, with the 0-ring, in an abrasive fluid such as drilling mud.
Abrasion of rubber by loose abradant is clearly a different situation to that where solid abradants are involved. The mechanisms of wear under those conditions have been investigated for several materials^ ' .
Although it is not really a different method, it should be noted that to obtain correlation with service conditions where wear rate is low, very tiny quantities of material lost have to be measured. These small losses may be difficult to measure by the usual weighing or dimensional methods and radioisotope techniques have been used, as for example in the method of Patel and Deviney' . Conceivably, a method for measuring very low levels of wear on a tyre by the change in reflectance of an applied paint ^ could be used in laboratory tests.
The temperature during test is often not known. A comprehensive investigation of the temperature for the test wheel in a modified Lambourne abrader has been made by Ramakrishnan et al ^ using an infrared camera. The predicted rise for thermoplastics in a pin on disk system has been compared with measurements^^ and, presumably, the calculation could be applied to other circumstances.
2.7 Comparison of Methods
It is to some extent pointless to compare abrasion testers except in the context of their correlation with a particular product and service condition. If a general comparison is attempted, this will inevitably be subjective. However, it can be commented that the DIN abrader has become increasingly popular and is very convenient for routine control use. The

240 Physical testing of rubber
Akron and the improved Lamboume are distinctive for the abihty to vary shp angle in a simple manner and the Schiefer for giving uniform multidirectional abrasion. Probably the most versatile commonly used apparatus is the Taber because of the very wide range of abradants readily available and its ability to operate with lubricants. The LAT 100 is in a class of its own as regards sophistication and features.
All of the abraders developed for rubber testing, the Akron, DuPont, Dunlop etc, were primarily aimed at testing tyre compounds. Noboru Tokita at al ^ have discussed tyre wear testing and point out that it is virtually impossible to simulate the total wear pattern and to determine tread life from laboratory abrasion testers, but many people have tried. The LAT 100 approach using multi conditions would seem to stand the best chance.
Published accounts of studies of correlation of laboratory abrasion tests with service are not abundant. The study of wear of flooring materials^^ previously mentioned is comprehensive and the same subject has been considered by Gavan " . Three abrasion machines were used by Satake et al ^ to study the correlation with tyre wear, and an example of tests using the constant power principle versus tyre wear is given by Powell and Gough^ . Discussion of correlation with tyre wear and of abrasion with other physical properties is contained in Buist's paper^ . Krishnan et al ^ investigated the relationship between laboratory test conditions and road wear results and found that ranking of compounds changed between blunt and sharp grinding wheels.
Moakes^^ studied several machines in relation to wear trials on footwear compounds, and work at SATRA and CST^ used PVC and microcellular materials as well as rubber. Borrof*^ investigated the validity of the NBS test for footwear and Dickerson^^ briefly discusses the conclusions gained from extensive comparative tests on solings and bottoming materials at SATRA. (The results are given in SATRA Internal Reports). Magomedov^^ devised a method to relate abrasion resistance with other properties of soling materials and established a relationship between abrasion resistance measured on a Poznac instrument and sole wear resistance.
The reliability of the Taber abrader has been studied by Hill and Nick^^ and its use with polymers discussed by Brown and Crofts^ . The DIN machine has been compared with the Akron and Taber method " for general use with rubbers. Several papers in an ASTM publication' ^ consider the performance of various tests to assess coatings, and the use of a metal mesh abradant to assess the wear of conveyor belts is given by Polunin and Gulenko^^

Friction and wear 241
REFERENCES
1. James D I. RAPRA Members Journal, July 1973, pi70.
2. Ohhara R. Int. Polym. Sci., 23, 6, 1996, pT25. 3. Nakajima Y, Takahashi F. Int. Polym. Sci., 30, 2, 2003, pT36. 4. James D I. J. Sci. Instrum., 38, 294, July 1961. 5. Griffin G J L. Wear, 17, 399, 1971. 6. Mustafa M R and Udrea C. Plast. Mod. Blast., 21,10, 1969, pi 14. 7. Bailey M W and Cameron A. Wear, 21, 1,43, 1971. 8. West G H and Senior J M. Wear, 19, 1.37, 1972. 9. Jost H. Plaste u Kaut, 16, 3, 175, 1969. 10. Wilson A and Mahoney P. Rubb. World, 165,6, 36,1972. 11. Benabdallah S M H. Polym. Test., 9, 3, 1990, pl95. 12. Bielinski D, Janczak K, Janczak T and Slusarski L. Polim. Tworz. Wielk., 36, 10, 1991
p380. 13. Roberts A D, Alliston-Greiner A F. ACS Rubber Division Meeting, Denver, 18-21'* May
1993, paper 61. 14. Bandel P, Di Bernardo C. ACS Rubber Div, Toronto, 1991, Paper 70. 15. James D I and Newell W G. Polym. Test. 1, No. 1, 1980. 16. James D I and Mohsen R. Polym. Test, 3, No. 2, 1982. 17. Giles C G, Sabey B E and Cardew K H F. Road Research Technical Paper No. 66,
HMSO, 1964. 18. Malkin F and Harrison R. J. of Physics D, 13, L77-79, 1980. 19. Brown R P. Polym. Test., 7,4, 1987, p279. 20. Wilson M and George M. Satra Bulletin, 1988 21. Wilson M. J. Test. Eval., 24, 6, 1996, p377. 22. James D I. Polym. Test., 18, 1, 1999, p3. 23. James D I. Rubb. Chem. Technol. 153, No. 3, 1980. 24. James D I. Ergonomics, 26, 1, 1983, p83. 25. Marpet M. J. Test. Eval., 24, 4, 1996, p245. 26. Marpet M I, Fleischer D H J. Test. Eval., 25, 1, 1997, pi 15. 27. Slipping-Towards Safer Flooring, Proceedings of a seminar, Shawbury, 29* Sept. 1994,
Rapra Technology Ltd., Shawbury, UK. 28. Rowland F J, James D I, Hughes R C. Polymer Testing '95, 15-16* June 1995, Shawbury,
Paper 17. 29. Hughes R C, James D I. Polym. Test., 21,1, 2002, p39. 30. Mitsuhashi K. Int. Polym. Sci. Technol, 16,2, 1989, pT31. 31. Sviridyonok A I, Kirpichenko Y E. ACS meeting St. Louis, 1984, Proceedings, p333. 32. Robinson W H and Kopf R E. Mater. Res. Stand., 9, 7, 1969, p22. 33. James D I. Polym. Test., 5, 6, 1985, p403. 34. Kulakowski B T, Buczek F L, Cavanagh P R, Pradhan P J. Test. Eval., 17,4, 1989, p234. 35. Wada N, Inoue A, Kurita Y, Nakajima M, Nojima Y, Okubo K, Kawasaki I, Jonen H,
Sugari M, Uchiyama Y. Int. Polym. Sci. The., 24, 3, 1997, pT51. 36. Wada N. Int. Polym. Sci. Tech., 25,2, 1998, pT52. 37. ISO 15113,1999. Determination of frictional properties. 38. BS 903 Part A61, 2000. Determination of frictional properties. 39. BS 3424 Part 10,1987. Determination of surface drag. 40. BS EN ISO 8295, 2004. Plastics film and sheeting - Determination of coefficients of
friction. 41. James DL Polym. Test, 8, 1, 1989, p9.

242 Physical testing of rubber
42. James D I. Chem & Ind., No. 3, 1987, p89. 43. Lancaster J K. Plastics and Polymers, Dec. 1973. 44. James D I (Ed.). Abrasion of Rubber, Maclaren and Sons, 1967. 45. Gent A N and Pulford C T R. J. Appl. Polym. Sci. 28, No. 3,1983. 46. Schallamach A. Int. Polym. Sci. & Technol. 6, 1, 1978, pT44. 47. Shallamach A. Int. Polym. Sci. & Technol, 6, 1, 1978, pT63. 48. Shallamach A. Progress in Rubber Technology, Elsevier, 1984. 49. Thavamani P, Bhowmick A K. Rubb. Chem. Technol.,67, 1, 1994, pi29. 50. Ahagon A. Int. Polym. Sci. Technol., 23, 6, 1996, pT32. 51. Lancaster J K. Wear, 14, 223, 1969. 52. Powell E F and Gough S W. Proc. 3rd Rubb. Tech. Conf., Cambridge, 1954, p.460. 53. ISO 23794,2003. Abrasion testing - Guidance. 54. ISO 4646, 2002. Determination of abrasion resistance using a rotating cylindrical drum
device. 55. BS 903:Part A9, 1988. Determination of abrasion resistance. 56. ASTM D5963, 1997 (2001). Abrasion resistance (Rotary drum abrader) 57. ASTM D2228,2002. Relative abrasion resistance by the Pico abrader method. 58. ASTM D3389, 1994. Coated fabrics - Abrasion resistance (Rotary platform, double head
abrader). 59. ASTM D1630, 1994 (2000). Abrasion resistance (Footwear abrader). 60. Buist J M. Trans. IRI, 26, 192, 1950. 61. Frick O F V. Wear, 14, 2, 1969, pi 19. 62. ISO 5470-2 Rubber or plastics coated fabrics - Determination of abrasion resistance -
Martindal abrader. 63. Bradway D, Irvin W E J. Test Eval., 17, 2, 1989, p82. 64. EN 660-2 Resilient floor coverings - Determination of wear resistance - Frick-Taber test. 65. Grosch K A. TyreTech conference, 1998, Paper 14. 66. Koike A, Kobayashi I, Furuta I, Yamazaki S. Int. Polym. Sci. Technol, 29, 5, 2002, pT27. 67. Nah C, Cho J, Kaang S. Polym. Test., 17, 1, 1998, pi 1. 68. Tilly G P. Wear, 14, 223, 1969. 69. Egorov B N, Poganov E V and Lyashevich V V. Plast. Massy., 10, 65, 1971. 70. Lancaster J K. ASTM Special Publication 769, 1981. 71. Abu-Isa I, Jaynes C B, School R. Rubb. Plast. News, 16,4, 1986, p30. 72. Arnold J C, Hutchins IM. J. Nat. Rubb. Research, 6,4, 1991, p241. 73. Lowe D, Marshall G P. Plastics Pipes, York, Proceedings, 1985, p8. 74. Kommann M, Genet M, Anderson E. Internal & External Protection of Pipes, Nice,
Proceedings, 1985, pi 79. 75. ASTM Special Publication STP 946, 1987. 76. Burr B H and Marshek K M. Wear, 68, No. 1, 1981. 77. Zhang S W, WangD, Yin W. J. Mat. Sci., 30, 18, 1995,p4561. 78. Kopchenkov V G. Int. Polym. Sci Technol, 31, 3, 2004, pT24. 79. Patel A C and Deviney M L., Rubber Division of the American Chemical Society
Meeting, Detroit, May, 1973, p787. 80. Chung S R, Lee K S, Yu H J. Tire. Sci. Technol, 26,2,1998, pl20. 81. Ramakrishnan R, Kliman J, Donovan J A. ACS Rubber Division Meeting, Philadelphia,
2-5* May 1995, Paper 43. 82. Kar M A. Wear, 67, 1981, p71 83. Tokita N, Shieh C-H, Ouyang G B, Patterson W J. Current Developments In Product
Manufacture and Applications, Kuala Lumpur, Proc, 1993, p37. 84. Gavan F M. Mater. Res. Stand., 10, 7,24, 1970.

Friction and wear 243
85. Satake K, Sone T, Hatnada, M and Hayakawa K. J. IRI, 4, 5, 1970, p217. 86. Krishnan V, Ramakrishnan R, Donovan J A. ACS Rubber Division Meeting,
Philadelphia, 2-5* May 1995, Paper 44. 87. Moakes R C W. J. IRI, 5,4, 1971, pl55. 88. Maddams J S. SATRA Bulletin, Dec. 1971. 89. Borroff J D. Elastomerics, 109, No. 12, 1977. 90. Dickenson K. SATRA Bulletin, May 1984. 91. Magomedov S S. Int. Polym. Sci. Technol., 30, 10,2003, pT29. 92. Hill H E and Nick D P J. Paint Tech., 31,494, 1966, pi23. 93. Brown R P and Crofts D. RAPRA Bulletin, Aug. 1971. 94. Brown R P. RAPRA Members Report No. 17, 1978. 95. Polunin V T and Gulenko G N. Kauch. I. Rezina, 31,7, 1972, p37.

Chapter 12
FATIGUE
Fatigue could be defined as any change in the properties of a material caused by prolonged action of stress or strain, but this general definition would then include creep and stress relaxation. Here, fatigue will be taken to cover only changes resulting from repeated cyclic deformation which means, in effect, long term dynamic testing.
Subjecting a rubber to repeated deformation cycles results in a change in stiffness and a loss of mechanical strength. In some products, even a relatively small change in stiffness can be important, but this measure of fatigue is relatively little used, certainly not in standard tests. It would be relatively straightforward, although perhaps expensive in machine time, to continue a dynamic test as discussed in Chapter 9 over a very long period and monitor the change in modulus. Alternatively, modulus could be measured at intervals after djmamic cycling on a separate apparatus. In many products, notably tyres, it is the loss in strength shown by cracking and/or complete rupture which is considered to be the important aspect of fatigue and this is the measure of fatigue which is normally used in laboratory tests on rubbers.
The manner of breakdown will vary according to the geometry of the component, the type of stressing and the environmental conditions. The mechanisms which may contribute to the breakdown include thermal degradation, oxidation and attack by ozone, as well as the basic propagation of cracks by tearing. In rubber testing, it is normal to distinguish between two types of fatigue test; tests in which the aim is to induce and/or propagate cracks without subjecting the test piece to large increases in temperature, and tests in which the prime aim is to cause heating of the specimen by the stressing process. The former type is generally referred to as flex-cracking or cut-growth tests and the latter as heat build-up. This division leaves out

246 Physical testing of rubber
specialised tests for particular products which may have characteristics of both types. For example, tyres fail by fatigue in which heat build-up is important and also suffer from groove and sidewall cracking, so that, logically, a realistic test would simulate both.
1. FLEX-CRACKING AND CUT GROWTH TESTS
The vast majority of flex-cracking tests strain the test piece in flexure, representing the mode of deformation experienced in service by such important products as tyres, belting and footwear. Unfortunately, despite the obvious logic of this approach, there are disadvantages. The principal problem is that it is difficult to control the degree of bending, which may, for example, vary with the modulus of the rubber and, because the fatigue life of rubber will be sensitive to the magnitude of the applied strain, misleading results may be obtained. The more nearly the deformation produced in the laboratory test reproduces that experienced in service the better should be the hope of correlation. It is hardly necessary to add that most products are subjected to a most complex pattern of straining. The alternative approach is to use a simple but reproducible mode of deformation such as pure tension.
1.1 Flexing methods
A variety of flex tests have been used, many intended for particular products such as belting, footwear and coated fabrics, but a number of them, although once well known, are not now in such common use. A useful review was given by Buist and Williams in 1951
Four types of machine in which bending is produced in different ways are shown schematically in Figure 12.1. The most widely known and standardised apparatus, the De Mattia, has the action shown in Figure 12.1(a). The test piece, which is a strip with a transverse groove, is fixed in two clamps which move towards each other to bend the strip into a loop. The maximum surface strain at the critical point X is somewhat indeterminate. In the 'flipper' or Torrens machine (Figure 12.1(b)), the strip test piece, fixed in a slot in the periphery of a rotating wheel, is bent against a fixed, but freely rotatable, roller. Again, the radius of curvature, and hence the maximum surface strain, is not precisely controlled. In the Du Pont machine (Figure 12.1(c)), the test pieces are connected together to form an endless belt and run over a series of pulleys of specified diameters. Although the overall radius of bending is controlled, the surface strain in the test piece is complicated by it having several transverse 'V grooves. The Ross machine (Figure 12.1(d)) bends the test piece through 90" over a rod and the

Fatigue 247
maximum surface strain is rather more controlled than in the other machines described.
The control of minimum strain is even more important than the control of maximum strain in a flexing cycle because rate of cracking is much increased if this is zero. In all the methods described above, the strain is deliberately intended to be zero, but probably only in the Ross apparatus is this achieved precisely and in a reproducible manner. In all bending methods, the maximum strain depends on the thickness of the test piece and, hence, this must be closely controlled.
u (d)
L -
Figure 12-1. Types of flexing test, (a) De Mattia; (b) "flipper" machine; (c) Du Pont; (d) Ross. In (a), (b) and (d) the flexed form is shown by broken Hnes.
There is now one international standard for flex testing, ISO 132^ which covers both tests for crack initiation and for cut growth. Previously, these were separated into two standards. The different significance of the two

248 Physical testing of rubber
types of test is illustrated by the fact that natural rubber fairly quickly develops fine cracks in a flex-cracking test but is relatively resistant to the further growth of these cracks or of a purposely made cut, whereas SBR shows just the opposite behaviour. For both methods, the standard specifies the De Mattia apparatus and the same test conditions, the essential difference being that for cut growth tests a cut is made through the bottom of the groove in the test piece before flexing is started.
The De Mattia apparatus operates at 5 Hz with a maximum separation of 75 mm between the grips and a travel of 57 mm (i.e. between 75 and 18 mm). The test piece is a strip with a moulded groove which is intended to concentrate stress, and hence cracking, in the centre of the strip. The test pieces are inserted into the grips at maximum separation to give zero strain.
In flex-cracking tests, one of the most difficult problems is how to assess the degree of cracking. Visual examination is the only really feasible procedure and, inevitably, the assessment is subjective and operator dependent. Unfortunately, the pattern of cracking in a De Mattia test varies with the type of rubber and is likely to start at the edges of the test piece, although this can be virtually eliminated by radiusing the edges. Alternative grading systems were discussed by Boss and Greensmith^ and the 'modified code' they suggested is now essentially the procedure specified in ISO 132. It is based primarily on the length of the largest crack present at any stage and the depth of the crack is ignored. Any more complicated process involving the measurement of length, depth and number of cracks is generally unacceptable and, in any case, any precision gained is usually masked by between test piece variability. Judging against a standard set of photographs is only of any use if the rubber under test follows the same pattern as that illustrated. Judging on the time to the first appearance of cracks gives only a single point measurement and is liable to be more variable than taking a series of grades of increasing severity.
In the cut-growth method, a 2 mm cut is made through the rubber, and the geometry of the chisel-like piercing tool is given in detail. The length of the cut is measured at intervals and the number of cycles for it to increase by 2 mm, 6 mm and 10 mm is deduced.
The British Standard is identical and numbered as BS ISO 132. ASTM has several flexing fatigue methods and it can be seen from the lack of uniformity in the titles that they were not developed as a group.
ASTM D430' specifies three machines for flex-cracking. The Scott Flexer is included specifically to test for ply separation of composites such as belting or tyres and is not used for rubber alone. It is a somewhat bulky apparatus in which the test pieces are reciprocated over a rotatable hub whilst held in tension. The arc of contact is about 165^ but was at one time was erroneously given as 135 , resulting in at least one out of spec machine

Fatigue 249
in the UK. Different diameter hubs are used for belts and tyres, 31.7 and 14.3 mm respectively.
The De Mattia method is not exactly the same as the ISO and BS methods. The distance between the grips reciprocates between 19 and 75.9 mm, whilst the test piece length between the grips is 76.2 mm. Hence, zero strain is not quite reached. In addition to using the machine to repeatedly bend the test piece, a procedure is given in which a dumb-bell is cycled in pure tension. In both cases, the degree of cracking is judged by visual observation and graded on a scale of 0 - 10, where 0 represents no cracks and 10 is essentially complete failure. The use of the direct tension mode of straining will be considered in Section 1.2.
The third machine specified is the Du Pont Flexer, as briefly described above. The belt is made up of 21 test piece links which run over an arrangement of four pulleys under a tension of about 76N..
ASTM D813^ specifies the De Mattia apparatus for cut-growth measurements and suggests that it should be used for materials which do not readily initiate cracks when tested by the methods given in ASTM D430. The fact that some materials are difficult to initially crack but will readily propagate tears is obviously of great practical importance, but it is very debatable whether the two forms of test should be considered on an either/or basis. The procedure and expression of results are not identical with ISO 133. Also, rather oddly, the free length is 75.9 mm and, hence, differs from ASTM D430 for flex cracking.
A second method for cut growth using the Ross Flexer is given in ASTM D1052^ but there appears to be no cross reference between this and D813. As discussed above, the Ross has the particular advantage of controlling the maximum and minimum strains rather more precisely than in other bending tests. Because of this, it is a little surprising that the method is not more widely used. In Britain, the Ross has been used to test soling materials for footwear. To prevent heat build-up in the test piece, the apparatus operated at a slower speed than in the ASTM standard and common practice was to test at 0°C or -5^C.
ASTM has also standardised a 'flipper' type of machine^ which uses grooved and pierced test pieces to measure crack growth. The gap between the revolving disk and the deflector bars can be varied so that the angle of deflection and, hence, the severity of test can be varied. The apparatus in contained in an oven so that tests can be made over a range of temperatures.
1.2 Tests in Tension
All of the bending methods are to some extent arbitrary as to the degree of strain used and in most tests neither maximum nor minimum strains are

250 Physical testing of rubber
well defined. By cycling in simple tension, strains can be reproduced more easily and a range of strains and prestrains can be readily realised with one apparatus. A standard procedure for fatigue in tension adopted by ISO arose out of the MRPRA work on the concept of tearing energy (see Chapter 8, Section 9).
In this fracture mechanics approach, the rate of crack growth is a function of the maximum value of tearing energy attained during the fatigue cycle. For a strip with an edge or central cut cycled in tension, a relation between cycles to failure and the initial cut size for the case where that cut is relatively very small can be derived ' :
N = - n-\ {IKWYiC,)
where: N = fatigue life in cycles to failure, G = cut growth constant, K = function of the extension ratio, W = strain energy per unit volume, Co = initial depth of cut (or intrinsic flaw) and n = strain exponent dependent upon the nature of the polymer.
Hence, at a constant value of K, a plot of log (N) against log (W) will have a slope n. The value of n has been found to be about 1.5 for a natural rubber tyre tread and 3 for an SBR tread. If no artificial cut is introduced then Co is the effective size of a naturally occurring flaw. The strain energy density, W, can be found from the area under the stress/strain curve for the test piece and is strain dependent. The fatigue life is independent of the specimen geometry when expressed in these terms. At low strains, the equation does not adequately describe the fatigue behaviour and there is a fatigue limit corresponding to tearing energy, below which there is virtually no cut growth and fatigue life becomes very long (unless ozone cracking occurs).
Test can be made at a number of extensions and compounds can be compared in terms of fatigue life at the same strain or at the same strain energy. In the latter case, absolute comparisons can be made on compounds of different modulus. When comparing different rubbers, it is necessary to test at a number of strains or to define the severity of conditions which will occur in service, because with the number of variables (G, K, W, n and Co) the ranking order may vary with the maximum strain employed.
ISO 6943^^ for fatigue in tension specifies two different types of test pieces, rings and dumb-bells, which correspond to the geometries used on commercially available apparatus. There is, in principle, little difference between the two forms of test piece but dumb-bells are necessary for studying directional effects. They are also easier than rings to cut from sheet, but normally a specially moulded sheet is required such that the dumb-bells

Fatigue 251
have a raised bar across each tab end to aid location and gripping. There are no gripping problems with rings and the roller separation is a direct measure of strain.
The dumb-bells specified are the same as those for tensile stress/strain tests except the preferred thickness is 1.5 mm. The ring is also the same as the tensile ring, which means that the bulk of the two types of test piece are different.
The range of frequency specified is between 1 and 5 Hz and the standard only covers strain cycles passing through zero, although prestrains could be applied. It is suggested that at least five test pieces should be tested at each strain and that usually it is desirable to test at a number of maximum strains. The strain on ring test pieces is calculated on the internal diameter (see Chapter 8, Section 5.1). The test is continued until complete failure of the test piece occurs and then the number of cycles recorded.
During the course of a test, the stress/strain relationship of the test piece will change and there will also be a degree of set. It is recommended that both these parameters are measured at intervals and the results reported as well as the fatigue life. The results can be presented in graphical form as log (fatigue life) against strain, log (strain energy density) or log (stress). An annex gives explanatory notes, including a section on interpretation of results which introduces the concept of a fatigue limit.
It is generally found that the relationship between 'fatigue life' and applied stress or strain is of the form shown in Figure 12.2. The important feature of this so called S-N or Wohler curve is that, on reducing the stress or strain towards a particular value, the fatigue life increases virtually to infinity, giving rise to the concept of a limiting fatigue life
The British standard^ is identical to the ISO and ASTM D4482^^ is essentially similar but only covers dumbbell test pieces.
Fatigue life is influenced by the environmental conditions under which the test is carried out, in particular temperature, oxygen and ozone. The effects of these have been discussed by Derham et al* and Clapson and Dove " , the latter authors also giving examples of the application of the tensile form of fatigue testing to practical applications.
The publication of the ISO and equivalent standards was expected to encourage more workers to apply the fracture mechanics approach which underlies them to the prediction of fatigue in rubber products, although the standard itself does not in fact go into the fracture mechanics theory. Judging from the very considerable volume of literature that has been generated, there has been success in this direction.
Examples of accounts of applying the fracture mechanics approach to the fatigue behaviour of rubbers are given in references 15-19. In a review of testing methodology for reinforced rubber composites^^ it is concluded that

252 Physical testing of rubber
there can be coexistence of fracture mechanics and the probabihstic approach of S-N curves. Fukahori ^ has demonstrated the generation of an S-N master curve by superimposing data obtained at different crack lengths and has analysed the application of the curves with fracture mechanics.
Fatigue life
ULTIMATE FATIGUE STRENGTH
Stress or strain
Figure 12-2. Relationship between fatigue life and applied stress or strain (S-N or Wohler curve)
The dependence of fatigue life on the maximum strain and, particularly, the minimum, non-zero strain has been demonstrated^^ using rather unusual cylindrical dumb-bells. A technique was developed^^ for estimating the effect of stress relaxation on tearing energy measurements and for adjusting the measured values for relaxation. This work also made tests on test pieces of different widths as being equivalent to increasing crack length.
Eisele et al " describe the so called tear analyzer using a strip test piece with a cut in one edge cycled in tension, which can be considered the classic geometry for obtaining fracture mechanics data on rubbers. This sophisticated instrument introduces nothing new in concept but has a temperature controlled chamber and can operate at different frequencies, pre-strains and strain amplitudes, with automatic compensation for set.

Fatigue 253
Examples of it use are given by Kelbch et al^^ Sumner et al ^ and Boehm andStruve^^'^l Yang and Kang^^ give a relation for estimating the crack length from the variation in peak loads under constant strain displacement cycles. Sun et al ^ investigated the applicability of Miner's rule to rubbers fatigued in tension and determined the effect of loading sequence on crack growth.
1,3 Other tests
The British standard guide to application of rubber testing to finite element analysis^ covers fatigue tests and suggests nine different possible test piece geometries:- edge crack in a tensile strip, central crack in tensile strip, pure shear test piece with either long edge crack or short central crack, angled test piece, trouser test piece, split test piece, simple shear, a twisted disc, peel and rod pull out. The edge crack tensile geometry is most common as the crack is easy to form and growth can be monitored optically (a central crack is more difficult to introduce). The particular characteristics of the other geometries are summarized in the standard.
Muhr and Thomas^^ suggest the angled test piece to eliminate the need to know the strain-energy of the material, whilst Samsuri ^ et al developed a special equipment needed for the split tear test. Fleischman et al " developed a method using a disc in torsion with a circumferential pre-crack to simulate belt edge interlaminar shear. Stevenson^^ considers the use of compression test pieces and the application of the results to offshore platform supports and antivibration mountings. Takeuchi et al ^ describe a test specially developed for vibration insulators which uses a cylindrical dumb-bell shaped test piece with ends bonded to metal. The deformation combines tension and compression.
An investigation of the influence of loading conditions on fatigue hfe ^ involved a test piece with a rigid insert and a cut at the rubber/insert interface. Liu et al ^ established a fatigue testing system to give periodic loading rather than continuous extension cycling and considered the advantages of this approach. The connection between fatigue lives of rubber/fabric materials in uniaxial and biaxial tension was established over a temperature range of up to 140^C at low frequencies^ . Saintier et al" ^ studied asymmetrically notched samples in a uniaxial machine and in torsion, and made comparisons with finite element analysis.
Nechiporenko" ^ used a novel approach of repeated impact testing to obtain fatigue life under circumstances that would be relevant to tyres in quarries. He used a Schob pendulum with automatic delivery and counting of impacts, and needed only tests at two energies with up to 150 blows to give a rapid test.

254 Physical testing of rubber
Explosive decompression in pressurized hose and seals can result in damage only after several decompression cycles, i.e. as a result of fatigue. Tests were made" ^ which produced fracture surfaces similar to those from explosive decompression and the importance of maximum strain, temperature, void size and void position was highlighted.
2, HEAT BUILD-UP
It is rather confusing that the 'heat build-up' type of fatigue test is carried out on an apparatus generally called a flexometer, which brings to mind flex-cracking and cut-growth tests. The term heat build-up is not in fact a particularly good one as rupture of the test piece, set and changes in stiffness can also be measured, but it serves to distinguish the tests from those where only surface cracking is of interest and the test piece geometry is such that temperature rise is minimised.
Flexometers or heat build-up fatigue apparatus operate in compression, shear or a combination of the two and various designs have been in use and standardised, particularly by ASTM, for many years. The test piece geometry and deformation cycle used are, inevitably, somewhat arbitrary and this perhaps contributed to it being much later before there was an international or British standard method.
The international Standard, ISO 4666" , has the title 'Determination of temperature rise and resistance to fatigue in flexometer testing', and is split into three parts: basic principles, the rotary flexometer and the compression flexometer. The first part of ISO 4666 attempts to describe the basic principles of fatigue testing to give guidance on the interpretation of results using particular apparatus and test conditions. This information would seem to be very necessary because results obtained under any particular conditions are quite arbitrary and have no significance apart from the conditions used.
Most fatigue tests apply a fixed pre-stress or strain, partly because without bonding of the test piece it is necessary to hold the rubber in place. The amount of pre-stress or strain will affect the fatigue life; in particular the fatigue life is appreciably shortened if the cyclic deformation passes near to or through zero strain.
A fatigue test can be made with cycles of either constant strain amplitude or constant force amplitude. With constant strain, the resultant stresses are greater for higher stiffness rubbers, so that these are stressed more highly and, other things being equal, will develop more heat. On the other hand, with constant stress a stiff rubber will deform less and consequently tend to give a better fatigue performance. Clearly, to avoid conflicting results it is necessary to choose conditions which correspond with those met in service.

Fatigue 255
It is also possible to use cycles of constant energy which is quite commonly the situation met by such products as dampers and shock absorbers, but this is more difficult from the apparatus point of view. The 'pre-stress' can in fact also be a constant stress or a constant strain.
ISO 4666:Part 1 remarks on the care necessary in measuring temperature rise and the fact that the result depends on where the temperature is measured and on the test piece geometry" " . It recommends testing at a series of strain or stress levels because a comparison of rubbers at one level only can be misleading. The standard also mentions the measurement of creep and set in the test piece after periods of dynamic cycling.
The ASTM standard is 0623" ^ and has the somewhat confusing title of Heat generation and flexing fatigue in compression. It specifies two types of apparatus, the Goodrich flexometer and the Firestone flexometer. The compression flexometer of the ISO standard is essentially the same as the Goodrich and operates by superimposing a cyclic compression strain onto the static deformation caused by a constant force. For the Goodrich flexometer test given in ASTM D623, the 17.8 mm diameter by 25 mm high test piece is cycled at 1800 cycles/min with a stroke of 4.45 mm for 25 min and the temperature rise recorded. A choice of three static loads is given, alternative strokes suggested and two ambient temperatures, 50°C and 100°C, recommended. Apart from measuring temperature rise, the static deflection of the test piece, its dynamic deflection, compression set, and indentation hardness are recorded. The ISO method has the same test piece, speed and choice of strokes, with the option of two pre-loads. The temperature rise, creep, compression set and fatigue life are reported.
The ISO rotary flexometer and the Firestone both operate by superimposing a cyclic shear deformation onto a static compressive deformation but the cyclic action of the two machines is not the same. The ISO apparatus is derived from the St Joe flexometer, which at one time was included in the ASTM standard (up to 1962).
The Firestone flexometer method in D623 is not very specific. The standard test pieces are in the shape of a frustum of a rectangular pyramid but the use of any suitable shape is permitted when cut from products. The apparatus operates at 800 cycles/min and a range of compression loads and amplitudes of oscillation are possible, but no particular conditions are specified. The test piece is fatigued until a definite, but unspecified, decrease in the height of the test piece is reached, which is supposed to represent the onset of internal porosity. Parameters such as temperature rise and changes in compression are reported.
The specification of the ISO rotary flexometer is not much better. It uses cylindrical test pieces and operates at 14.6 or 25 Hz. The axial compression can be either constant stress or constant strain and loading conditions are

256 Physical testing of rubber
suggested for both measurements of temperature rise and resistance to fatigue breakdown. Breakdown is not precisely defined. The vagueness of the ASTM and ISO methods for rotary flexometers reflects the arbitrary nature of these tests.
BS903:Parts A49^^ and A50^^ are identical to ISO 4666:Parts 1 and 3. There is no British equivalent to the rotary flexometer, simply because such an arbitrary apparatus was not considered worthy of standardisation and it is not used in the UK.
A draft is now being progressed in ISO TC 45 for a fourth part of ISO 4666 to cover constant stress flexometers. There is no doubt that there should be a method to allow testing at constant stress but perhaps the most encouraging thing about this new work is that the apparatus is based on modern instrumentation and not on some arbitrary and historical mechanical device. Unfortunately, at the time of writing, the draft needs a great deal of work before it could be called satisfactory.
A servo hydraulic dynamic fatigue machine can, clearly, be used for testing under constant strain as well as constant stress conditions and this would be preferable to the traditional mechanical instruments. Interestingly, a comparison has been made of dynamic mechanical properties measured on a new version of the Goodrich flexometer and a servo hydraulic tester" .
REFERENCES
1. Buist J M and Williams G E. India Rubber World, 127,1951, p320,447 and 567. 2. ISO 132, 1999. Determination of flex cracking and crack growth (De Mattia). 3. Boss J D and Greensmith H W. J. IRI, May/June 1967, p. 165. 4. ASTM D430, 1995 (2000). Rubber deterioration - Dynamic fatigue. 5. ASTM D813, 1995 (2000). Rubber deterioration - Crack growth. 6. ASTM D1052, 1985 (1999). Measuring rubber deterioration - Cut growth using Ross
flexing apparatus. 7. ASTM D3629, 1999. Rubber property - Cut growth resistance. 8. Gent A N, Lindley P B and Thomas A G. J. Appl. Polym. Sci., 8,455,1964. 9. Lake G J and Lindley P B. Appl. Polym. Sci., 8, 707, 1964. 10. ISO 6943, 1984. Determination of resistance to tension fatigue. 11. BS 903 Part A51, 1986. Determination of resistance to tension fatigue. 12. ASTM D4482, 1999. Rubber property - Extension cycling fatigue. 13. Derham C J, Lake G J, Thomas A G. J. Rubb. Res. Inst. Malaya, 22, 2, 191, 1969. 14. Clapson B E and Dove R A. Rubb. J. No. 12,41, Dec. 1972. 15. Breidenbach R F, Lake G J. Phil. Trans. R. Soc. Lond. A 299, 1981, pl89. 16. Lake G J. Rubb. Chem. Technol., 68, 3, 1995, p435. 17. Young D G, Doyle M J. Antec 92, 3-7 '' May 1992, Proceedings, Vol. 1, pl211. 18. Bauman J T. ACS Rubber Division Meeting, Grand Rapids, 17-19* May 2004, Paper 5. 19. Zhbakov B I. Int. Polym Sci. Technol., 23, 5, 1996, pT39. 20. Causa A G, Borowczak M, Huang Y M. ACS Rubber Division Meeting, Cleveland, 21-
24' October 1997, Paper 46.

Fatigue 257
21. Fukahori Y. Int. Polym. Sci. Techno!., 13, 3, 1986, pT37. 22. Alshuth T, Abraham F. Muanyag es Gummi, 40, 10, 2003, p353. 23. Bauman J T, Goolsby R D. ACS Rubber Division Meeting, Anaheim, 6-9 ^ May 1997,
Paper 70. 24. Eisele U, Kelbch S, Engels H-W. Kaut. u Gummi Kunst., 45, 12, 1992, pl064. 25. Kelbch S A, Eisele U G, Magg H. ACS Rubber Division Meeting, Pittsburgh, 11-14 *
October 1994, Paper 19. 26. Sumner A J M, Kelbch S A, Eisele U G. ACS Rubber Division Meeting, Cleveland, 17-
20* October 1995, Paper 67. 27. Bohm D, Struve J. Tire Technology Int., 2000, p55. 28. Bohm D, Struve J. Tire Technology Int., 2000, p67. 29. Yang K J, Kang K J. Rubb. Chem. Technol., 75,4 2002, p657. 30. Sun C, Gent A, Marteny P. Tire Sci. and Technol., 28, 3, 2000, pl96. 31. BS 903-5,2004. Guide to the application of rubber testing to finite element analysis. 32. Muhr A H, Thomas A G. ACS Rubb. Div. Cincinnati, 1988, Paper 32. 33. Samsuri A, Piah M B M. J. Rubb. Research, 7, 2,2004, pi 15. 34. Fleischman T S, Kerchman V, Ebbott T G. Tire Sci. Technol., 29, 2, 2001, p91. 35. Stevenson A. Polym. Test., 4, No. 2 - 4, 1984. 36. Takeuchi K, Nakagawa M, Yamaguchi H, Okumotot T. Int. Polym. Sci. Technol., 20, 10,
1993, pT64. 37. Charrier P. Ostoja-Kuczynski E, Verron E, Gomet L, Chagnon G. IRC 2002, Prague, 1-4*
July 2002, Paper 81. 38. Liu Y, Wan Z, Tian Z, Du X, Jaing J, Yao M. Tire Sci. Technol., 27, 1, 1999, p48. 39. Borodko T V. Int. Polym. Sci. Technol., 5, 3, 1978, pTl. 40. Saintier N, Andre N, Cailletaud G, Piques R. IRC'98, Paris, 12-14* May 1998,
proceedings pi89. 41. Nechiporenko A G. Int. Polym. Sci. Technol, 11,2, 1984, pT6. 42. Edmond K, Ho E, Flitney R, Groves S, Embury P, Rivereau J M. 17* International
Conference on Fluid Sealing, 8-10* , York, April 2003, Proceedings, p241. 43. ISO 4666 Parts 1-3, 1982. Determination of temperature rise and resistance to fatigue in
flexometer testing. 44. Buckley D J. ACS Div. of Rubb. Chem. Meeting, May 1974, Toronto, Paper 34. 45. ASTM D623,1999. Heat generation and flexing fatigue in compression. 46. BS 903:Part A49, 1984. Determination of temperature rise and resistance to fatigue in
flexometer testing (basic principles). 47. BS 903:Part A50, 1984. Determination of temperature rrise and resistance to fatigue in
flexometer testing (compression flexometer). 47. Askea D W. ACS Rubber Division Meeting, Cleveland, 17-20* October 1995, Paper 100.

Chapter 13
ELECTRICAL TESTS
Rubbers are usually electrically insulating and this property is widely exploited in cables and various components in electrical appliances. They can also be made anti-static and even conducting by the addition of suitable carbon blacks. In all cases, it is the combination of the electrical properties and the inherent flexibility of rubbers which makes them attractive for particular applications.
In principle, the measurement of the electrical properties of rubber is the same as for any other material yielding results of the same order of magnitude, but particular precautions have to be taken because of distortion of this relatively low stiffness material by applied electrodes, and the very high contact resistances which may exist between the electrodes and the rubber surface. In addition, the properties are often very sensitive to the past history of the rubber, including mechanical stress, which can lead to a large degree of variability. It is not intended to dwell here on the aspects of electrical measurement which are common to all materials, but to emphasise the aspects which are more particular to rubbers. Electrical testing is a speciahsed subject and, as much of the apparatus used is complex, the work is normally undertaken by those having suitable training and expertise, rather than in a typical rubber laboratory.
The tests most likely to be needed for rubbers can be classified as:
Resistance or resistivity Surface charge Electric strength Tracking resistance Power factor and permittivity

260 Physical testing of rubber
Resistance or resistivity is by far the property most often measured. For anti-static and conductive rubbers, only resistivity and surface charge, measurements are useful because such rubbers would not be used in situations requiring low dielectric loss or involving high voltages.
1. RESISTANCE AND RESISTIVITY
Because the surface of rubbers may conduct electricity more easily than the bulk of the material, it is usual to distinguish between volume resistivity and surface resistivity. Volume resistivity is defined as the electrical resistance between opposite faces of a unit cube, whereas surface resistivity is defined as the resistance between opposite sides of a square on the surface. Resistivity is occasionally called specific resistance. Insulation resistance is the resistance measured between any two particular electrodes on or in the rubber and, hence, is a function of both surface and volume resistivities and of the test piece geometry. Conductance and conductivity are simply the reciprocals of resistance and resistivity respectively.
In practice, resistivity is calculated from the resistance measured with a known, fairly uncomplicated geometry. If a distinction is being made between volume and surface resistivity then the test arrangement is chosen to minimise the effect of the unwanted component of resistivity. With insulating rubbers, the surface is frequently more conductive than the bulk of the material because of adsorbed moisture or contamination, and a sensible distinction can be made between surface and volume resistivity. With most anti-static and conducting rubbers, the surface layer is no more conductive than the bulk and then, whatever the geometry chosen, the current will largely take the 'easy' route through the bulk of the material, and surface resistivity has no real meaning. Hence, with these lower resistance rubbers it is usual to assume that resistivity consists of the volume component alone and to refer to the measured value as simply resistivity. Similarly, if the surface of an insulating rubber is no more conductive than the bulk, a surface measurement will have no meaning.
It is not possible to make a clear cut distinction between insulating, antistatic and conducting rubbers. The definitions should be made with respect to the resistance between two relevant points on a product, rather than to the resistivity of the rubber, because if you took a long enough length of a fairly low resistivity rubber the total resistance from end to end would effectively make it an insulator. Generally, resistances of up to 10" ohms are considered conductive, between 10" and 10 ohms anti-static and above this insulating, although various definitions have been given by different workers or according to the hazard associated with the product. Typically, the

Electrical tests 261
specification limits for antistatic products are in the region of 5 x 10" -lO^ohms. The test methods for insulating and anti-static/conducting rubbers differ considerably and the two will be discussed separately.
In all cases, there is, in addition to the resistance of the rubber, a contact resistance at the electrode/rubber interface. The magnitude of this contact resistance is a complex function of the electrode system used, the rubber under test and the applied voltage, and the mechanisms which produce it have not been fully elucidated. When testing insulating rubbers, the contact resistance is ignored because, although it may be high, there is generally no way of measuring it. Tests are, however, made with well-defined electrode systems. Contact resistance is a very troublesome complication when testing conductive and anti-static rubbers and will be discussed in Section 1.2.
1.1 Tests on Insulating Rubbers
The usual standard methods for volume and surface resistivity both use the same test piece and electrode geometry and essentially the same measuring circuit. There are no ISO or lEC methods for rubbers but, where national standards specifically for polymers exist, they are usually adaptations of the lEC Publication 60093^ for insulating materials in general. The relevant British Standards for rubbers are BS 903-Cl^ for surface resistivity and BS 903-C2^ for volume resistivity. ASTM has an equivalent to the lEC standard for insulating materials generally, 0257" , but no standard specifically for rubbers.
Sections through circular electrode systems are shown in Figure 13.1. If the arrangement shown in Figure 13.1(a) is used for volume resistivity measurement, current will pass over the surface as well as through the volume of the rubber and, likewise, if the arrangement in Figure 13(b) is used for surface resistivity some current will pass through the volume of the rubber. Also, in arrangement (a) the current in the volume of the rubber near the electrode edges flows in a curved path giving a 'fringing' effect and increases the effective electrode area. As mentioned previously, the surface resistivity of insulating rubbers is generally lower than their volume resistivity so that the effect of current flow in the bulk of the rubber in arrangement (b) for surface resistivity is not serious.
The following means, as shown in Figure 13.1(c) and (d) are used in the BS 903 methods to minimise or ehminate the problems:
(a) The thickness of the test piece is much less than the electrode diameter of either 15 or 5 cm - this reduces the effect of fringing.
(b) A 'guard ring' or annular electrode surrounding the top electrode (Figure 13.1(c) is used for volume resistivity and a 'guard plate' electrode (bottom electrode in Figure 13.1(d) for surface resistivity

262 Physical testing of rubber
measurements. In arrangement (c) the guard ring is connected so that any current passing over the test piece surface is not included in the current measured. In BS 903 the gap between the centre and guard electrode is typically 1 cm and the effect of fringing would be reduced if this was made smaller but such a refinement is not really warranted.
1111111111))
Guord ring
^ 1
Top electrode
^ "^//////////////^^^^^
3ottc
bW^ ^ ^ ^ ^ ^ ^ ^ ^ ^ ^ -=.
Bottom electrode J
(c)
Ring electrode
.m.
Top electrode
^Z^^^Z^^^Z^^ZL ^ . -=.
K\\\\\\^\\\^^\^^^ ^ Guard plate
(d) X
Figure 13-1. Electrode systems, (a) Showing 'fringing' effect and surface conduction in volume resistivity measurement; (b) showing volume conduction in surface resistivity measurement; (c) electrodes, guard ring and circuit for volume resistivity measurement; (d) electrodes, guard plate and circuit for surface resistivity measurement. (G = glavanometer or other current measuring device.)

Electrical tests 263
For reasons which are not apparent, the British standard for surface resistivity was revised much more recently than both that for volume resistivity and the lEC standard. This results in there being some differences in the details of the electrodes and the calculation. The electrodes can be formed by painting on a colloidal graphite suspension in water, using conducting silver paint, by vacuum deposition of a metallic film or using a conductive rubber sheet, in each case backed by rigid metal (usually brass) plates. lEC 60093 also allows liquid electrodes and BS 903-Cl gives no details other than electrodes can be rigid or intimately applied. The graphite electrodes are the type most widely used. Other types of conductive paint or tin foil backed on to wet graphite are probably equally good but, in any case, it is essential that the electrodes are prepared and applied with very great care. Mercury electrodes are not necessarily better and were removed from the British standards because they could be a health hazard.
The overall dimensions of the electrode system are not really critical, but the size does affect the accuracy of the current measuring device needed, larger sizes being advantageous for higher resistivity materials. lEC 60093 makes no recommendations, whilst the British standards specify two sizes for volume resistivity but suggest several sizes in an appendix for surface resistivity.
In Figure 13.1, the voltage source is shown simply as a battery and the current measuring device as a galvanometer, but in practice the circuits needed are more complex. Some guidance on construction is given in the standards, including appendices, and BS 903-1 makes reference to BS 6233 (identical to lEC 60093) which gives more details. The measurement of very high resistivities is beset with practical difficulties and hidden errors. It is essential that apparatus is selected and operated with great care and expertise to achieve success. Helpful advice is given by Norman^, who has also discussed at length the same measurements for plastics^, and more recently by Barry .
Resistivity is sensitive to temperature and humidity, and tests are usually made after conditioning in the standard atmosphere of 23 ± 2°C and 50 ± 5%RH. Surface resistivity is particularly sensitive to humidity and the standard humidity should be maintained during the test. Where results are to be used as design or performance data, it would be advisable to test over a range of humidities and (perhaps) temperatures. The resistance of the test piece is measured after the test voltage has been applied for a set period, usually 1 min, although this will very often not be an adequate time for the current, and hence the measured resistivity, to reach an equilibrium value. If it is suspected that this is the case, resistivity can be monitored as a function of time of electrification.

264 Physical testing of rubber
The quantity directly measured is the resistance of the test piece which is then converted into resistivity by means of the appropriate formula involving the dimensions of the electrode system:
Volume resistivity (ohm cm) = — [D^ + 5) —^
Surface resistivity (ohm or sometimes ohm per square) = 27iR^
log,
where Rv = volume resistance of test piece (ohm), Rs = surface resistance of test piece (ohm), d = thickness of test piece (mm), Dl = diameter of top inner electrode (mm), D2 = internal diameter of ring (top outer) electrode (mm).
Note that the unit for surface resistivity does not involve length as does the unit for volume resistivity. Neither involve the unit of volume.
Strictly, there should be a correction for the effect of fringing but this is not normally considered significant. It is not usually possible to obtain very great precision in measurements of high resistivity and results are never quoted beyond two significant figures. Often, between sample variability is such that two materials would be considered really significantly different only if their resistivities differed by a factor of 10.
The discussion given in BS 4618, Sections 2.3 and 2.4^ on design data for plastics applies in principle to rubbers, and stresses the advantage of measuring resistivity as a function of temperature, humidity, electric stress and time of electrification.
Erdman^ considers the problems of extraneous currents in resistivity measurement and describes the alternating polarity method, which is claimed to give better repeatability than the classic method for very high resistivities. Leonidopoulos^^ compared the usual ring electrode method with a concentric cylindrical electrode system for surface resistivity measurement of thin film and found that the ring electrodes yielded higher currents because of charge injection. Tsai and Bresee^^ used parallel plate and cylindrical electrodes to measure surface resistivity and compared results obtained using Ohm's law for field theory and Ohm's law for circuit theory, showing the latter to be inadequate for high resistance materials.
Measurements of resistance are not normally made using an applied AC voltage and, if they were, account would need to be made of the fact that the

Electrical tests 265
total impedance would be comprised of conductance and capacitance terms. Results of both DC and AC measurements have been given by BuUer et al .
There is an international method, ISO 2951^^ for the determination of insulation resistance of rubbers. The test pieces specified are either flat sheets or tube or rod and the electrodes either conductive paint or metal bars. It is apparent by the reference to rigid materials that the wording has been lifted' from a general document for insulating materials, presumably lEC 167 " . There is no mention of metal backing plates for the paint electrodes and, to obtain consistent results with rubbers, the electrode system would need to be defined more precisely.
Paint electrodes are spaced 10 mm apart and should be 100 mm long. The measured resistance is normahsed to these conditions if any other length of electrode is used, as would presumably be the case for rod or tube. Bar electrodes are longer than the test piece width and the measured resistance is normalised to what is termed a 25 mm electrode length, meaning a 25 mm wide test piece, with the electrodes 25 mm apart. The resistance is measured using a 500 volt supply, in the same manner as for resistivity, after 1 min electrification. It would be reasonable to suggest that this standard would have far greater value if it were written around products, which is where resistance tests as opposed to resistivity tests are required.
The British equivalent BS 903-C5^^ covers plastics as well as rubbers and includes methods using taper pins, which are not applicable to rubber. It is in fact a copy of IEC167, the general international method. Hence, there is a slightly curious situation of the BS following the lEC rather than the particular ISO method for rubbers. The essential question is whether the particular needs of rubbers merits a special adaptation of the test procedure. The UK did not think so and the ISO method only paid lip service to the particular needs of rubber. ASTM does not have a method specific to rubbers and the procedures are covered in 0257"^ for insulation materials generally.
1.2 Tests on Conducting and Anti-static Rubbers
A most comprehensive and detailed account of conductive polymers and associated test methods was given by Norman^^ in what became the standard text book on the subject, and is still a good source if an in-depth understanding is required. The account given here will be restricted to the standard methods.
The international standard for measurement of resistivity of rubbers is ISO 1853*^ which details one procedure only, the potentiometric or four electrode method. The principle of the method is shown in Figure 13.2; the strip test piece has metal current electrodes clamped at each end and is

266 Physical testing of rubber
connected in series with a voltage source and a means of measuring the current flowing. The 'potentiometric' electrodes are placed on the test piece between the two current electrodes and connected to an electrometer such that the voltage drop between them can be measured. The advantage of this procedure is that contact resistances, which are the biggest problem in measurements on anti-static and conducting rubbers, are virtually eliminated. The contact resistance at the current electrodes does not matter and those at the potentiometric electrodes do not affect the measurement if no current is taken by the very high impedance electrometer. The resistivity is calculated from the measured current and voltage drop and the cross section and length of the test piece between the potentiometric electrodes.
^
SUITABLE ELECTROMETER
Figure 13-2. Circuit for potentiometric (four electrode) method. All components within the rectangle B should be insulated (better than 10 ^ ohms) from each other.
Mechanical conditioning can greatly affect the measured resistivity but the effect of deformation is not entirely permanent and recovery can be accelerated by heating. For this reason, ISO 1853 specifies conditioning at 70°C, followed by conditioning at 23°C and 50% RH without disturbance of the test piece. The potentiometric electrodes are shown in detail and sources of a suitable electrometer given in an annex. The potential of the current

Electrical tests 267
source is not specified but this is commonly a 1.5V dry cell. For low resistivities, a multi-ammeter can be used for the current measurement, but for low currents an electrometer would be used to measure the voltage drop across a known standard resistor. The method is generally restricted to resistivities of less than 10 ohm cm and much of the apparatus must be very highly insulated from earth.
The alternative approach to overcoming the contact problems is to use electrodes which have a very low contact resistance. In the equivalent British Standards BS 2044^ , three procedures are given with method 2 being essentially the same as ISO 1853. Method 1 uses a strip test piece with brass electrodes at either end bonded in during vulcanisation. This gives a very efficient electrode system with negligible contact resistance and, hence, is the preferred method, although it is only suitable when laboratory prepared test pieces are available and the rubber will bond to brass. Any suitable resistance measuring instrument can be used as long as it does not dissipate more than 0.25W in the test piece, so avoiding any heating. The third method uses less efficient electrodes in the form of tin foil wrapped on to wet colloidal graphite painted onto the test piece. Hence, it is similar to method 1 but less accurate and should only be used when methods 1 and 2 are not possible.
Despite its title, ASTM D991^^ is a resistivity method for sheet rubber material, not for products. It specifies the four electrode method and, hence, is similar to ISO 1853 and BS 2040, method 2, but the electrode construction is different and care would need to be taken to avoid leakage between the current and potentiometric electrodes.
As regards testing, a resistivity of about 10 ohm cm is taken as the dividing line between anti-static and insulating rubbers, above this level the methods of Section 1.1 being used. In practice, this can be very annoying when unknown rubbers around 10 to 10 ohm cm are to be measured, although some overlap is possible, because of the great difference in test piece geometry between the methods. The Japanese delegation to ISO TC 45 produced some interesting results of measurements made using the geometry for insulating rubbers but with only IV potential, when the effect of contact resistance was evident above 10" ohm cm.
On anti-static and conducting products, it is usual to measure the resistance between specified points. More or less efficient electrode systems are used, contact resistance included and the resistance usually measured with a commercial 'insulation tester'. The relevant international method is ISO 2878^ . This used to be used in conjunction with two specifications (ISO 2882 and 2883) for antistatic and conductive products and, consequently, had procedures detailing the electrodes to be used for the products in those standards. ISO 2882 and 2883 were withdrawn, largely because of no

268 Physical testing of rubber
relevant expertise or experience within TC45, and the present version of ISO 2878 only contains details for basic geometries of product.
The British method BS 2050^ contains the requirements for industrial and hospital products in addition to the test procedures. At the time of writing, a decision is pending as to whether to adopt the new ISO 2878 and/or revise the specification requirements. There is no ASTM method specifically for rubbers.
2. SURFACE CHARGE
An insulating rubber can become charged by direct application of a voltage or by friction against another material, and the main purpose of antistatic rubbers is to allow the rapid decay of such a charge in circumstances where it would be a hazard or a nuisance. lEC is developing a guide to the principles of electrostatic phenomena but a basic guide to electrostatics, the hazards caused by electrostatic charges and aspects of measurements is available as BS 7506 Part 1 1
The likely efficiency of a material to dissipate charge rapidly can be estimated from a measurement of resistivity, and the rate of charge decay for a surface with its edges held at zero potential has been shown to be linearly dependent on resistivity^ ' ' . Indeed, resistivity is commonly used as a means of classifying and specifying antistatic products. However, there are many experts who would argue that this is not satisfactory for some products and situations. Certainly, a direct measure of the charge and its rate of decay is desirable.
There are no such methods for rubber specifically but methods relating to charge and its dissipation from materials generally can be found in IEC61340 " ^ and BS 7506 Part 2^\ Methods were discussed in some detail by Norman^ , and Blacker and Birley^^ have considered some of the problems together with a rating system. lEC also has methods for simulation of electrostatic effects^ ' ^ and methods for flooring/footwear"^ . Methods specifically for plastics have now been withdrawn in favour of BS 7506.
The voltage due to the charge on an insulator is influenced by any measuring instrument brought near to it and the charge can only be measured by Faraday ice-pail types of experiment where the sample is put completely inside the screened, insulated electrode of an electrometer. All that can usually be measured is the field strength above the sample with a given geometry of metal, or whatever, around the measuring area. This is achieved with a suitable field meter and can be used to follow the decay in field strength of a charged and earthed test piece. The field strength is proportional to charge for the given test geometry and the result is expressed

Electrical tests 269
as the time to decay to 50% of the initial meter reading, which is far less critically dependent on geometry than is the absolute meter reading.
3, ELECTRIC STRENGTH
Electric strength is usually taken as the nominal voltage gradient (applied voltage divided by test piece thickness) at which breakdown occurs under specified conditions of test. These specified conditions of test are important as the measured electric strength is not an intrinsic property of the material but depends on test piece thickness, time of electrification and the electrode geometry, as well as on conditioning of the material.
There is no ISO standard for electric strength but there is an lEC method for tests at power frequencies (48-62 Hz) on electrical insulating materials generalV^. A choice of electrodes is specified to suit different geometries of test piece but, for rubbers, the most common arrangement is to measure through the thickness of a plane sheet with cylindrical electrodes. The test voltage is obtained via a step-up transformer with a suitable power rating and the test is normally conducted in transformer oil. Several modes of applying the voltage are specified but this is essentially either raising from zero at a steady rate or increasing in steps, with a choice of rates, until breakdown occurs. Results can be expressed as the breakdown voltage or the electric strength taking account of thickness. There are a lot of permutations possible and, because results will vary with procedure and test piece thickness, it is necessary to check carefully exactly which procedure has been used. For products, a proof voltage may be specified for a given length of time and the result is either pass or fail. This is the case, for example, with electrician's gloves where water is used to convey the voltage. For design purposes, it may be desirable to measure breakdown strength as a function of test piece thickness, time of electrification and of electrode geometry.
There is also a second part of lEC 60243 covering additional requirements for tests using direct current " and a third part for 1,2/50 |is impulse tests^^
The British standards are the same as the lEC methods and numbered as BS EN 60243. The ASTM equivalent at power frequencies is D149^^ which has a similar choice of procedures. The details of the procedures are left to the material specification and, again, it should be emphasised that results are only comparable if exactly the same procedure and conditions are used. There is also a separate ASTM method '' for proof testing of thin sheet material. ASTM D1531^^ is for direct voltage and D3426^^ for impulse tests.
Equipment for breakdown tests is often constructed by the user from bought-in components. Some information is given in the test method

270 Physical testing of rubber
standards to aid this process but there is also an lEC guide on high voltage testing techniques' '' ^
4. TRACKING RESISTANCE
The term tracking relates to the development of conductive paths or tracks on a test piece surface between electrodes under discharge conditions. There are, however, two types of tracking tests, low voltage and high voltage. The low voltage tests (up to 1000 V) rely on a contaminant applied between the electrode to induce initial flash over, whilst the high voltage tests may or may not use a contaminant and use equipment similar to that for breakdown tests with specific electrode systems. Neither type of test is very commonly applied to rubber but the low voltage test is generally the more important of the two.
ELECTROLYTE SUPPLY
ELECTRODES
TEST PIECE
No. OF DROPS
(b) CTI VOLTAGE
Figure 13-3. Tracking test, (a) Electrode system; (b) effect of voltage on number of electrolyte drops causing 'failure'. CTI is the comparative tracking index.

Electrical tests 271
The best known test is that given in lEC 60112" ^ (two amendments to this standard have been published). The basis of the test is to position electrodes as shown in Figure 13.3 and to allow drops of an electrolyte to fall at fixed intervals on to the test piece surface between the electrodes whilst an AC voltage is applied to them. The number of drops of electrolyte to cause tracking, as indicated by a 'continuous' current passing between the electrodes, is noted. The procedure is repeated at different voltages and a curve constructed as shown in Figure 13.3. An investigation into the effect of variables in this test on the result has been given by Yarsley et al" ^ and the subject of tracking has been discussed at length by Mathes" " .
The British standard is numbered as BS EN 60112 and the ASTM method is in 03638"'. There are a number of other tracking and arcing tests but they are rather specialised and not of sufficient general interest for rubbers to be considered here.
5. PERMITTIVITY AND POWER FACTOR
These properties are sometimes grouped as the dielectric properties but this is not entirely logical as dielectric simply means insulating. Relative permittivity of a material can, for practical purposes, be defined as the ratio of the capacitance of a condenser having the material as the dielectric to the capacitance of a similar condenser having air, or more precisely, a vacuum as the dielectric. The word relative is usually dropped and the property simply called permittivity and is the same thing as used to be called dielectric constant (this term is apparently still used in the USA).
The power factor of a material may be described loosely as the fraction of the electrical energy stored by the condenser in each cycle which is lost as heat. This arises because the phase difference between voltage and current deviates from 90° (which it would be for a perfect dielectric, e.g. vacuum) by the loss angle, 5. The dissipation factor is the tangent of the loss angle, tan 5.
The actual power loss in a dielectric in an AC field is proportional to the loss factor, i.e. the product of permittivity and power factor, so that to achieve the minimum loss both of these parameters must be small. Power loss is also proportional to frequency so that at high frequencies, for example in telecommunications applications, it may be especially necessary to use low permittivity and low loss materials. For making capacitors, a high permittivity is desirable because then the physical size of the component for a given capacitance can be as small as possible. A high loss is not normally wanted in a capacitor so that the ideal dielectric would have a high permittivity and a low power factor. A high loss factor may be desirable
2 72 Physical testing of rubber
where it is required to absorb energy, for example in radio frequency or microwave heating.
For most materials, permittivity and power factor are not constant over the very wide range of frequencies of industrial interest and, because the same apparatus and method cannot be used at all frequencies, standard methods are usually subdivided into procedures for different frequency ranges.
The general international standard for insulating materials at frequencies up to 300 MHz is lEC 60250^^ but there are no ISO methods for rubbers in particular. This standard is somewhat ancient and lacking in detail of procedures. The ASTM standard, DISO" , also covers frequencies up to 300 MHz and gives useful background information. The British standard, BS 7663" , applies for frequencies from 50 Hz to 1 MHz and is, again, applicable generally to solid insulating materials.
Various commercial instruments are available for measurement of capacitance and tan 5. At power frequencies, a Schering bridge with Wagner earth or a transformer ratio arm bridge type instrument is appropriate. Such methods were given in detail in BS903-C3 but this has been withdrawn. Test pieces are either flat sheet or round tube, electrodes for the former being similar to those for resistivity of insulating material but with a smaller guard
For frequencies from 50Hz-lMHz the air substitution (Lynch method) or liquid immersion methods are generally used. BS 7663 gives details for air substitution and both two and one fluid immersion methods. ASTM 01531"^^ specifies the same single immersion method as Method C of BS 7663.
The Hartshorn and Ward apparatus is a very old method for radio frequencies specified in BS 2067^ .This standard was declared obsolete in 1985 and no equipment is available, but it remained on the books because of reference in standards for polymeric materials. The air substitution method would be better for most purposes.
The principles involved in measurements at frequencies above 300MHz are covered in lEC 60377-1^^ and measurements using resonant cavity procedures described in lEC 60377-2^ . Similar resonant cavity procedures for microwave frequencies are given in ASTM D2520^^
Dielectric analysis (electrothermal analysis, dielectric spectroscopy) is the measurement of dielectric properties as a function of frequency and temperature. It is increasingly finding use in characterising polymer structure and, in particular, the curing process. Its use in this respect has been considered in Chapter 6.

Electrical tests 273
REFERENCES
1. lEC Publication 60093, 1980. Methods of test for volume resistivity and surface resistivity
of electrical insulating materials. 2. BS 903-Cl, 1991. Determination of surface resistivity. 3. BS 903-C2, 1982. Determination of volume resistivity. 4. ASTM D257, 1999. Standard test methods for DC resistance or conductance of insulating
materials. 5. Brown R P. (Ed.). RAPRA Guide to Rubber and Plastics Test Equipment, in Polymer Test
Equipment and Services Directory, Rapra Technology Ltd, Shawbury, 2000. 6. Brown R P. (Ed.). Handbook of Plastics Test Methods, Longman Scientific, Harlow, 1988. 7. Brown R P. (Ed.). Handbook of Polymer Testing, Marcel Dekker, New York, 1999. 8. BS 4618,1975. The presentation of plastics design data. Sections 2.3 and 2.4, Volume and
surface resistivity. 9. Erdman B. ACS Rubber Division Meeting, 21-24*'' October 1997, Paper 33. 10. Leonidopoulos G. Polym. Test., 8, 1, 1988/9, pi9. 11. Tsai P P, Bresee R R. J. Appl. Polym. Sci., 82, 11, 2001, p2856. 12. Buller M, Mayne J E O and Mills D J. J. Oil. Col. Chem. Assoc, 59, 10, 1976, p351. 13. ISO 2951, 1974. Vulcanised Rubber - Determination of insulation resistance. 14. lEC Publication 60167, 1964. Methods of test for the determination of the insulation
resistance of solid insulating materials. 15. BS 903-C5, 1992. Determination of insulation resistance. 16. Norman R H. Conductive Rubbers and Plastics, Elsevier, 1970. 17. ISO 1853,1998. Conducting and antistatic rubbers - Measurement of resistivity. 18. BS 2044, 1984. Determination of resistivity of conductive and antistatic plastics and
rubbers (Laboratory methods). 19. ASTM D991, 1989 (2000). Volume resistivity of electrically conductive and antistatic
products. 20. ISO 2878, 2005. Anti-static and conductive rubber products - Determination of electrical
resistance. 21. BS 2050,1978. Electrical resistance of conductive and antistatic products made from
flexible polymeric material. 22. BS 7506 Part 1,1995. Measurements in electrostatics - Guide to basic electrostatics 23. Boyd J and Bulgin D. J. Test. Inst., 48, 66, 1957. 24. Beesley J H. and Norman R H. RAPRA Members Report No. 5, 1977. 25. lEC 61340-2-1,2002. Electrostatics - Measurement methods - Ability of materials and
products to dissipate static electric charge. 26. lEC 61340-2-2,2000. Electrostatics ~ Measurement methods - Measurement of
chargeability. 27. lEC 61340-2-3,2000. Electrostatics - Methods of test for determining the resistance and
resitivity of solid planar materials used to avoid electrostatic charge accumulation. 28. BS 7506 Part 2,1996. Measurements in electrostatics - Test methods. 29. Blacker R S, Birley A W. Polym Test., 10,4, 1991, p241. 30. lEC 61340-3-1,2002. Electrostatics - Method for simulation of electrostatic effects-
Human body model - Component testing. 31. lEC 61340-3-2,2002. Electrostatics - Method for simulation of electrostatic effects-
Machine model - Component testing. 32. lEC 61340-4-5,2004. Electrostatics - Standard test methods for particular applications -
Methods for characterizing the electrostatic protection of footwear and flooring in combination with a person.
2 74 Physical testing of rubber
33. lEC 60243-1, 1998. Electric strength of insulating materials - Test methods -Tests at power frequencies.
34. lEC 60243-2,2001. Electric strength of insulating materials - Test methods - Additional requirements for tests using direct current.
35. lEC 60243-3, 2001. Electric strength of insulating materials - Test methods - Additional requirements for 1,2/50 |is impulse tests.
36. ASTM D149,97 (2004). Standard test method for dielectric breakdown voltage and dielectric strength of electrical insulating materials at commercial power frequencies.
37. ASTM D1389,1997 (2004). Standard test method for proof voltage testing of thin soHd electrical insulation material.
38. ASTM D3755,1997 (2004). Standard test method for dielectric breakdown voltage and dielectric strength of electrical insulating materials under direct voltage stress.
39. ASTM D3426, 1997 (2004). Standard test method for dielectric breakdown voltage and dielectric strength of electrical insulating materials using impulse waves.
40. lEC 60060-1, 1989. High vohage test techniques - General. 41. lEC 60060-2,1995. High vohage test techniques - Measuring systems. 42. lEC 60112, 2003. Method for the determination of the proof and comparative tracking
indices of solid insulating materials. 43. Yarsley V E, Grant W J. and Ives G C. ERA Report A/T 136, 1980. 44. Mathes K N. Engineering Dielectrics, Vol. II, Part B, Bamikas and Eichom (Eds.),
ASTM, 1984, p283. 45. ASTM D3638,1993 (1998). Standard test method for comparative tracking index of
electrical insulating materials. 46 lEC Publication 60250,1969. Recommended methods for the determination of the
permittivity and dielectric dissipation factor of electrical insulating materials at power, audio and radio frequencies including metre wavelengths.
47. ASTM D150, 1998 (2004). Test methods for AC loss characteristics and permittivity (dielectric constant) of solid electrical insulation.
48. BS 7663, 1993. Methods of test for determination of permittivity and dissipation factor of electrical insulating material in sheet or tubular form.
49. ASTM D1531, 2001. Standard test methods for relative permittivity (dielectric constant) and dissipation factor by fluid displacement procedures.
50. BS 2067, 1953. Determination of power factor and permittivity of insulating materials (Hartshorn and Ward Method).
51. lEC 60377-1, 1973. Methods for the determination of the dielectric properties of insulating materials at frequencies above 300MHz - General.
52. lEC 60377-2, 1977. Methods for the determination of the dielectric properties of insulating materials at frequencies above 300MHz - Resonance methods.
53. ASTM D2520, 2001. Standard test methods for complex permittivity (dielectric constant) of solid insulating materials at microwave frequencies to 1650^C.

Chapter 14
THERMAL PROPERTIES
The term 'thermal properties' is open to more than one interpretation. Specific heat, thermal conductivity and diffusivity clearly come under this heading but the term can be taken to also include heat ageing, low temperature tests and fire resistance. However, these are more properly dealt with, as in this volume, under Effect of Temperature. Thermal analysis is a group of techniques in which a property of a sample is monitored against temperature, or time at a temperature, and, therefore, is also generally concerned with measuring the effect of temperature. Nevertheless, for convenience, a brief overview of thermal analysis is given here.
The thermal properties of rubber are of very great importance, particularly in the processing stages, but there is a remarkable dearth of reliable data. Traditionally, the approach to heating and cooling problems was empirical rather than by careful analysis. The data needed for such analysis was not available, largely because of the undoubted experimental difficulties to be overcome but, even with data, somewhat complicated calculation is required.
In the last two or three decades, the value of an analytical approach to heat transfer problems has been increasingly realised and considerable effort has been devoted to developing measuring techniques and convenient methods of calculation to produce the data needed as input to process simulation software. However, the measurement of thermal properties remains a very specialised subject, there is little evidence of standard procedures and the tests are carried out in relatively few laboratories. As was said of another specialised area of rubber testing, electrical testing, the measurement of the thermal properties of rubber is in principle the same as for other materials although there are particular difficulties, especially when testing unvulcanised rubbers at processing temperatures.

2 76 Physical testing of rubber
1. THERMAL ANALYSIS
The area of largest growth in testing in recent times has almost certainly been thermal analysis. Essentially, thermal analysis is the study of one or more properties of a material as a function of temperature. A thermal analyser is, hence, an apparatus which allows the automatic monitoring of the chosen property with temperature change. In principle any property can be measured (and most have been); for example dynamic thermal mechanical analysis measuring dynamic modulus and damping, thermogravimetry to measure weight changes and thermodilatometry to follow dimensional change. The change of these properties with temperature can be measured without an analyzer but it is the automation of the measurements, together with scanning across a temperature range, which has made the thermal analysis techniques so time and cost effective.
It becomes clear that, although thermal analysis is often treated as one subject, the information gained and the use to which it is put are very varied. For example, thermodilatometry is essentially a dimensional measurement which can measure thermal expansion or, possibly, dimensional change resulting from a chemical reaction. Dynamic thermal mechanical analysis essentially measures damping and dynamic modulus, but the change of these with temperature is one way of detecting the glass transition point. Thermogravimetry is primarily a chemical analysis method, measuring the changes in mass due to chemical reactions. Reference has been made to relevant techniques in the appropriate chapters e.g. Chapter 9 (Dynamic stress and strain properties) and Chapter 15 (Effect of temperature).
As regards thermal properties, the techniques of interest are differential thermal analysis (DTA) and its variant differential scanning calorimetry (DSC). In these techniques heat losses to the surrounding medium are allowed but assumed to be dependent on temperature only. The heat input and temperature rise for the material under test are compared with those for a standard material. In DTA, the two test pieces are heated simultaneously under the same conditions and the difference in temperature between the two is monitored, whereas in DSC the difference in heat input to maintain both test pieces at the same temperature is recorded.
There have been many papers describing applications of thermal analysis to polymers, including a comprehensive review by Brazier^ which specifically covered rubbers, a shorter overview of rubber apphcations^, applications of DSC to polymers^ DMA of rubbers in various fluid environments' , modulated DSC^ and the combination of scanning thermal microscopy and modulated DSC . The definitive tome on the subject is The Thermal Characterization of Polymeric Materials^ in two volumes and 2500

Thermal properties 277
pages. The first in a series of standards on the appUcation of DSC to plastics^ covers the general principles.
2. SPECIFIC HEAT
Specific heat is the quantity of heat required to raise the unit mass of the material through 1°C, i.e. the heat capacity of unit mass.
The principal specific heats are those at constant volume and constant pressure but the specific heat at constant pressure is the quantity normally measured. The specific heat at constant volume, which is virtually impossible to measure, can be calculated from:
c —c — TBP^
where: Cp = specific heat at constant pressure, Cy = specific heat at constant volume, T = absolute temperature, B = bulk modulus, p = coefficient of volume expansion and p = density.
The difference between the two specific heats is usually small enough to be ignored.
Specific heat is measured by supplying heat to a calorimeter containing the test piece and measuring the resulting temperature rise. An adiabatic calorimeter is one in which no exchange of heat between the calorimeter and its surround is allowed and this is achieved by surrounding the calorimeter by a jacket which is heated to follow the temperature change of the calorimeter itself A variety of adiabatic calorimeters have been described and a number have been referenced by Hands in a review of specific heat of polymers^ and in a chapter on thermal properties of polymers^^. Although simple in principle, the design of these calorimeters will be complex to obtain the highest levels of precision.
A variation, which results in a more simple apparatus, is the drop calorimeter. The test piece is heated (or cooled) externally, dropped into the calorimeter and the resultant change in temperature monitored. For the simplest measurements, the calorimeter need not be surrounded by an adiabatic jacket but in that case, corrections for the heat exchange with the surroundings must be applied. A procedure using a drop calorimeter has been standardized for thermal insulation in ASTM C351^^ It is possible to combine the adiabatic and drop calorimeter methods by dropping a heated sample into an adiabatic chamber and this has been used for plastics^^.
Except where the very highest precision is required, when an adiabatic calorimeter would be used, it is usual nowadays to measure specific heat by

2 78 Physical testing of rubber
a comparative method using differential thermal analysis (DTA) or its variant, differential scanning calorimetry (DSC), the latter being the preferred and usual technique. A calibrant is needed, usually synthetic sapphire, and the experimental procedure has been outlined, for example, by Richardson^^ Detailed procedures are being standardized for plastics but, unfortunately, at the time of writing the work appears to be stuck as a draft, DIS 11357-4. ASTM E 1269 "* covers sohd materials generally and notes that it contains, literally, more or less the procedures of ISO 11357-4 (it appears to have assumed that the ISO standard was published).
3. THERMAL CONDUCTIVITY AND DIFFUSIVITY
Thermal conductivity may be defined as the quantity of heat passing per unit time normally through unit area of a material of unit thickness for unit temperature difference between the faces. In the steady state, i.e. when the temperature at any point in the material is constant with time, conductivity is the parameter which controls heat transfer. It is then related to the heat flow and temperature gradient by:
q = -KA — dx
where: q = rate of heat flow, K = thermal conductivity, A = test piece area, 0 = temperature, and x = test piece thickness. The unit of thermal conductivity is the Watt per metre degree Kelvin (W/mK).
Thermal conductivity is obviously of importance in the design of products which will have a thermal insulation function and also in the design of rubber processing equipment.
Thermal diffusivity is the parameter which determines the temperature distribution through a material in non-steady state conditions, i.e. when the material is being heated or cooled. It is a function of the thermal conductivity, specific heat and density:
K a =
/ ^ .
where: a = thermal diffusivity, K = thermal conductivity, p = density, and Cp = specific heat at constant pressure. The unit of thermal diffusivity is the metre squared per second (mVs).

Thermal properties 279
This definition of thermal diffUsivity gives the impression that it is simply a mathematical factor but, as Hands points out , it is the parameter that relates heat flow to the energy gradient, analogous to thermal conductivity relating heat flow to the temperature gradient.
Thermal diffUsivity is of little interest in many thermal insulation applications, for example civil engineering, where approximately steady state conditions normally exist. However, in rubber processing when temperatures are changing rapidly it is of more value than conductivity.
Reviews of thermal transport properties have been given by Hands ^ and Hands and Hamilton^^ which discuss the general theory and also describe a number of test methods.
3.1 Thermal conductivity
The methods of measurement of thermal conductivity can be divided into steady state methods and transient methods. Traditionally, steady state methods were most widely used as they are mathematically more simple, but because, particularly for materials of low conductivity, they can be very time consuming and involve expensive apparatus, non-steady state or transient methods have been developed. These can have experimental advantages once the much more difficult mathematical treatment has been worked out.
Steady state methods are usually based on parallel plate geometry, although coaxial cylinders are also suitable. The unguarded hot plate apparatus is a development of Lee's disk first described in 1898 and beloved of school physics laboratories for many decades. The general arrangement is shown in Figure 14.1.
Test piece
Heat source Heat sinks
Test piece
Symetrical about the centre line
Figure 14-1. Unguarded hot plate
Two identical test pieces are placed either side of an electrically heated source, and sandwiched between two heat sinks. To help ensure that the temperature is even, the surfaces of the plates are made of a high conductivity metal such as copper, brass or aluminium. The heat sinks are
280 Physical testing of rubber
kept at constant temperature, for example by circulating liquid from a constant temperature bath, whilst a known power level is applied to the heat source. To reduce heat losses from the exposed edges, the apparatus is enclosed in a low conductivity material. When a steady state has been reached, the temperature drop across the sample is measured with thermocouples and the conductivity calculated from:
AA0
where q = rate of heat flow, x the test piece thickness, A the test piece area and AG the temperature drop. In the guarded hot plate, the heat source is surrounded by a guard heater with an independent power supply. The guard heater is kept at the same temperature as the heat source so that all the heat from the heat source flows normally through the test pieces and the losses from the edges come only from the guard heater.
The thermal conductivity of solid rubbers is of the order of 1-2 x l'^ W/mk which is in the region of fairly low conductivity where experimental errors due to heat loss will be greatest. A heated disc procedure or unguarded hot plate is satisfactory for some purposes, particularly if thin test pieces can be used. However, for the lowest conductivity materials a guarded hot plate is really necessary to give precise results.
There are no ISO standards at present for polymers. However, a series of methods are being developed in TC 61 for conductivity and diffusivity of plastics. At the time of writing there are drafts for general principles, laser flash method, temperature wave analysis method and the Gustafsson method. The general principles draft is a bit misleading as it appears to deal only with transient methods, and the specific procedures so far drafted appear to have been selected at random from the many transient methods available.
There is a steady state method for thermal insulation using a guarded hotplate in ISO 8302^^ and a heat flow meter method in ISO 8301^^ Methods for measuring large elements of buildings using the guarded and calibrated hot boxes are given in ISO 8990^ .
BS 874 covers conductivity methods for materials in general. This standard is in a somewhat unusual state in that, whilst the base standard remains, it has partially been replaced by numbered parts, and some of these parts have been further replaced by ISO methods for building products. The original standard^^ contains a wide range of thermal insulating terms as well as test methods. Part 1 ^ gives an introduction, definitions and principle. The classic steady state methods, guarded hot plate and the unguarded hotplate.

Thermal properties 281
were in Parts 2.1 and 2.2, respectively, but these have been superceded by BS EN 12664^^ BS EN 12667^ and BS EN 12939^^ for thermal performance of building materials and products. They all specify the guarded hotplate and a heat flow meter, hence the unguarded hotplate is no longer covered. Part 3 of BS 874^ ' ^ deals with methods apphed to large elements, for example walls, using the guarded and calibrated hot boxes. A guarded hot plate procedure is also given in BS 4370^^ for foams.
The ASTM guarded hot plate method for insulating materials in general is CI77^^ and the heat flow meter apparatus is given in C518^ . The use of the hot box apparatus for building elements is in C1363^^ All of these methods are similar to the ISO equivalents. A further development of the hot plate using a thin heater is given in ASTM CI 114 \ whilst the use of either a guarded hot plate or a thin heater apparatus in single sided mode is described in C 1044^1
Sombatsompop and Wood^ have described a development of Lee's disk using one test piece enclosed in a ceramic housing ring and the whole apparatus operated in a vacuum chamber, which they used to measure conductivities of a plastic from 40 to 400^C. The housing ring allows measurements to be made through both the solid and liquid phases, which is of great value when studying polymers at processing temperatures. An enclosed method of measuring conductivity described by Hands and Horsfall " also allowed measurements in the molten state and eliminated heat losses from exposed edges of the test piece by enclosing the heat source and test pieces inside the heat sink.
A semi-automatic heat meter apparatus was described by Howard et al ^ and a guarded heat flow meter by Foreman^ . Calibration of heat flow meter apparatus has been discussed by Lackey et al ^ and Scott and BelP^.
ASTM D2214^^ describes a quasi steady state method primarily for leather but which can also be used with rubber. A thin test piece is held between a heat source and a copper block heat sink, with the heat source held at the temperature of boiling water. The change in temperature of the heat sink is monitored and plotted against time on log linear paper. Conductivity is obtained from the slope of this plot.
The coaxial cylinder geometry has the advantage of low heat loss from the ends by having a large length to diameter ratio. However, there is a problem of error due to it being very difficult to make the test piece fit accurately. This is not the case with a molten polymer and such apparatus has allowed measurements on polymers under pressure" .
In transient methods, it is usually thermal diffusivity that is obtained directly but there are circumstances where both conductivity and diffusivity are contained in the heat equation, and it may be possible to eliminate

282 Physical testing of rubber
diffusivity from the solution. This means that there is overlap between methods of relevance here and those in the next section.
A common transient method is the line source technique, and such an apparatus was developed by Lobo and Cohen" ^ which could be used with melts. Oehmke and Wiegmann" ^ used the line source technique for measurements as a function of temperature and pressure. A hot wire parallel technique" ^ yielded conductivity and specific heat from the same transient, and then diffusivity was calculated. Zhang and Fujii"*" obtained conductivity, diffusivity and the product of density and specific heat from a short hot wire method.
A procedure based on an inverse method" ^ has been presented that measures conductivity and specific heat, with the temperature measurements being made in metal blocks. It is said to be suitable for measurements as a function of pressure. Both conductivity and diffusivity were obtained by a transient technique from real and imaginary parts of the experimental transfer function"* . A method involving finite element analysis was used to measure conductivity of truck tyre compounds" , while a comparative method using a reference material of known conductivity was developed for use in the laboratory or in the field" . Sourour and Kamal" ^ gave a method involving the velocity of heat waves across the test piece.
It is also possible to measure conductivity with DSC apparatus " . Khanna et al ^ describe different procedures, whilst Simon and McKenna^^ used temperature modulated DSC. A procedure using modulated DSC has been standardized in ASTM El952^1
A comparison of guarded hot plate, transient plane source and modified hot wire methods has been made " using polyurethane foam, and the strengths and weaknesses of the techniques discussed,
3.2 Thermal Diffusivity
Diffusivity is actually rather easier to measure experimentally than conductivity in transient conditions because it is only necessary to measure the change in temperature with time at three points in the material, whereas conductivity needs knowledge of the heat energy. However, the mathematical treatment required for non-steady state measurements is relatively complicated.
Despite the importance of diffusivity in transient conditions, it received much less attention than conductivity until relatively recent times and standard methods are few and far between. For data used in the study and prediction of flow and processing properties, diffusivity is in fact now more often measured than conductivity but, nevertheless, diffusivity is still

Thermal properties 283
relatively infrequently considered in the literature and measurements are made in a very small number of laboratories.
The principles of several approaches to measurement have been explained by Hands^ . As mentioned in the previous section, several methods are in the process of being standardized for plastics but there does not appear to be any ISO standards for diffusivity published. However, there is an ASTM standard for diffusivity of solids in general using the flash method^^ Also as mentioned in the previous section, diffusivity can be calculated from conductivity, and this is specifically mentioned in ASTM E1952^l
Shoulberg^^ developed a linear heating method in which one surface of the test piece is made to follow a linear rise in temperature and, after a time, the temperature difference between the surface and the centre becomes constant. An apparatus using the Angsrom method was described by Gehrig et al '' which works on the periodic heating principle whereby the surface of the test piece is subjected to a sinusoidal temperature profile. Interestingly, they seemed more interested in calculating conductivity from the diffusivity measurements.
Hands and Horsfall ^ developed a method based on the continuous heating principle. Their improvements to this apparatus were not published but further development was reported by Smith^ . The apparatus allowed measurements of molten polymers and accuracy was helped by measuring the change in thickness of the sample during the test.
The laser flash method has been used by Foreman^^ and by Agari et al , the latter considering the effect of test conditions and sample size on accuracy. Papa et al * developed a prototype apparatus that operated with step-down temperature perturbations and could be used with molten samples.
Apparatus to measure diffusivity of rubbers with thick fillers and reinforcement, including steel and fibres, has been described^ ' ^ and a novel method for polymer melts using forced Ralyleigh light scattering " was claimed to be very accurate. Jany and Mingstein^^ used an apparatus which gave conductivity, diffusivity, so called heat penetration coefficient and thermal capacity for solids with poor conductivity.
4. SURFACE HEAT TRANSFER COEFFICIENT
The surface heat transfer coefficient can be defined as the quantity of heat flowing per unit time normal to the surface across unit area of the interface between two materials with unit temperature difference across the

284 Physical testing of rubber
interface. If there is no resistance to heat flow between the surfaces then the transfer coefficient is infinite.
It is immediately apparent that in many processes involving rubber heat flow across the interface between two surfaces has to be considered. This is true in mixing, moulding, cooling after processing and conditioning of test pieces but, nevertheless, very little attention has been paid to the measurement of the coefficient. The effect of the heat transfer coefficient on net heat flow is greatest with thin articles and where one of the materials is a gas. It is probably reasonable to assume a value of infinity for the transfer coefficient when rubber is pressed into intimate contact with a metal but in other cases it will be finite.
Very little data is available on the measurement of heat transfer coefficient. Hands'^ mentions the empirical nature of the coefficient and the numerous factors which will affect its value, particularly between rubber and a fluid. Griffiths and Norman^^ calculated the heat transfer coefficients for rubbers in air and water. Hall et al ^ investigated the effect of contact resistance on steady state measurements of conductivity.
REFERENCES
1. Brazier D W. Rubber Chem. Technol., 153, 3, 1980. 2. Kamik A B, Shinde P. Rubber Asia, 12,6, 1998, p78. 3. Richardson M J. Polym. Test., 4,2-4, 1984, pi01. 4. Sauerbrunn S, Zemo M. Rubb. World, 229,4 2004, p36. 5. Leckenby J. Brit. Plast. Rubb., May 1995, pl6. 6. Sauerbrunn S R, Crowe B S, Foreman J A, Reading M. Antec, New Orleans, 9-13* May
1993, Proceedings Vol. I,pl014. 7 Turi E A (Ed.). Thermal Characterisation of Polymeric Materials, Vol. 1 and 2, Academic
Press, San Diego, 1997. 8. ISO 11357-1,1977. Plastics - Differential scanning calorimetry - General principles. 9. Hands D. RAPRA Technical Review, No. 51, February 1970. 10. Hands D in Handbook of Polymer Testing, Brown R (Ed.), Marcel Dekker, New York,
1999. 11. ASTM C351,1999. Standard test method for the mean specific heat of thermal insulation. 12. Griskey R G, Hubbell D O. J. Appl. Polym. Sci., 12, 1968, p853. 13. Richardson M J. Plast. and Rubb. Mats, and Appl., 1, No. 3-4,1976. 14. ASTM El269, 2004. Standard test method for determining specific heat capacity by
differential scanning calorimetry. 15. Hands D. Rubb. Chem. and Tech., 50,480,1977. 16. Hands D Hamilton A. Prediction of Flow and Cure in Polymers, Shawbury, 1988,
Proceedings, pi 1-7. 17. ISO 8302, 1991. Thermal insulation - Determination of steady state thermal resistance
and related properties - Guarded hot plate apparatus. 18. ISO 8301, 1991. Thermal insulation - Determination of steady state thermal resistance
and related properties - Heat flow meter apparatus.

Thermal properties 285
19. ISO 8990, 1994. Thermal insulation - Determination of steady state thermal transmission properties - Calibrated and guarded hot box.
20. BS 874, 1973. Determining thermal insulating properties with definitions of thermal insulating terms.
21. BS 874 Part 1, 1986. Introduction, definitions and principles. 22. BS EN 12664, 2001. Thermal performance of building materials and products.
Determination of thermal resistance by means of a guarded hot plate and heat flow meter methods. Dry and moist products of medium and low thermal resistance.
23. BS EN 12667, 2001. Thermal performance of building materials and products. Determination of thermal resistance by means of a guarded hot plate and heat flow meter methods. Products of high and medium thermal resistance.
24. BS EN 12939, 2001. Thermal performance of building materials and products. Determination of thermal resistance by means of a guarded hot plate and heat flow meter methods. Thick products of high and medium thermal resistance.
25. BS 874-3.1, 1987. Methods for determining thermal insulating properties. Tests for thermal transmittance and conductance. Guarded hot box method.
26. BS 874-3.2, 1987. Methods for determining thermal insulating properties. Tests for thermal transmittance and conductance. Calibrated hot box method.
27. BS 4370, Part 2, 1993. Methods of test for rigid cellular materials. 28. ASTM CI77, 2004, Standard test method for steady state heat flux measurements and
thermal transmission properties by means of the guarded hot plate apparatus. 29. ASTM C518, 2004. Standard test method for steady state thermal transmission properties
by means of the heat flow meter apparatus. 30. ASTM C1363, 1997. Standard test method for the thermal performance of building
assemblies by means of a hot box apparatus. 31. ASTM CI 114, 2000. Standard test method for steady state thermal transmission
properties by means of the thin heater apparatus. 32. ASTM CI044, 2003. Standard practice for using a guarded hot plate apparatus or thin
heater apparatus in the single sided mode. 33. Sombatsompop N, Wood AK. Polym. Test., 16,3, 1997, p203. 34. Hands D and Horsfall F. J. Phys. E. Scientific Instruments, 8, 687, 1975. 35. Howard J F, Coumou K G and Tye R P. J. Cell. Plast, 9, 5, 1973, p226. 36. Foreman P J. Polytherm 90, Windermere, 1990, Paper 8. 37. Lackey J, Normandin N, Marchand R, Kumaran K. J. Thermal Insulation, 18, October
1994, pl28. 38. Scot J A, Bell R W. J. Thermal Insulation, 18, October 1994, pl46. 39. ASTM D2214, 2002. Standard test method for estimating the thermal conductivity of
leather with the Cenco-Fitch apparatus. 40. Gobbe C, Bezin M, Gounot J, Dehay G. J. Polym. Science: Polymer Physics, 26, 4, 1988,
p857. 41. Lobo H, Cohen C. Polym. Engng. Sci., 30, 2, 1990, p65. 42. Oehmke F, Wiegmann T. Antec94, San Francisco, 1-5* May 1994, Proceedings Vol. 2,
p2240. 43. Dos Santos W N, Gregorio R J. Appl. Polym. Sci., 85, 8, 2002, pl779. 44. Zhang X, Fujii M. Polym. Eng. and Sci., 43, 11,2003, pl755. 45. Sridhar L, Roman M, Narh K A. Antec 99,2-6** May 1999, Proceedings Vol. 2, pl828. 46. Boudenne A, Ibos L, Gehin E, Candau Y. Journal of Physics D, 37, 1,2004, pl32. 47. Ghoreishy M H R, Naderi G. Iranian Polymer Journal, 10, 5,2001, p315. 48. Bomberg M T, Muzychka Y S, Stevens D G, Kumaran M K. J. Thermal Insulation, 18,
October 1994, pi 63.

286 Physical testing of rubber
49. Sourour S and Kamal M R. Polymer Engng. Sci., 16,7, 1976, p480. 50. Sircar A K and Wells J L. Rubb. Chem. Technol., 55, No. 1, 1982. 51. Khanna Y, Taylor T, Chomyn G. Polym. Engng. Sci., 28, 16, 1988, pl034. 52. Simon S L, McKenna G B. Antec 98, Atlanta, 26-30* April 1998, Proceedings, Vol. 2,
p2042. 53. ASTM El952,2001. Standard test method for thermal conductivity and thermal
diffusivity by modulated temperature differential scanning calorimetry. 54. Canney B, Dixon C, Mathis N. Polyurethanes Expo 2001, Columbus, 30* September-3''''
October 201, Proceedings p71. 55. ASTM El461, 2001. Standard test method for thermal diffusivity of solids by the flash
method. 56. Shoulberg R H J. Appl. Polym. Sci., 7, 1597, 1963. 57. Gehrig M, Gramespacher H, Innerebner F, Meissner J, Tomka I. Kunststoffe German
Plastics, 81,8, 1991, p30. 58. Hands D and Horsfall F. Rubb. Chem. and Tech., 50,253, 1977. 59. Smith D I. Ph.D. Thesis, University of Bradford, 1987. 60. Agari Y, Ueda A, Nagai S. J. Polym. Sci. Polym Phys., 33, 1, 1995, p33. 61. Papa J, Albano C, Bare W, Navarro O, Galarraga D, Zannin F. European Polymer Journal,
38, 10,2002,p2101. 62. Mohammad J, Milan B, Jan S, Julius A. Slovak Rubber Conference, Puchov, 20-2 T May
1996, Proceedings p329. 63. Juma M, Bafmec M. Journal of Reinforced Plastics and Composites, 19, 13, 2000, pi 024. 64. Venerus D C, Schieber J D, Iddir H, Guzman J D, Broerman A W. Journal of Polymer
Science: Polymer Physics Edition, 37, 11, 1999, pi069. 65. Jany P, Mingstein F. Kunststoffe German Plastics, 82, 9, 1992, p54. 66. Griffiths M D, Norman R H. Rapra Members Journal, July/August 1976, p87. 67. Hall J A, Ceckler W H, Thompson E V. J. Appl. Polym. Sci., 33,6, 1987, p2029

Chapter 15
EFFECT OF TEMPERATURE
Distinction can be made between the short term and long term effects of temperature. In general, short term effects are physical and reversible when the temperature is returned to ambient, whilst the long term effects at elevated temperature are mostly chemical and not reversible. The long term chemical effects are usually referred to as the results of ageing.
All physical properties of rubber vary in the short term when the temperature is changed, some to a greater extent than others. Throughout this book the need has been emphasised to measure properties over a range of temperatures in order to fully characterise the material. In principle, almost any property could be used to monitor the general temperature sensitivity of a rubber but obviously some properties are more satisfactory than others. In practice, the simpler mechanical tests are frequently chosen to give experimental simplicity, but these are not necessarily the most sensitive. It is most sensible, where possible, to monitor the properties which are most relevant to the service applications, and this principle also applies when measuring the ageing effects of long term exposure. The British standard for acquisition and presentation of multi-point data for rubbers^ is largely concerned with data obtained as a function of temperature. Various methods of thermal analysis, as mentioned in Chapter 14, are a particularly efficient way of scanning properties over a range of temperatures. Particular types of test for the short term effect of temperature which require individual comments are thermal expansion, the detection of glass transition point, and low temperature tests, the last subject also including longer term tests for measurement of crystallisation.

288 Physical testing of rubber
1. THERMAL EXPANSION
The coefficients of linear and volume expansion are defined respectively as:
I dl o ^ SV a- p =
I dT V dT
where: 1 = length, V = volume, and T = temperature. For an isotropic and homogeneous material the coefficients are related by
p = 3a. In practice, an average value of the expansion coefficient over a given
temperature range is often taken. This is the case in crude measures of mould shrinkage (see Section 3.5 of Chapter 7) where expansion, or rather contraction, of the rubber is the main contribution to the property measured.
The coefficient of linear expansion can be measured as an average over tens of °C to reasonable precision using a precision cathetometer. Most contact methods of measuring length are not suitable because of the low stiffness of rubber and, for the same reason, it is often necessary to support the test piece in a horizontal position. A convenient procedure is to lay a test piece on smooth rollers in a glass-sided bath, but it must be emphasised that only moderate precision can normally be obtained, unless an extremely sensitive optical measuring device is employed, and friction can never be eliminated.
The classical method for volume expansion is to use a liquid-in-glass dilatometer. The test piece is placed in a chamber and covered with a known mass of liquid. As the temperature is raised, the increase in volume is detected by the rise of the liquid up a graduated capillary, and the expansion of the rubber can be deduced after making corrections for the expansion of the liquid and container, etc. Such a method was specified for plastics in ASTM D864 but that was withdrawn as long ago as 1988. A detailed account of the dilatometer technique has been given by Bekkedahl^. Although the dilatometer method is essentially simple and can yield very precise results, in practice great care has to be taken in calibrating and operating the apparatus. The procedure is somewhat lengthy and, if a cathetometer is used to follow the level in the capillary, tiring for the operator. Automatic dilatometers and thermodilatometers have been devised using various 'transducers' to measure the capillary height. This probably explains why the ASTM method did not survive.
An interesting review of methods of measuring the thermal expansion of polymers has been given by Griffiths^. This, naturally, covers dilatometers and various methods for detection of length changes but, in addition, methods measuring pressure change rather than length, the use of capillary

Effect of temperature 289
rheometers and the use of thermomechanical analysers are discussed. Linear expansion is classically measured using a quartz tube dilatometer
and there is a method for plastics in ASTM D 696" , although it is doubtful whether it would work well for soft rubbers. A useful point made in this standard is that the measured expansion will include any effects such as loss of moisture or relief of stresses.
Thermodilatometry is a particular case of thermomechanical analysis in which change in a dimension is monitored as a function of temperature under negligible load and, normally, measures the linear coefficient of expansion. It has become the most usual method and there is an ISO standard for plastics^. A British standard is identical, published as BS ISO 11359-2. ASTM has a TMA method for materials in general^ and also a formal procedure for the calibration of the analysers^. The absence of methods specifically for rubber reflects the relatively small interest in the property in the industry.
Although rubber isn't mentioned, El-Tonsy^ developed an apparatus for use with soft non-self-supporting polymers in which the creep effect of a straightening force is compensated for. Adhesively bonded strain gauges were used by Long^ on liquid crystalline polymer, a method which could perhaps be applied to rubbers. The very highest accuracy methods using interferometry are probably of little interest to rubbers but a method can be found in ASTM E289^ .
2. TRANSITION TEMPERATURE
A crystalline solid will melt when heated and this change of state is known as a first order transition, and is accompanied by a discontinuous (step) change in density and heat content. A second order transition is one in which these 'primary' properties do not show a step change but their rate of change with temperature alters abruptly. This is illustrated diagrammatically in Figure 15.1. Rubbers show such a transition temperature when changing from the glassy state to the rubbery state.
The glass transition (Tg) is also marked by a large change in modulus; as the temperature is decreased the material loses its rubber-like characteristics, passes through a leathery state near the transition temperature and becomes a hard brittle glass. Other physical properties, mechanical, thermal and electrical, change by various degrees at the glass transition and, hence, there are potentially a number of different properties which can be monitored to obtain the transition temperature. In Chapter 9, the interdependence of temperature and frequency was briefly discussed; increasing frequency is equivalent to decreasing temperature. Consequently, the measured Tg will depend on the frequency of the test used, a 'fast' test yielding a higher Tg

290 Physical testing of rubber
than a 'slow' one. Furthermore, the measured Tg will depend on the heating or cooling rate if temperature is changed continuously and, in any case, a gradual transition will often be seen rather than the idealised sharp transition shown in Figure 15.1.
VOLUME
2nd ORDER TRANSITION
TEMPERATURE
Figure 15-1. First and second order transitions
For materials generally, change in expansion (or density) by dilatometry was traditionally the most often used method for measuring Tg. Thermal properties, for example specific heat, are also widely used, particularly the methods of differential thermal analysis^ \ A method for rubbers using DSC is being developed in ISO TC 45 as ISO 22768, but is not yet published. The inflection point on the heat input - temperature curve is usually obtained automatically by the analyser's software but, if obtained manually, is best found from the derivative of the curve.
Measuring Tg by mechanical methods is usually done with the dynamic methods, as discussed in Chapter 9, but estimates could be made from the standardised low temperature tests discussed in the next section. Indeed, these tests have been the most widely used to study the low temperature behaviour of rubbers although the transition temperature is not specifically derived. Occasionally, electrical methods have also been used.
Parizenberg et al ^ derived Tg from both compression and tension recovery type mechanical methods for a number of polymers as a function of strain. They found a tendency for Tg to increase slightly at higher strains.
Effect of temperature 291
3. LOW TEMPERATURE TESTS
With reduction of temperature, rubbers become stiffer until finally becoming hard and brittle, and also recovery fi:om an applied deformation becomes more sluggish. The point of becoming hard and brittle is the glass transition as discussed in the previous section. Any physical test can be made at sub-normal temperatures and for particular purposes it will be desirable to follow changes in, for example, tensile strength, dynamic modulus, resilience, or electrical resistivity as the temperature is lowered. Largely for practical convenience, a number of specific low temperature test procedures have evolved for measuring these general trends in behaviour and have been widely standardised.
These low temperature tests can be grouped as follows: Rate of recovery (set and retraction) Change in stiffness Brittleness point
In addition, some rubbers, for example natural rubber and polychloroprene, stiffen at low temperatures by partial crystallisation. This is a gradual process continuing over many days or weeks and is most rapid at a particular temperature characteristic of each polymer, for example -25' C for natural rubber. Hence, tests intended to measure the effect of crystallisation must detect changes in stiffness or recovery after periods of'ageing' at a low temperature.
3.1 Recovery Tests
The most straightforward way to measure the effect of low temperatures on recovery is by means of a compression set or tension set test. Tests in compression are favoured and a method has been standardised internationally. The procedure is essentially the same as set measurements at normal or elevated temperatures and has been discussed in Chapter 10, Section 3.1. As the recovery of the rubber becomes more sluggish with reduction of temperature the dynamic loss tangent becomes larger and the resilience lower (see Chapter 9), and these parameters are sensitive measures of the effects of low temperatures. Procedures have not been standardized, but rebound resilience tests are inherently simple and quite commonly carried out as a function of temperature. It is found that resilience becomes a minimum when the rubber is in its most leathery state and rises again as the rubber becomes hard and brittle.
A particular form of recovery test developed as a measure of low temperature behaviour is the so-called temperature-retraction test (TR test) which is standardised internationally as ISO 2921^^ The test consists of stretching a dumb-bell test piece, placing it in the stretched condition in a

292 Physical testing of rubber
bath at -70°C and allowing it to retract freely whilst the temperature is raised a 1°C per minute. The temperatures are noted at which the test piece has retracted by 10%, 30%, 50% and 70% of the applied elongation and these temperatures designated TRIO, TR30, etc.
A suitable form of apparatus is shown in Figure 15.2. The upper test piece clamps are counterbalanced to give a small stress of between 10 and 20 kPa on the test pieces, and it is essential that the cord and pulley systems are virtually friction free. The upper clamps can also be locked in position after the test pieces are stretched and while they are cooled to the starting temperature. The standard makes no mention of any automatic heater control to raise the temperature at PC per minute but this is desirable if not essential.
Cord
Heating device (dip heater) for coolant
Replaceable scale
Upper part of upper JX'test piece holder
Locking device for upper test piece holder
Container for coolant Upper test piece holder
Test piece
Lower test piece holder
Figure 15-2. Temperature retraction apparatus
In its original form, the test is a trifle crude but more modern versions have been developed*" . At the time of writing, a revision of ISO 2921 is at an advanced stage which decreases the tolerance on the measure of recovery. This will, in principle, improve the accuracy of the method, although the

Effect of temperature 293
limit in the past was more likely to be due to crudely built apparatus. Errors in using a simple scale for length measurement are much reduced when the results are taken from a graph.
The identical test is also standardised as BS903:Part A29* and a very similar procedure is in ASTM D1329^ . With such an ad hoc method, it is essential that the details of procedure given in the standard are followed to achieve good interlaboratory agreement. The ISO and BS methods are identical and the ASTM appears to have no really significant differences, but all allow different elongations and ISO 2921/BS903 note that different elongations may not give the same results.
The method does not seem to be very popular nor considered very precise in the USA and Britain but it is given rather more importance in Scandinavia.
3.2 Change in Stiffness
Although torsional tests are little used to measure stiffness at ambient temperature, they have proved very convenient for measuring the change of stiffness as temperature is reduced. Originally, a Clash and Berg type of apparatus was used with the torque to twist the test piece being provided by a system of weights, cord and pulleys, but current standards favour the Gehman apparatus with torque provided by a torsion wire. The main advantage of this type of test over, for example, a tensile test, is that the apparatus is relatively simple and cheap, with an integral, liquid filled, low temperature bath and can readily acconmiodate several test pieces at once.
The Gehman test is standardised in ISO 1432 ^ and the apparatus is shown diagrammatically in Figure 15.3. A strip test piece is held in two clamps, the lower one fixed and the upper one being capable of being attached to a stud at the bottom of a torsion wire. The top of the torsion wire is fixed to a torsion head which can be turned through 180°. A pointer attached to the bottom of the torsion wire moves over a protractor to indicate the degree of twist. In most apparatus, the test pieces and clamps are contained in an insulated bath with a liquid heat transfer medium cooled by solid carbon dioxide but the standard also allows a gaseous transfer medium. A liquid gives a quicker approach to temperature equilibrium but it must be ascertained that it does not have any effect on the rubber under test. The first measurement is made at 23 °C by moving the torsion head quickly through 180° and noting the pointer reading after 10 sec. A torsion wire is selected from the three different stiffnesses specified to give a reading of between 120° and 170°. The temperature is then adjusted to the lowest level desired and measurements made either at 5°C intervals with increasing temperature or in step changes at 5 min. intervals with a ramp increase of l°C/min, from which a graph of angle of twist against temperature can be drawn. Only one

294 Physical testing of rubber
test piece is shown in the diagram but most apparatus holds several test pieces with means of attaching the torsion head and wire to each test piece in turn. An editorial amendment in 2003 clarified that with multiple test pieces all of them are to be measured within 2 min at each step.
Pointer Torsion wire
Protractor
Test piece clamps
Test piece
Figure 15-3. Gehman apparatus
The relative modulus at any temperature is the ratio of the torsional modulus at that temperature to the torsional modulus at 23°C and the results can be expressed as the temperatures at which the relative moduli are 2, 5, 10 and 100 respectively. A table is given in the standard to save calculation. Alternatively, the apparent torsional moduli can be calculated from:
l6Kl{lS0-a)
bd^jua
where: K = torsional constant of the wire (Nm), 1 = free length of test piece (m), a = angle of twist of the test piece (degrees), b = width of test piece (m), d = thickness of test piece (m), and |j. = a factor based on the ratio b/d. A table of values of \i for various ratios of b/d is given in the standard.
This is the same relationship, but different symbols have been used, as given in Chapter 8, Section 7.3 for torsional modulus tests and in Chapter

Effect of temperature 295
10, Section 3.2 for dynamic torsional tests. The factor K(180 - a ) is the applied torque.
Although in theory this method gives an absolute measure of shear modulus, the actual result is dependent on details of the procedure and G is best regarded as an apparent torsional modulus. Among the factors which influence the result are the time between applying the torque and reading the angle of twist and the introduction of even small amounts of tensile strain. Interlaboratory variability with torsion tests is sometimes disappointing and tends to be worse for modulus results than for modulus ratios and, for this reason, specifications have tended to prefer the ratio method of presentation.
The interlaboratory differences can be particularly high, and the reasons not easy to identify, if different types of torsion apparatus are used. It is, therefore, not advisable to compare results from the standardised Gehman apparatus with, for example. Clash and Berg type instruments as used for plastics.
The Gehman test is also standardised in BS903:Part A13^^ and ASTM D1053^ . The British Standard is identical to the international method but the ASTM has a rather different layout as it covers coated fabrics as well as rubbers and a single point procedure is added for routine inspection. It only specifies a step temperature change procedure.
The most obvious simple measure of stiffness, hardness, has in the past not often been used at low temperatures because of experimental difficulties due to icing up of the moving parts of the apparatus. There were no real fundamental reasons why this problem could not be overcome and suitable apparatus is now available, although low temperature hardness tests seem to be mostly restricted to the detection of crystallisation (see Section 3.5).
A three point loading flexural procedure using dead weights to obtain Young's modulus at low temperatures was given in ASTM D797 but this was withdrawn in 1994. This is one way of making use of a relatively simple apparatus to measure stiffness, and a somewhat similar approach has been taken by some workers using deformation in tension. When measures of stiffness in tension or compression are required, then the standard methods for these properties can be used with a temperature controlled chamber on the tensile machine, the only disadvantage being the higher cost of the test equipment.
One approach using deformation in tension is worthy of note. When the deformation at low temperatures is applied repeatedly the apparent modulus becomes lower until an equilibrium level is reached. Eagles and Fletcher^^ described a 'dynamic' low temperature test in which the test piece is continuously cycled in tension and the force monitored so that both initial and equilibrium moduli can be calculated. Furthermore, tests could be made at different applied strains. This method could undoubtedly provide more comprehensive precise data but, despite claims of better reproducibility, it was not adopted as a standard method, principally because it involved rather

296 Physical testing of rubber
more expensive apparatus than, for example, the Gehman test, and was not a multi-station apparatus. In one sense it was a simple dynamic thermal analyzer and, nowadays, it does seem surprising that the Gehman apparatus has not been replaced by an analyzer method.
Deformation in compression, or a mixture of bend and compression, is quite often used very successfully in ad hoc tests on complete products, for example rubber bellows. Care must be taken when formulating product tests using simple and inexpensive apparatus that such 'details' as the rate of application of the force or the dwell time before noting deflection are carefully standardised because these can have a large effect on the result obtained.
3.3 Brittleness Temperature
Perhaps the most simple approach to measuring the low temperature behaviour of rubbers is to find the temperature at which it has become so stiff as to be glassy and brittle. The main disadvantage of this approach is that only one facet of low temperature behaviour is measured and that is at a point where, for many purposes, the rubber has long since become inadequate for its job. Nevertheless, brittleness temperature has been found to be a useful measure and innumerable ad hoc brittleness tests have been devised. These tests usually take the form of quickly bending a cooled strip of rubber and are almost inevitably very operator dependent and do not define the strain rate or the degree of strain precisely. Hence, they show poor between-laboratory variability.
The best known of the bending tests using a simple jig was probably the method at one time standardised as ASTM D736. The test consisted of bending a strip between two platens and in its original form air was specified as the heat transfer medium, but more often a liquid bath was used in practice. Because of the simplicity of apparatus, it is still occasionally referred to under the D736 number even although this was discontinued in 1967.
A more satisfactory method of measuring brittleness point, although still an arbitrary method, is that standardised in ISO 812^\ A strip test piece, held at one end to form a simple cantilever, is impacted by a striker as shown in Figure 15.4. The test piece can be either a strip or a T50 dumb-bell with one tab end removed. The critical dimensions are the test piece thickness, which is given as 2±0.2 mm in each case, and the distance between the end of the grip and the point of impact of the striker. The striker radius is specified as 1.6±0.1 mm and the clearance between the striking arm and the test piece clamp is 6.4±0.3 mm. With these tolerances, the maximum surface strain in the test piece is held to almost ±10% and, with the velocity of the striker controlled to between 1.8 and 2.2 m/sec, the rate of straining is constant to

Effect of temperature 297
about ±20% at worst, which will give adequate reproducibility for most purposes.
Test piece
1// r Clamp
[J Figure 15-4. Low temperature brittleness test; broken lines show position of striker and test
piece (assumed unbroken) after impact
Several different forms of the apparatus have been produced. If a pendulum or weight falling under gravity is used there is a possibility that the striker will be slowed up on first contacting the test pieces (it is usual to test four strip test pieces at the same time) and the standard suggests that at least 3 J of energy per test piece is needed. It is not made clear, but this figure of 3 J probably refers to the larger strip and one would expect less energy to be satisfactory for the T50 test piece. The most satisfactory form of apparatus is, perhaps, a powerful electric motor to continuously drive the striker and the test pieces moved into its path by a solenoid.
The heat exchange medium may be liquid or gaseous with the tolerance on temperature control given as ±0.5^C, which is not particularly easy to achieve with simple apparatus.
By impacting test pieces at a series of temperatures the brittleness temperature can be found as the lowest temperature at which none of the specimens tested failed. Failure is defined as the occurrence of any crack, fissure, hole or complete breakage visible to the naked eye. For specification purposes, it is usual to test at a given temperature and record a pass or fail judgment.
A revision of ISO 812 is being developed in which an alternative measure termed 50% brittleness temperature is included. This is the temperature at which 50% of test pieces fail and is claimed to be more

298 Physical testing of rubber
reproducible. This measure is specified for plastics and was in the original ASTM method but was not used in the first British and ISO methods because it used more test pieces. The revision also tidies up the document editorially and rationalizes the number of test pieces used, which is 5 for brittleness temperature and 10 for 50% brittleness. It has been reported that the temperature at which a test piece breaks can be affected by the clamping pressure used and a torque figure is suggested in the draft revision.
The British version of the test, BS 903:Part A25^^ is identical to the ISO standard. Both were originally based on ASTM D746^^ which is designated for testing 'plastics and elastomers', whereas the ASTM method which should be used on rubbers is 02137 " which covers 'flexible polymers and coated fabrics'. These two ASTM methods are different and their titles are confusing. However, D2137 specifies apparatus, test pieces and procedure effectively in agreement with the present ISO 812. It seems to be an interesting case of circular development - starting with D746, via BS 903 and ISO 812 and back home as D2137. Give a couple of years and the circle will be complete if the temperature for 50% failure given in D746 is accepted for rubber.
3,4 Comparison of Methods
As the previous sections have shown, there are a large number of low temperature tests in existence. Even when ad hoc bending tests are disregarded, together with the use of the normal range of physical tests, such as tensile modulus and resilience, and the automation of a mechanical test by thermal analysis, there remain several types of specially developed low temperature tests. The various tests do not all have equal relevance to a given product. A test, or tests, should wherever possible, be chosen to provide the information most relevant to the particular application, but for many quality control purposes a test is used simply as a general indication of low temperature behaviour. Whatever the relative merits of the different methods in any situation, the question of correlation between the methods is frequently asked.
A comparison between torsional modulus, 'dynamic' stiffness, retraction and brittleness which covers seven rubbers has been reported by Boult and Brown^^ They found that the ranking of compounds was not always the same for all the tests but these results give a good general guide as to how the tests compare. Markova^^ also tested seven rubbers using brittleness, retraction, hardness and torsional tests and presented very detailed results showing the effects of time on hardness results and elongation on retraction. He found good linear correlations between brittleness point and TRIO, and brittleness and TIO (Gehman), and reasonable linear correlation between modulus (hardness) and modulus (Gehman T2) and TIO and TRIO. This

Effect of temperature 299
work was effectively repeated (or reported again) by Prazakova and Markova^ . Kawamura et al ^ also give correlations, including those between standard tests and a leakage test on seals and a flexing test. Kucherskii et al ^ go to considerable lengths to analyse the reasons why the apparent modulus measured in a Gehman test is dependent on the test conditions and makes a limited comparison with Russian standard methods in tension and compression. The brittleness and retraction methods have been compared with German standard dynamic methods by Englemann^^ who also investigated the effect of filler, softener and hardness on the low temperature properties of natural, nitrile and polychloroprene rubbers. Results for 15 compounds by the Gehman and temperature retraction tests are compared with results from a hybrid of the two, a 'twist recovery' test, by Wilson^ Spetz^^ reviewed low temperature tests and gave figures for reproducibility of some of the standard methods which showed that compression set was particularly bad.
Differences in results can occur between tests in a hquid and a gaseous medium. This is often because different times are required to reach equilibrium temperature, and if crystallisation is occurring, for example, the stiffness will be dependent on time of conditioning. It is also essential that if a liquid medium is used the liquid does not affect the rubber by swelling it or removing extractables, as either process can have a considerable effect on low temperature behaviour. Ethanol is most widely used but acetone, methanol, butanol, silicone fluid and n-hexane are all suggested in ISO 2921. Not all of these will be suitable for all rubbers and the suitability of any proposed liquid must be checked by preliminary swelling tests.
3.5 Crystallisation
In principle, any of the low temperature tests can be used to study crystallisation effects by conditioning the test pieces at the low temperature for much longer times than is usual. In fact, most of the standard methods include a clause to the effect that the method can be used in this way. In the temperature retraction test, it is suggested that the greater degrees of applied elongation are used when the effects of crystaUisation are to be considered, because crystallisation is more rapid in the strained state.
It would appear that the common standard low temperature tests are not thought totally suitable for measuring effects of crystallisation because a hardness tests has been standardised for this purpose, even although hardness tests are not so commonly used for measuring the immediate effect of low temperature. The international method ISO 3387^^ and the British method BS 903:Part A63 ' are the same and are applicable to unvulcanised as well as vulcanised rubber. This is probably one reason why the hardness test has been introduced because the other methods would not be satisfactory
300 Physical testing of rubber
with an unvulcanised compound. The unvulcanised materials often have very low hardnesses at the beginning of the test and the standards take account of the fact that the values after exposure may be in a different hardness range than at the beginning (see Chapter 8, Section 4) by stipulating that the same range (instrument) should be used throughout. Results may be presented as the hardness increase in a given time or the time for the hardness to increase half-way to its final, equilibrium value.
In the hardness increase method for measuring effect of crystallization, the rubber is in the unstrained condition. For rubber in the strained state, it would seem reasonable to suppose that the retraction or compression set methods could be adopted with longer exposure times. A method has been standardised as ISO 6471^^ which operates in compression, but this uses much greater degrees of compression than are usual and requires a special apparatus. This method is derived from a Russian standard and essentially involves measuring recovery from low strain and from high strain, the degree of crystallisation being deduced from the difference between the two. It has the dubious distinction of being the only international physical test method for rubber on which both the UK and USA abstained.
4. HEAT AGEING
Heat ageing of rubber is taken to mean the effect of elevated temperatures for prolonged periods but heat ageing tests are carried out for two distinct purposes. First, they can be intended to measure changes in the rubber at the (elevated) service temperature or, secondly, they can be used as an accelerated test to estimate the degree of change which would take place over much longer times at normal ambient temperature. The degree to which accelerated tests are successful in predicting long term life at ambient temperature is highly debatable but, nevertheless, single point accelerated tests are very widely used in specifications to give an indication of ageing performance.
4.1 Standard Exposure Tests
The international standard for heat ageing is ISO 188 ^ which specifies two air oven methods and an oxygen bomb method. The principle is simply that prepared test pieces are aged for a given period at a given temperature and then tested for whatever physical properties have been selected, and the results compared to those obtained on unaged test pieces. The standard does distinguish the two purposes for which ageing tests are carried out and warns of the difficulties and dangers of predicting room temperature performance from accelerated tests. It recommends that physical properties concerned in

Effect of temperature 301
the service application are used to monitor ageing but suggests tensile properties and hardness in the absence of any specific information.
In the oven methods, the test pieces are exposed to air at atmospheric pressure in either the usual single chamber type of oven or a multi-cell oven. The advantage of a multi-cell oven is that, by placing one compound only in each cell, there is no danger of migration of plasticisers, etc. from one material to another. If a single chamber oven is used, only very similar compounds should be heated together. With either type of oven there must be a steady flow of air through the oven giving between 3 and 10 complete changes of air per hour and no copper or copper alloys which may accelerate ageing should be used in the oven construction. Because oxygen is being used up in ageing processes, it is important that the air flow is maintained and also that the rubber is exposed to air on all sides. Two air oven methods are given. In method A, the air velocity depends on the air exchange rate only, whereas method B uses a cabinet oven with a fan giving forced air circulation of between 0.5 and 1.5 m/s.
A revision of ISO 188 has been proposed to add a variation on the forced circulation oven where air enters the chamber from the sides and the test pieces are rotated on a carrier.
The temperature of test is left for the product or material standard to specify but 70°C or lOO^C are those most commonly used for general purposes. The length of test is chosen to be in accordance with ISO 471 (now ISO 23529), which is 1, 3, 7, 10, or a multiple of 7 days, but the advantage of ageing for a series of times and constructing a graph of property level against time is not mentioned.
In the oxygen bomb method, test pieces are exposed to oxygen at above atmospheric pressure and at elevated temperature but, otherwise, the procedures are the same. The specific conditions of 70°C and 2.1 MPa pressure are given. Although the use of a high pressure speeds oxygen diffusion and, hence, helps to ensure uniform oxidation, the increased acceleration of oxidation reduces the probability of the artificial ageing correlating with natural ageing.
The British Standard is identical and published as BS ISO 188. The need to control the air exchange rate has been appreciated for a long
time but Royo^^ found that even within the range of 3 - 10 air changes per hour differences in degree of degradation could occur. Others have focused on the effect of air change and air velocity. Spetz^ , in a study of reproducibility of ageing tests, demonstrated that the air velocity is very important and can account for differences between typical cell and single cabinet ovens. Spetz^^ and Bille and Fendel" ^ have considered the important factors and the design of air ageing ovens. It is as a result of these investigations that the current standard distinguishes between the two types of oven. Mitsuhashi et al" ^ demonstrate the convenience and accuracy of measuring air flow with a meter, and also the use of a filter on incoming air

302 Physical testing of rubber
to avoid pollution. It is clearly essential that the ageing temperature is accurately controlled and that its spatial distribution is considered. Some examples are given by Spetz^^ and, considering the rule of thumb that reaction rate doubles with lO^C rise in temperature, even one degree could be significant.
ASTM finds need for four separate heat ageing tests. ASTM 0573" ^ is an air ageing method using a single chamber oven with mechanical air circulation and is, hence, similar to the parts of the British and ISO Standards which deal with this type of oven, but differs appreciably in the description of the apparatus. Such differences in detail of oven construction which affect air flow can cause significant differences in ageing performance. Only standard tensile stress strain tests are specifically covered as measures of degree of deterioration and, perhaps because of this, there is no discussion of the effect of oxygen diffusion rate and test piece thickness. The nearest ASTM method to the ISO and British multi-cell oven is 0865" ^ which exposes the specimens in test tubes which are in turn placed in a heat exchange medium. This results effectively in a very restrictively described, simple multi-cell apparatus but without the air flow past the test pieces being adequately specified.
An oxygen bomb procedure is given in ASTM D572' ' which uses the same standard conditions of 70°C and 2.1 MPa as in ISO 188. An air bomb method, which is perhaps a logical compromise between oxygen pressure and atmospheric air, is given in ASTM 0454"*^ The standard conditions of 125°C and 0.55 MPa must give a high degree of acceleration and a lower temperature might be more appropriate for many purposes.
The ISO and the ASTM oxygen method and the ASTM air pressure method call for the pressure to be released slowly at the end of the exposure but ISO does not point out that this is to avoid porosity. Presumably, in the worst case it could be a test for explosive decompression.
4.2 Monitoring degradation
It is necessary to appreciate that the degree of degradation seen will vary with the property used to monitor the ageing. As with tests to measure the short term effect of temperature, ideally, the properties most relevant to service should be used to monitor the effect of ageing, but sensitivity to the degradation, reproducibility, cost, relation to fundamental changes at the molecular level and general applicability are also relevant. In practice, the simpler mechanical tests are most often used as a matter of convenience.
Heat ageing is not normally carried out in a vacuum or an inert atmosphere but in air or oxygen so that the ageing effect is caused by a combination of heat and oxygen. At high temperatures, the rate of oxidation of the rubber may be faster than the rate of oxygen diffusion so that uneven

Effect of temperature 303
degradation occurs and, hence, it is undesirable to compare results from test pieces of markedly different size and shape. The diffusion limited oxygen effect is illustrated in Figure 15.5 and is most important when attempting to make predictions from accelerated tests. In test pieces other than thin sheet, the effect will be very large at higher temperatures.
c
'x
O
O
+-' a:
Depth from surface
Figure 15-5. Limitations of oxygen diffusion
An indirect way to monitor degradation is by using chemical analysis (chemists might consider it the only direct approach). An outhne of techniques is given in a review of long term and accelerated ageing" .
Another indirect method is to measure the uptake of oxygen. It has to be assumed that all the oxygen absorbed is being used to cause degradation, and correlation with mechanical property change is generally only successful with similar compounds. The technique is certainly very sensitive, as demonstrated by Wise et al'*'', and a derivative procedure has been used recently" . A further indirect approach is to measure induction time by DSC, as is done for polyolefms.

304 Physical testing of rubber
More detailed discussion of monitoring degradation is given in the ageing review mentioned above^^ and in a book devoted to assessment of useful life of rubbers" .
4.3 Stress Relaxation
Obtaining multi-point ageing data is very time consuming. In addition, there is uncertainty as to the value of the simpler mechanical properties in relation to service performance and variability is increased by the use of separate test pieces for each point in the time and temperature sequence. Stress relaxation measurements in tension show some promise as a general guide to ageing performance by reducing or eliminating some of these difficulties. These measurements should not be confused with the stress relaxation measurements in compression used to study sealing force (see Chapter 10, Section 2).
The concept of using tension stress relaxation measurements to investigate rubber networks which are undergoing chemical changes was originated by Tobolsky et al ' ^\ The measurement consists basically of monitoring the stress in a sample whilst subjecting it to an ageing procedure, usually accelerated. There are two variants of the technique, continuous relaxation in which the sample is held stretched throughout the test and intermittent relaxation in which the sample is stretched only periodically for short times to enable measurements to be made.
Under suitable conditions when viscous flow is not dominant, it has been proposed that the reactions within the rubber network may be related to stress changes as follows.
The decay of stress in continuous relaxation measurements provides a measure of the degradative reactions in the network whilst intermittent relaxation measures the net effect of both degradative and crosslinking reactions. In the continuous measurement, any new networks formed are considered to be in equilibrium with the main network and do not impose any new stress.
The intermittent measurements are, in effect, a measure of the change in stiffness with time, with the advantage over the standard tensile measurements that low strains more compatible with service conditions are used, very thin test pieces eliminate the effect of rate of oxygen diffusion and the same test piece is used for all measurements at a given temperature. The technique is attractive but experimentally fairly difficult and interpretation of the result is generally far from easy, as was demonstrated by Brown et al . Normally, relaxation measurements are made at the ageing temperature but Brown et al. suggested a more simple test in which intermittent modulus measurements can be made at ambient temperature whilst ageing takes place at elevated temperature. This procedure enables

Effect of temperature 305
tests to be made without specialised and expensive relaxation apparatus, but is likely to have a penalty of greater variability. Stress relaxometers for use in a cell oven have been produced commercially but their cost has been a deterrent and whether one is still available for intermittent measurements is uncertain. A miniature stress relaxometer using a strain gauge stress measuring device was developed^^ which could be used in a gas absorption apparatus so that the relaxation could be related to the oxygen absorbed during degradation. A novel approach is described by Othman and Hepbum ' which uses simple trigonometry to calculate stresses from a three point bending configuration.
There is an international standard, ISO 6914^^ which covers both the continuous and intermittent procedures plus the simplified intermittent method. Strip test pieces are used, 1 mm thick to minimise oxygen diffusion effects. Measurement at a series of temperatures is recommended and results are presented in graphical form but no consideration is given to interpretation. British Standards did not accept this revision of ISO 6914 and BS 903 Part A52^^ is identical to the 1985 ISO method. The revision was not accepted in the UK because mistakes in handling comments resulted in inconsistencies. As an example, the title is now stress relaxation but a note says that this term is avoided!
Many studies of tensile stress relaxation measurements have been reported but the majority have been concerned with continuous relaxation and, particularly, the practical difficulty of distinguishing between physical and chemical relaxation, for example the work of Aben^ . Salazar et aF^ give results and predictions for a fluoroelastomer. They compensate for physical relaxation by making measurements at low temperatures where chemical relaxation is negligible and, via the time-temperature superposition technique, subtracting the physical component from their high temperature resuhs. To fully describe ageing behaviour, intermittent relaxation measurements would seem to be necessary to take account of crosslinking as well as degradative reactions. Very interesting results are given by Thomas and Sinnot ^ where predictions are obtained for the rate of change of tensile modulus at room temperature by both stress relaxation and conventional oven ageing, the mechanical testing being done at the ageing temperature. Clamroth and Ruetz^^ made a careful study of the value of intermittent relaxation measurements with particular reference to antioxidant evaluation in which they demonstrate the reproducibility of the method and make a comparison with conventional ageing techniques and practical experience. It is possible to make simultaneous measurements of continuous and intermittent relaxation and comment on the procedures is given by OYQ^\

306 Physical testing of rubber
4.4 Correlation with Natural Ageing
Thermal ageing is a principle factor in the lifetime of rubbers which is critically important for virtually all products. Consequently, there is a vast amount of literature on how estimates of service life can be obtained from heat ageing tests
The main use of such standards as ISO 188 is for quality control when the details of apparatus requirements and procedure must be observed to obtain good reproducibility. It is a fact, acknowledged in most standards, that no universal correlation between accelerated tests and natural ageing has been found. Even when heat ageing tests are used to simulate high temperature applications, correlation may not be good unless care is taken to align test piece geometry, air flow and pressure, and relevant tests are chosen to monitor changes. When the standard procedures are used to estimate performance at elevated temperatures or even, rather hopefully, to predict long term room temperature performance, the situation is, to say the least, far from certain. It is necessary to obtain multi-point data as a function of time of ageing and at a series of temperatures. A model is then fitted to the data to allow extrapolation. The subject of prediction techniques for rubbers has been dealt with in detail in Practical Guide to the Assessment of the Useful Life of Rubbers" ^ and only the basic procedures relevant to thermal tests will be considered here.
There are two stages to modelling the degradation process:-Obtaining a function for the change of the parameter(s) of interest with time. Obtaining a function for the rate of change of the parameter(s) with the level of the degrading agent.
Using these relationships, the change in the property for longer times and lower levels of the degrading agent can be predicted. Clearly, the success of the process is critically dependant on the validity of the models used. Whilst a number of models applicable to polymers have been known for a long time, they are in practice relatively infrequently applied and the majority of accelerated durability tests carried out are used on a comparative basis only. There are a number of reasons for this, not least that there is a lack of evidence for the universal validity of the models and the behaviour found for many materials is very complicated. It is also a fact that the generation of data over sufficient times and levels of temperature is an extremely time consuming and expensive process.
The only procedure to have been standardised generally is application of the Arrhenius relation (see below). lEC 216 ^ is a guide to evaluating the thermal endurance of electrical insulating materials and ISO 2578^^ applies the same principle to determining time/temperature limits to plastics. In both cases, the accent is more on finding maximum service temperatures rather than extrapolating to normal ambient temperature. Use of the same

Effect of temperature 307
Arrhenius relationship has more recently been standardised for rubbers " and the latest version of this standard also includes the application of time-temperature superposition. An amendment was progressed almost as soon as the standard was published because, again, mistakes were made in handling the drafts and comments, which resulted in errors in the standard. The corrected version was published in 2005.
The change in parameter with time may take several forms and the form may vary with the level of the temperature as well as with the parameter chosen. Indeed, using too great an acceleration resulting in changing the degradation mechanism and, hence, the rate of change, is a common pitfall. The difference in degree of change with different monitoring parameters should also be emphasised and the best practice is to use properties of direct relevance to service.
The easiest form to handle, a linear relationship, is unfortunately not very common because of the compHcating effect of a number of factors. In some cases it may be possible to transform a curve to linear form, for example by taking logarithms, or a relatively simple relation can be found to fit. With composite curves, it may be justifiable for the end purpose intended to deal only with one portion. A power law can be apphed to describe compression set of rubbers^^ over a limited range but if modelling is required to higher levels of set it is necessary to use an exponential or logarithmic function which is self limiting between 0 and 100%. A relation found useful at Rapra is:
1 + 1 -
where t is time, a and b are constants for a particular material. It is common practice when similar materials are being compared to
ignore the shape of the curve and to take the time for the property to reach some percentage, say 50%, of its initial value. This may be expedient but is clearly less satisfactory that modelling the curve and could be extremely misleading if materials with substantially different curves are compared. If a time/temperature shift method is used to model the effect of temperature (see below) no function to describe the change of property with time need be assumed.
When the form with time has been established and a suitable measure to represent that form selected, the relation with the level of the temperature is needed to allow extrapolation to the service level. Generally, measures need to be made at several levels to establish a model with reasonable confidence. Typically, five levels are considered satisfactory but it should be noted that

308 Physical testing of rubber
when extrapolation is to be made over several decades of time the uncertainty of the prediction will be large even if the measured data looked very consistent. Estimates of uncertainty should always be made.
It is feasible to make an empirical fit to a graph of change against level although it can be dangerous to do this with no theoretical justification. In cases with multiple degrading agents and, hence, a complicated relation, it could be the only option but, normally, an established form with theoretical justification is fitted if possible.
The best known and most widely used model is the Arrhenius relationship:
i^(r) = exp| " ^ RT
Thus:
\nK{T) = — ^C RT
where K(T) is the reaction rate for the process, E is the reaction energy, R is the gas constant, T is absolute temperature and A and C are constants.
A plot of InK(T) against 1/T should yield a straight line with slope E/R which can, with caution, be extrapolated. In the example shown in Figure 15.6, the property parameter has been plotted against time at three temperatures, and the reaction rate taken as the time for the property to reach a given threshold value or end of life criterion (yl).
In Figure 15.7, the log of reaction rate (time to threshold value in this example) has been plotted against the reciprocal of absolute temperature to give the Arrhenius plot. The best fit to the Arrhenius plot can be found by the least squares method and extrapolated to find the time (tu) to the threshold value at a temperature of interest. To obtain an estimate of the maximum temperature of use, extrapolate the line to a specified reaction rate or time to reach a threshold value. 20,000 or 100,000 hours and 50% change as the threshold value are commonly used for establishing a general maximum temperature of use.
The temperature at which the threshold is reached in (usually) 20,000 hours is called the Temperature Index (TI) in ISO 2578. The Relative Temperature Index (RTI) is a comparative value with a reference material. The HIC is the halving interval - the temperature change needed to halve the time to the end point from TI. MCUT is the Maximum Continuous Use Temperature which is normally based on 100,000 hours. One criticism of MCUT and similar measures is that the changes in properties are made at

Effect of temperature
ambient temperature rather that at the operating temperature.
309
t3 t2 ^ Time (t)
Figure 15-6. Change of property with time at three different temperatures
1/T3 ^fT2 1/T1 1/Tu Reciprocal of temperature
Figure 15-7. Arrhenius plot

310 Physical testing of rubber
There are occasions when the Arrhenius equation does not give a straight hne and, hence, there is clear indication that predictions from it will not be valid. An alternative expression which has improved the line in certain cases is:-
' 10
where KQ is the reaction rate at a reference temperature TQ. Imposed stress will alter the rate of degradation and relations have been
proposed which predict that the log of failure time will be proportional to stress as well as to the inverse of temperature. The form of relation is:
t = tQ exp E-scr
kT
where t = time to failure, to = atomic vibration period (10" ^ s), E = activation energy, s = structure coefficient, a = stress, k = Boltzman's constant and T = temperature.
An alternative to constructing the Arrhenius plot log(K) against 1/T is to shift the plots of parameter against time along the time axis to construct a master curve. Use can be made of the Williams, Landel, Ferry (WLF) equation:-
log(a,)= ' '(^-5)
where a = shift factor, c and c are constants and T = reference T ' 1 2 0
temperature. The shift factors to align the plots at different temperatures with the plot
for the chosen reference temperature are determined and then these are fitted to the WLF equation to find the constants. The equation can then be used to predict the response at service temperatures. The principle of constructing a master curve is illustrated ion Figure 15.8 and the plot of log Uj, against temperature in Figure 15.9. More details of fitting the WLF equation and possible problems with a discontinuity in the relation are considered in reference 49.
This technique has the advantage that no particular measure of the reaction rate has to be chosen nor any form assumed for the change of parameter with time, but it can only be used if the curves at different temperatures are of the same form. An analytical-numerical procedure to
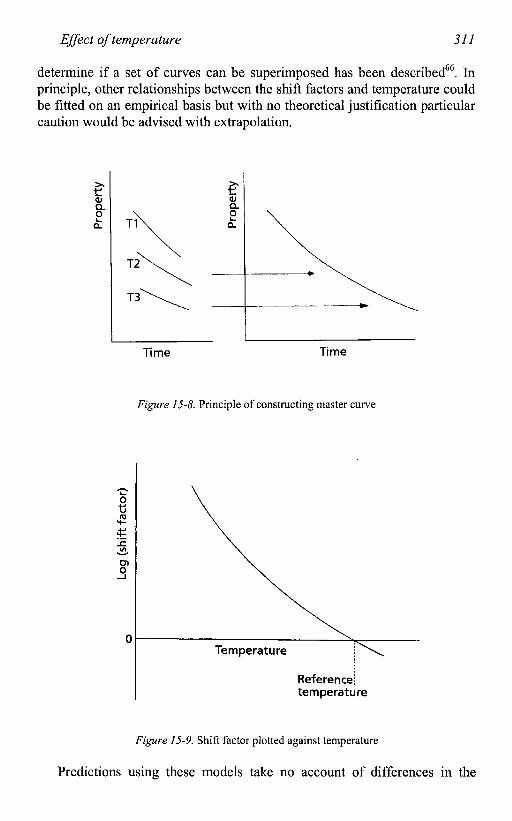
Effect of temperature 311
determine if a set of curves can be superimposed has been described^ . In principle, other relationships between the shift factors and temperature could be fitted on an empirical basis but with no theoretical justification particular caution would be advised with extrapolation.
Q. O a.
1 ^ ^ ^ ^ "-
Q. O
Time Time
Figure J 5-8. Principle of constructing master curve
Reference! temperature
Figure 15-9. Shift factor plotted against temperature
Predictions using these models take no account of differences in the

312 Physical testing of rubber
oxygen diffusion situation in the test pieces compared to the product and this can have an enormous effect on service performance^^. Prediction of the oxidised layer is discussed by Verdu^^ and oxygen profihng methods by Nelson and Hepbum^ . Some profiles obtained by microhardness measurements on naturally aged samples have been given by Brown and Soulagnet .
One difficulty when investigating the correlation between natural and accelerated ageing is the necessity to obtain the natural ageing data over a very long period of time. Probably the largest long term programme covered 19 rubbers stored for 40 years in 3 different climates with changes monitored by a range of physical tests^^ Accelerated aging tests were made on remixes of the 19 rubbers plus 20 new compounds and predictions made by both Arrhenius and WLF methods^ . The tests on the 19 compounds with natural ageing results for comparison are a fine demonstration of the difficulties of making predictions from accelerated tests. This huge project also included accelerated weathering and ozone tests^ .
Discussion of the problems of extrapolation and some examples are presented by Le Huy and Evrard " . Mandel et af have given results for five rubbers in which elongation at break was used as the measure of degradation. An Arrhenius plot of accelerated test data appears to be in good agreement with natural ageing results up to 8 years. In such comparisons the natural ageing results are from 'shelf ageing', i.e. only the effect of oxygen and temperature are considered and the rubbers protected from light and other weathering effects during storage.
Bergstrom^ ' ^ gives comparison of single point accelerated tests with outdoor exposure and also considers the merits of using the product of tensile strength and elongation at break as the measure of change. Dlab and Kontry^^ suggest that elongation is the best measure to take. They describe an alternative procedure to an Arrhenius plot for predicting changes at lower temperatures but do not make comparisons with natural ageing. The Japanese Rubber Technology Committee conducted a 15 year out door exposure trial and made time /temperature shifts to compare with accelerated tests^ . The paper by Gillen et al is a rare example of considering the effects of mechanical strain^ .
Gillen et al ^ give an example where non-Arrhenius behaviour could be demonstrated with activation energy varying with temperature. Recent investigations of correlations between accelerated and field ageing of tyres have been given by Baldwin et al ' ^ The same group also made comparisons of used tyres retrieved from SUV/minivan vehicles and the spare tyres from the same vehicles using three different measures " .

Effect of temperature 313
REFERENCES
1. BS 903-4, 2003. Acquisition and presentation of multi-point data.
2. Bekkedahl I. Research, NBS, 42 RP2016, August 1949, p.l45. 3. Griffiths Marion D. RAPRA Members Journal, July 1974, p. 187. 4. ASTM D696, 2003. Standard test method for coefficient of linear thermal expansion of
plastics between -30^C and 30^C with a vitreous silica dilatometer. 5. ISO 11359-2, 1999. Plastics - Thermomechanical analysis - Determination of coefficient
of linear thermal expansion and glass transition temperature. 6. ASTM E831, 2003. Standard test method for linear thermal expansion of solid materials by
thermomechanical analysis. 7. ASTM E2113, 2004. Standard test method for length change calibration of
thermomechnical analysers. 8. El-Tonsy M M. Polym. Test., 22, 1, 2003, p57. 9. Long V K. ANTEC 98, Atlanta, 26-30*' April 1998, Proceedings, Vol. 2, pi570. 10. ASTM E289, 2004. Standard test method for linear thermal expansion of rigid solids with
interferometry. 11. Burfield D R and Lim K L. Macromolecules, 16, No. 7, 1983. 12. Parizenberg M D, Bukhina M F, Zuev Yu S, Kucherskii A M. Int. Polym. Sci. Technol.,
6,9, 1979, pT104. 13. ISO 2921, 1997. Determination of low temperature characteristics - Temperature-
retraction procedure (TR test). 14. Spetz G. IRC 2000, Helsinki, 13-15 '' June 2000, Proceedings, paper 44. 15. BS903, Part A29, 1997. Determination of low temperature characteristics - Temperature-
retraction procedure (TR test). 16. ASTM D1329, 2002. Retraction at lower temperatures (TR Test). 17. ISO 1432,1988. Determination of stiffness at low temperature (Gehman test). 18. BS903, Part A13, 1990. Method for determination of the stiffness at low temperature. 19. ASTM D1053, 1992 (2001). Stiffening at low temperatures. 20. Eagles A E and Fletcher W. ASTM Sp. Publn. 553, Symposium Philadelphia, PA, June
1973,p.l04. 21. ISO 812, 1991. Determination of low temperature brittleness. 22. BS903, Part A25, 1968. Determination of low temperature brittleness. 23. ASTM D746 1998. Brittleness temperature of plastics and elastomers by impact. 24. ASTM D2137, 1994 (2000). Brittleness point of flexible polymers and coated fabrics. 25. Boult B G and Brown R P. RAPRA Members Journal, Oct. 1974. 26. Markova L, Int. Polym. Sci. and Tech., 12, No. 2, 1985. 27. Prazakova M, Markova L. Int. Polym. Sci. & Tech., 19, 6,1992, p T/23. 28. Kawamura T, Kanayama N and Harashima N. Int. Polym. Sci. and Tech., 7, No.l, 1979. 29. Kucherskii A M, Fedyukina L P and Gleizer L G. Kauchi i Rezina, No. 10,46,1975. 30. Englemann E. Kaut. U. Gummi Kunst., 25, 11, 1972, p538. 31. Wilson A. Rubber World, April 1967, p.81. 32. Spetz G. Polym. Test., 9,1,1990, p27. 33. ISO 3387,1994. Determination of crystallisation effects by hardness measurements. 34. BS 903:Part A63, 1995.Crystallisation effects by hardness measurements. 35. ISO 6471,1994. Determination of crystallisation effects under compression. 36. ISO 188, 1998. Accelerated ageing and heat resistance tests. 37. Royo J. Polym. Test., 3, No. 2, 1982. 38. Spetz G. Polym. Test., 13, 3, 1994, p239. 39. Spetz G. Polym. Test, 15,4, 1996, p381.

314 Physical testing of rubber
40. Bille H, Fendel H. ACS Rubber Div. Meeting Denver, May 18-21 1993, Paper 67. 41. Mitsuhashi K, Shinohara A, Suga S. Polym. Test., 14,4, 1995, p381. 42. ASTM D573, 1999. Deterioration in an air oven. 43. ASTM D865, 1999. Deterioration by heating in air (Test tube enclosure). 44. ASTM D572, 1999. Deterioration by heat and oxygen. 45. ASTM D454, 1999. Deterioration by heat and air pressure. 46. Brown R P, Forrest M J and Soulagnet G. Rapra Review Report 110,2000. 47. Wise J, Gillen K T, Clough R L. Polym. Degradation and Stability, 1995,49,403. 48. Zaharescu T,. Polym. Test., 20, 1, 2001, p3. 49. Brown R P. Practical Guide to the Assessment of the Useful Life of Rubbers, Rapra
Technology Ltd, Shawbury, 2001. 50. Tobolsky A V, Prettyman IB and Sillon J H. J. Appl. Phys. 15, 1944, p.380. 51. Tobalsky A V, Andrews R D and Hanson, E.E. (1944) J. Appl. Phys. 17, p.352. 52. Brown, R.P., Morrell, S.H. and Norman R H. J. IRI, 7, No. 4, 1973. 53. MRPRA, Rubb. Dev. 27, No. 1, 1974. 54. Othman A, Hepburn C. Polym. Test., 11,1, 1992, p47. 55. ISO 6914 2004. Determination of ageing characteristics by measurement of stress
relaxation. 56. BS 903 Part A52 1986. Determination of ageing characteristics by measurement of stress
at a given elongation. 57. Aben W J G M. Med. Rubberind 35, No. 2,1974. 58. Salazar E A, Curro J G and Gillen K T. J. Appl. Phys. Sci., 21, No. 6, 1977. 59. Thomas D K and Sinnott R. J. IRI, August 1969, pi63. 60. Clamroth R and Ruetz L. ACS Meeting, Philadelphia, 1982, paper 57. 61. Ore S. J. Appl. Polym. Sci., 25, No. 10, 1980. 62. lEC 60216. Electrical insulating materials. Properties of thermal endurance. In 6 parts 63. ISO 2578 1999. Determination of time-temperature limits after prolonged exposure to
heat. 64. ISO 11346,2005. Estimation of lifetime and maximum temperature of use. 65. Budrugeac P. Polym. Deg. & Stab., 38, 1992, pl65. 66. Heermida E, Povolo F. Polym. J. (Jap.), 26,9, 1994, p981. 67. Malek K A B, Stephenson A. J. Nat. Rubb. Res.,7, 2, 1992, pl26. 68. Verdu J. Int. Polym. Sci. & Tech., 29, 1, 1993, pT/64. 69. Nelson K, Hepburn C. Plast. Rubb. Int., 17,4, 1992, p8. 70. Brown R P, Soulagnet G. Polym. Test., 20,3, 2001, p295. 71. Brown R P, Butler T. Natural Ageing of Rubber, Changes in Physical Properties over 40
Years, Rapra Technolgy Ltd, Shawbury, 2000. 72. Brown R P, Butler T, Hawley S W. Ageing of Rubber, Accelerated Heat Ageing Test
Results, Rapra Technology Ltd, Shawbury, 2001. 73. Brown R P, Butler T, Hawley S W. Ageing of Rubber, Accelerated Weathering and
Ozone Test Results, Rapra Technology Ltd, Shawbury, 2001. 74. LeHuy M, Evrard G. Angew. Makromol. Chem., 261/262, Dec. 1998, pl35. 75. Mandel J, Roth, F L, Steel M N and Stiehler R D. Proc. Int. Rubb. Conf., Washington,
November 1959, p.221. 76. Bergstrom E W. Elastomerics, 109, No. 2, 1977. 77. Bergstrom E W. Elastomerics, 109, No. 3, 1977. 78. Dlab J and Kontry F. Int. Polym. Sci. and Tech., 12, No. 4, 1985. 79. Mitsuhashi K, Kuramiya H. IRC '85 Kyoto, 1985, Paper IL-21. 80. Gillen K T, Celina M, Keenan M R. ACS Rubber Division Meeting, Chicago, 13 ''-16 ''
April 1999, Paper 67.

Effect of temperature 315
81. Gillen K T, Bernstein R, Derzon D K. Polym. Degrad. and Stab., 87, 1,2005, p57. 82. Baldwin J M, Bauer D R, Ellwood K R. ACS Rubber Division Meeting, Akron, 5-8*
October 2004, Paper 30. 83. Baldwin J M, Bauer D R, Ellwood K R. ACS Rubber Division Meeting, Akron, 5-8*
October 2004, Paper 31. 84. Baldwin J M, Bauer D R, Hurley P D. ACS Rubber Division Meeting, Akron, 5-8*
October 2004, Paper 29.

Chapter 16
ENVIRONMENTAL RESISTANCE
Temperature plays a part in all environmental tests but it was convenient to separate into Chapter 15 those tests which are particularly concerned with thermal resistance alone and to consider here the other types o f environment' to which rubbers may be exposed. This includes resistance to liquids and gases other than permeability tests (permeability is covered in Chapter 17).
1. MOIST HEAT AND STEAM TESTS
Judging by the lack of standard test methods, there is not generally great concern over the long term effects of moist heat, although the importance of conditioning at a known humidity for such tests as electrical properties is generally appreciated. However, there are circumstances where the ageing effect of high humidity may be important; Soden and Wake^ found a near doubling of the rate of deterioration of natural rubber by increasing the humidity to 100% in a 70°C air ageing test, and polymers containing hydrolysable bonds (e.g. polyurethanes) can be especially liable to breakdown under humid conditions.
If the effects of humidity are of interest, then tests along the same lines as the heat ageing tests would be used but both temperature and humidity would be controlled. A simple standard method is given in ASTM D3137^ for determining the effect of moisture on tensile strength, it being recommended that a similar dry heat ageing test be conducted so that the effect of humidity can be isolated. The test pieces are suspended above water in a loosely capped container in an oven at 85°C for 96 h. More generally, a range of physical properties could be monitored after exposure and an

318 Physical testing of rubber
injection type humidity cabinet (see Chapter 5) would give a range of humidities up to 100%.
The use of steam at 100°C or above would provide an accelerating effect, although this would probably be considered too severe for most applications. Such a test would, however, be relevant for a product such as hose intended for use with steam and the particular test procedure would be found in the product specification. In designing any tests for exposure to steam it is necessary to control the amount of air (if any) present since oxygen at the temperatures used would have a strong deteriorating action.
2. EFFECT OF LIQUIDS
Tests in which rubbers are exposed to liquids are often called 'swelling tests' simply because the resulting change in volume of the test piece is by far the most commonly used measure of the effect of the liquid. Similarly, the tests are also referred to as 'oil ageing' because standard grades of mineral oil are the liquids most often specified.
Volume change is a very good measure of the general resistance of a rubber to a given liquid, a high degree of swelling clearly indicting that the rubber is not suitable for use in that environment. In addition, the degree of swelling can be related to the state of cure of the rubber, the crosslink density being estimated by use of the Flory-Rehner equation ' ' ^
1 _iog,(i-r,) + r,+//r/
where: Mc = number average molecular weight of network chains, Vr = the volume fraction of rubber in the swollen material, |a = a solvent-rubber interaction constant, p = density of the network and Vi = molar volume of the swelling liquid. The concentration of effective crosslinks is l/2Mc.
This procedure is complicated by the effect of filler and in practice it can be more convenient used as a comparative basis for degree of cure rather than calculating molecular weight. Murgic et al compared the swelling method with other ways of determining degree of crosslinking, while Cholinska and Glijer^ compared swelling with the reticulation method. Faridah et af compared crosslink densities from swelling with those from the Mooney Rivlin constant CI obtained after scragging of the test pieces.
The standardised test procedures are concerned with the resistance of the rubber to the liquid, not the estimation of degree of cure, and generally recommend the measurement of change in dimensions, tensile properties and

Environmental resistance 319
hardness as well as volume change. The action of a liquid on rubber may result in absorption of liquid by the rubber, extraction of soluble constituents from the rubber and chemical reaction with the rubber. Usually, absorption is greater than extraction and an increase in volume results, but this is not always the case. For some products a decrease in volume or dimensions could be more serious than swelling and if there is significant chemical reaction a low swelling may be hiding a large deterioration in physical properties. Consequently, although degree of swelling is a good general indication of resistance, it is important to also measure the change in other properties. Swelling, being relatively simple to measure fairly precisely, is particularly useful as a quality control test. Indeed, its use has been suggested as a very sensitive test for general routine checks on composition^.
In planning an exposure to liquid test there are a number of general points which need to be considered. The degree of volume change with time will, in general, follow the form shown in Figure 16.1 and it is preferable to take several readings to ensure that the full curve is recorded. If only a single time of exposure is used this should not fall on the early part of the curve where the degree of swelling is changing relatively rapidly. The time to reach equilibrium or 'maximum' swelling will increase with increased test piece thickness, in a manner roughly proportional to the square of the thickness. The time to 'maximum' swelling will also be roughly proportional to the viscosity of the liquid.
C Not reached equilibrium
A Equilibrium
Time
Figure 16-1. Time - swelling curves

320 Physical testing of rubber
Curve C of Figure 16. does not show a maximum swelling but a continued slow rise in volume which can be attributed (in natural rubber at least) to oxidation from air not being totally excluded. Particularly at high temperatures, consideration should be given as to whether air is present in the intended application because oxidation is likely to affect mechanical properties rather more than it does swelling. If there is some extraction, the level of swelling may fall slightly before reaching equilibrium, as shown in curve B. If extraction is greater than swelling then the curve would show a reduction in volume, reaching an equilibrium (negative swelling) level.
In Figure 16.2 there are two curves differing in maximum swelling and also in absorption rate. The absorption at M2 could arise from either a high maximum swelling and a slow approach or a lower maximum swelling and a faster approach. This illustrates how misleading a single point measurement taken before equilibrium is reached could be.
Absorption at this point is due to either slow absorption with high maximum or rapid absorption with lower maximum
Time
Figure 16-2. Curves with different maximum absorption
2.1 Standard Methods
The international method for resistance to liquids is ISO 1817* and the current version has been editorially much clarified compared to the earlier edition. Apparatus is specified for total immersion and single sided contact with the liquid; in the latter case a suitable jig is illustrated. There is then a balance for determination of weight and volume change, instruments for measuring dimensions and for area determination by measurement of test piece diagonals. Following general clauses covering choice of liquid, test pieces, conditioning, temperatures and duration of test and the basic procedure, there are clauses for change in mass, volume, dimensions, area ,

Environmental resistance 321
hardness, tensile properties, mass per unit area (for one sided exposure) and determination of extractable matter.
By far the most common measurement is volume change by the gravimetric method which consists of weighing the test piece in air and in a liquid (usually water) before and after immersion and calculating volume change on the basis that volume is proportional to weight in air - weight in water. The test piece should be between 1-3 cm in volume and 2±0.2 mm thick. The thickness is very important, especially if equihbrium swelling is not reached within the time scale of the test, but the other dimensions are not critical.
Care must be taken to exclude air bubbles when weighing in water, and this is helped if a trace of detergent is added and/or the test piece quickly dipped in ethanol before weighing. If the rubber is less dense than water, then a sinker must be used in the same manner as for density measurements (see Chapter 7). The test piece is then immersed in the test hquid for the chosen time at the chosen temperature. At least 15 times the test piece volume of liquid should be used and care must be taken to ensure that the rubber is exposed on all sides to the liquid. This can be done by suspending the test pieces on wires or it is satisfactory to rest them on glass marbles.
After the immersion period, the test pieces are cooled to room temperature, which is best done by transferring them to a fresh portion of the test liquid. Surplus liquid must then be blotted off the surface and yet no evaporation should be allowed. When the test liquid is volatile, it is usual to rapidly transfer the test piece to a tared and stoppered weighing bottle, but if the liquid was, for example, a lubricating oil rather more time can be allowed, and will be needed, for wiping and a weighing bottle is not necessary. After the weighing in air the test pieces are again weighed in water, the transfer being done very quickly if the test liquid is volatile. Alternatively, for volatile liquids, evaporation curves can be plotted by weighing as a function of time and the weight at zero time estimated by extrapolation.
The change of mass is sometimes used as a slightly quicker alternative to volume change as a quality control measure and is simply obtained by weighings in air only.
Volume change can also be calculated from measurement of dimensions but the emphasis in ISO 1817 is on obtaining change in length etc. The method for change in length, width and thickness uses either a quadrilateral test piece with sides between 25 mm and 50 mm or a disk 44.6 mm diameter (internal diameter of tensile ring) with thickness 2 mm in both cases. The dimensions are measured before and after immersion using a dial gauge for thickness and, preferably, an optical system for length and width.

322 Physical testing of rubber
A second dimensional change method monitors the area of a rhomboid shaped test piece by measurement of its diagonals. This method is semi micro, the rhombus usually having sides of about 8mm length and can conveniently be used with very thin test pieces which will reach equilibrium swelling quickly. As originally described^ \ a magnified image of the test piece is projected to enable greater accuracy and convenience of measurement to be achieved. By assuming that swelling is isotropic, i.e. swelling in the thickness direction is equal to that in the other directions, volume change can be calculated from
F = abj
xlOO%
where V = volume change, A and B = lengths of diagonals after swelling and a and b = lengths of diagonals before swelling.
For measurement of change in hardness and tensile properties the exposure procedure is similar to that for volume change, dumb-bells or rings being immersed for tensile measurements and a piece of sheet for micro hardness tests (normal hardness test pieces would take too long to reach equilibrium). The cross section of tensile test pieces is measured before immersion but the gauge length for elongation measurement marked after immersion. This is simply the most convenient practical arrangement, although the calculated results, especially stress at given elongation, are to say the least arbitrary. After removal from the test liquid, it is necessary to wipe off surplus liquid, mark the gauge length and make the test within two minutes. A little practice is needed to achieve this, and a little more time would probably have little effect if the test liquid was not volatile at room temperature. Other properties could of course be measured after immersion and attention is particularly drawn to the stress relaxation measurements considered in Chapter 10 for evaluating performance of seals.
The procedure for exposure of a test piece to a liquid on one side only is applicable to relatively thin sheet materials which are exposed this way in service. A suitable jig is used to contain the liquid and the change of weight measured. The result is expressed as change in mass per unit surface area.
It may be of interest to know the amount of matter which a liquid extracts from the rubber. Despite the fact that neither is very accurate, two procedures are given in the standard: drying the treated rubber to find loss in mass from the original, or drying off the test liquid and weighing any residue. It is difficult to see the value of attempting to standardise this sort of procedure, as it is unlikely to be used in specifications.

Environmental resistance 323
The normal procedure for measurement of change after exposure is to test immediately after removing the test piece from the liquid. However, ISO 1817 does allow the alternative procedure, which cannot be expected to give the same results, of drying the test pieces to constant mass at 40°C and at reduced pressure, recondition at standard laboratory temperature and then test. The question to dry or not to dry should be answered on the basis of the relevance to service and quite possibly both figures would be of interest.
Liquid immersion tests are normally made in the laboratory using thin test pieces. It is worth noting that applying the results to thick products could be misleading because liquids such as typical lubricating oils will take many years to penetrate a few centimeters. For example, engine mountings of a non-resistant rubber perform quite adequately despite being splashed with oil.
The British standard is the same as ISO 1817 and numbered as BS ISO 1817. The general ASTM method for effect of liquids on rubbers is ASTM D471^^. It contains procedures for change in volume and change in mass by volumetric or gravimetric methods similar to the ISO and British methods but the specification of the exposure containers is more restrictive and more emphasis is put on the use of reflux condensers. The procedure for change in dimensions is similar to the first ISO method but an area change procedure is not mentioned. Procedures for double sided exposure, changes in hardness and tensile properties are also similar to the ISO procedures. Measurements can be made after drying and there is also the option of basing tensile calculations on the swollen dumb-bell cross section. The procedures for extractable matter are included and there are additionally procedures for change in properties of coated fabrics.
A second ASTM method, D1460^^ gives procedures for change in length after immersion using a long, relatively thin test piece. This used to be a much more widely standardised method but the volumetric method has proved far more convenient for general purposes. It is not at all clear why two procedures with two designs of apparatus and test pieces of different dimensions are needed, but is presumably a result of standardizing what existed in practice. One advantage of the length change method is that, because measurements can be made through the transparent wall of the container, it can be used with liquids (or gases) under pressure, and this appears to be the main intent of the ASTM standard.
2.2 Standard Liquids
Although for any particular application the liquid to be found in service should be used for testing, it has long been common practice to use standard liquids representative of the various types of liquid to which the product

324 Physical testing of rubber
should be resistant. There is obvious advantage in this approach when considering interlaboratory reproducibihty and quality control generally, particularly as commercial liquids are often not well defined.
The principal standard liquids defined in the international and other standards are the oils, fiiels and service liquids originating fi*om ASTM. It has generally been accepted that the ASTM oils, although defined in the standards, are only really satisfactory if produced by a single source. In Britain, the reference oils as well as the various service liquids specified in ISO 1817 and other standards are stocked by Rapra Technology Limited. Oils 1, 2 and 3 specified in ISO 1817 are the same as those specified in ASTM D471 but ASTM also includes a No. 5 oil which has an aniline point intermediate between oils 1 and 2. Occasionally, the oils have to be resourced and re-specified and that happened in the mid 1990s for oils 2 and 3 because they would have to have been labelled as suspected carcinogens. The new oils are not identical to the old and are called IRM902 and IRM903 respectively, rather than ASTM 2 and 3. An emergency standard was published by ASTM in 1994 as ES 27 which defined the new oils and gave data to enable approximate conversions to be made between results obtained with the old oils and the new oils, but this information is now given in ASTM D5964^^ The conversion factors were intended to be usefial until specification limits were, if necessary, adjusted. After 8 years this is probably all a matter of history.
The standard simulated fuels in ISO 1817 are intended to simulate the range of swelling induced by commercial petroleum derived fuels, and now include some more recently introduced alcohol-containing mixtures. The composition of fuels containing alcohol have varied considerably and it is significant that the ISO and ASTM standard specify different formulations. The traditional fuel mixtures are the same in ISO and ASTM but what is 2,2,4-trimethylpentane in ISO is the familiar old isooctane in ASTM. ISO 1817 specifies a simulated diesel type fuel but ASTM D471 currently specifies commercial diesel. A revision is being considered to change to the ISO material.
Three simulated service liquids are given in ISO 1817 and ASTM D471 to simulate a diester type lubricating oil, and two hydraulic oils, but ASTM D471 also standardises a further three liquids.
2,3 Non-standard Methods
Either for quality control purposes or to estimate degree of cure, a variety of non-standard experimental procedures have been reported. Generally, the intention is to simplify the test, speed up quality control or to use very small non-standard test pieces. An example which has gained acceptance as a

Environmental resistance 325
standard method is the area change procedure described in Section 2.2 above and, indeed, many of the non standard procedures are based on dimensional change. It is not necessary to consider all the procedures here but they have been extensively reviewed by Brown and Jones ^ and for thickness increase measurement by Brown and Hughes .
A thickness measurement method has also been reported more recently by Pope et al ^ and it is also possible to use DMA apparatus to monitor thickness change. Spieglberg^^ does not appear to be familiar with earher work on swelling of rubbers when introducing a new thickness change method for cross linked plastics. Ellipsometry uses reflection of polarised light to measure thickness change and, apparently, can achieve sub nanometer resolution. Ustinova et al ^ produced a multi-test piece version of ASTM D1460 and point out how rapid the length change method is compared with the volumetric procedure.
Rather than measuring thickness change by DMA, a procedure has been described whereby weight change can be monitored by a thermogravimetric analyser^ , and the same approach has been taken using a spring balance plus a CCD camera^ Knoergen et al ^ describe the use of NMR imaging to study the diffusion of a solvent into polymer. Diffusion and sorption depend on any deformation applied to the polymer and a rare example of swelling measurements under uniaxial compression and elongation is found in a paper by Babitskii^l
2.4 Water Absorption
The penetration of water into rubber is very slow compared with most organic liquids and, hence, with the usual test piece for the standard volumetric method, a very long time is required to reach equilibrium. For this reason, a procedure used to be included in BS 903:Part A16 (now BS ISO 1817) for expressing results of total immersion tests as a fraction of the surface area exposed for measurements when equilibrium swelling was not reached, on the basis that absorption is restricted to the surface layers. If the test piece is always standardised to the same dimensions it is not important which method of expression of results is used.
It would be preferable to measure equilibrium absorption and to achieve this in a reasonable time it is necessary to use a test piece with a very large surface area to volume ratio. A standard procedure is given in BS 903:Part AIS '* which uses a test piece composed of small particles which will pass through an 850 |im sieve. The sample can be prepared by cutting, rasping or grinding. Unlike the more conventional swelling tests, the rubber is not exposed to 'liquid water' but to water vapour in a controlled humidity cabinet. There is then no problem of drying the surface of the rubber, which

326 Physical testing of rubber
with small particles would be impossible, but the absorption measured is that relating to the level of humidity during test. Humidities of less than 100% are used because of the virtual impossibility in practice of maintaining exactly 100% R.H. Because of its effect on humidity, it is necessary to control temperature during exposure very closely (especially at higher humidities) and 25 ± 0.2°C is specified in the standard. Reference should be made to Chapter 5 for methods of attaining and measuring given humidity levels.
The standard states that the measured equilibrium water vapour absorption is substantially the same as the equilibrium absorption which would be obtained by immersion in an aqueous solution and which would be in equilibrium with the vapour (apart from effects due to extraction of water soluble constituents), i.e. in a solution which would maintain the test humidity. As this implies, the equilibrium water absorption of rubber is reduced if the water is not pure and this test method, because 100% R.H. is not readily maintained, does not measure the absorption of pure water. When approaching 100% R.H. the effect is rapid and even very small amounts of a salt in solution will significantly lower the equilibrium absorption. Hence, tests intended to simulate the use of rubber in contact with an aqueous solution, rather than pure water, should be made with that solution or with one having the same equivalent relative humidity.
3. EFFECT OF GASES (OTHER THAN OZONE)
In comparison with the effect of liquids on rubber, very little testing is carried out on the effect of gases, with the most notable exceptions of exposure to air or ozone (permeability is considered in Chapter 17). Presumably, this reflects the relatively small number of applications where the effect of gases other than atmospheric oxygen and ozone is important. Exposure to air or oxygen has been covered as regards laboratory tests by heat ageing in Chapter 15. Natural weathering (Section 5 below) includes the effect of oxygen as well as that of sunlight, rain and ozone. Also in Section 5, artificial weathering tests are considered which, again, include the effects of air, light and water. It is apparent that all these environmental effects from heat ageing to artificial weathering are very much interconnected and it is largely for convenience that they have been separated in the present manner.
There do not appear to be any general standard methods for effect of gases, and for any particular gas and product a specialised test would need to be devised. For vapours or gases fairly readily obtainable in the liquid state, the liquid is often used, but for other gases it is necessary to devise ad hoc tests using an exposure chamber through which the gas is circulated. The

Environmental resistance 32 7
main practical difficulty is safely disposing of the used gas if this is toxic or an explosion risk.
Where a rubber is exposed to gas at high pressure, significant quantities of gas will be absorbed. If the pressure is relatively quickly released, the expanding gas can cause cavitation and rupture - the phenomenon generally known as explosive decompression. A detailed review of all the factors involved has been given by Briscoe et aP^ and a study using a fracture mechanics approach made by Stevenson and Morgan^ , which included a test they devised to investigate the effect of pressure on a deliberately introduced flaw. Most investigations have pressurized the actual component in a special test rig.
4. EFFECT OF OZONE
Ozone exists in small quantities in the atmosphere but even levels of less than 1 part per hundred million (pphm) can severely attack non-resistant rubbers if they are in the strained condition. Hence, ozone attack is often the most important effect of exposure to the atmosphere and, not surprisingly, specialised laboratory tests have been developed which are more commonly used than general weathering tests. The effect of ozone is to produce clearly visible and mechanically very damaging cracking of the rubber surface and, although the importance of ozone may seem strange to anyone more familiar with other materials, the resistance of the polymer to ozone is the parameter considered of paramount importance in atmospheric applications involving tensile strains.
The laboratory tests are very much accelerated in that the levels of ozone used are much higher than those existing naturally in most parts of the world. In essence, they consist of exposing strained test pieces to air containing ozone and observing any cracking. In the simplest case, rubbers can be divided into those that will crack and those that do not, but because the common general purpose rubbers fall into the first category vast effort has been expended on finding anti-ozonants etc. which will improve their resistance. The result as regards testing is that much time has been spent on trying to develop precise, reproducible and meaningful test methods. There is the inevitable problem of correlating an accelerated test with natural exposure, such minute quantities of an unstable gas are extremely difficult to measure and control, the observation of cracks is by nature subjective and the pattern of cracking as a function of strain, time and ozone concentration is complex.
Very good standard test methods were established by British Standards in 1963 and by ISO in 1972 but complete revision of these methods to include

328 Physical testing of rubber
standard procedures for measuring the ozone concentration proved to be a long hard struggle. The international standard, ISO 1431, was planned to be in three parts, Part 1 covering static tests. Part 2 dynamic tests and the third part the measurement of ozone concentration. However, after Part 3 was finally published in 2000, Parts 1 and 2 were combined, so we now have ISO 1431-1^^ and ISO 1431-3^1 The British standards are identical and pubhshed as BS ISO 1431-1 and BS ISO 1431-3. The earhest ozone standard was established by ASTM in 1951 and there are now five relevant ASTM methods. D1149^^ is the basic procedure for static exposure in a cabinet, D518^^ is for exposure out of doors, Dl 171^Ms for exposure outdoors or in a cabinet using triangular test pieces, D3395^^ is for dynamic exposure and D4575^^ is for measuring ozone concentration. At the time of writing, it was proposed to combine Dl 149, Dl 171, D518 and D3395 into a single standard under the Dl 149 number.
4.1 Ozone cabinet
This is essentially a closed non-illuminated chamber containing the test pieces at constant temperature and through which ozonised air at a known concentration is passed. The principle is shown in Figure 16.3. It must be constructed of a material such as aluminium which does not decompose ozone. The dimensions of the cabinet are not intrinsically important but the flow rate and velocity of the ozonised air do affect the severity of attack and must be controlled.
Regulator
^Circulation XO ) fan
Flowmeter
Ozonizer
Purifying column
Ozone cabinet
To ozone concentration -T measurement device
•
N^Temperature indicator
Heat exchanger
Figure 16-3. Schematic representation of ozone exposure apparatus

Environmental resistance 329
Suga " suggests that the air flow and filtering system normally used may be inadequate and proposes that improvement to the carbon purifier is needed to exclude all pollutant gases which can interfere with the measurement of ozone concentration. Presumably, this depends on the atmosphere in which the cabinet is housed. They also found that gases could be given off by the rubbers under test which also affect the measured ozone concentration, and a filter in the measuring system is needed so that compensation can be made.
The current ISO and British Standards settle on a preferred gas velocity between 12 and 16 mm/s but ASTM Dl 149 requires any velocity above 0.6 m/s and suggests the use of a fan to achieve this. Cheetham and Gumey^^ demonstrated the dependence of ozone attack on gas velocity but more investigation is necessary. Seeberger^^ concluded that it has not been given sufficient attention in the present test methods. The ISO level is very reasonable for a standard procedure, particularly as it states that for tests intended to be comparable the velocity should not vary by more than 10% but the ASTM conditions can lead to very high velocities and increased severity of attack. Too low a flow rate must be avoided or destruction of the ozone by the test pieces will, at least locally, reduce the concentration. The ISO and British methods now define the flow rate in terms of the test piece area and say that the ratio of area to rate should not exceed 12 s.m'^ ASTM suggests a gas replacement rate of 3/4 cabinet volume per minute.
The ozonised air must be evenly distributed throughout the chamber and the fan in the ASTM cabinet achieves this, but at the expense of an uncontrolled air velocity. Probably, a better procedure is to use a diffiiser at the gas inlet and also to attach the test pieces to a mobile test piece carrier such that each test piece Visits' every part of the cabinet at intervals. Such a carrier is recommended in the ISO standard.
The ozone can be produced by an ultra-violet lamp or a silent discharge tube. The latter is usually necessary if very high concentrations are required but is not as convenient for normal use because oxides of nitrogen are also produced unless the tube is fed with pure oxygen. The nitrogen oxides may affect the degree of cracking and would interfere with chemical methods of measuring ozone concentration. Modem corona discharge devices would seem to be equivalent to silent discharge tubes.
4.2 Measurement of ozone concentration
Most ozone tests are carried out at concentrations in the range 25 pphm to 200 pphm and a very sensitive method is necessary to precisely measure these low levels. The traditional chemical methods rely on the reaction of ozone with potassium iodide to produce iodine, the iodine being estimated

330 Physical testing of rubber
volumetrically by reaction with sodium thiosulphate. There are many variants on this basic method, including different arrangements for passing the gas through the solution, the type of buffer used and different methods for estimating the end point of the titration. These chemical methods are not suitable for continuous monitoring or automatic control and instrumental methods are widely used in practice, notably the electrochemical and UV absorption methods. The former utilises the same basic reaction as the chemical methods but estimates the iodine by change in electric current passing through the iodide solution. All these methods are in theory absolute and do not require calibration.
Unfortunately, the numerous variations on the chemical method, the electrochemical and the UV methods do not all agree and, despite considerable investigation, the problem has not yet been fully elucidated. Here lies the difficulty in reaching agreement on the third part of ISO 1431. It is perhaps interesting to remember that an early 'ozometer' used the decay of stress in a strained piece of rubber to indicate concentration!
There is not space to detail all the theories, experiments and arguments which have been put forward. In earlier standards and draft revisions, variations on the original chemical method due to Crabtree and Kemp^^ were used. In Britain and elsewhere, variations on the electrochemical method of Brewer and Milford^^ became much more commonly used because they are continuous and may be automatic. More recently, the UV instrumental method which has the same advantages has become increasingly popular.
Evaluation and comparison of chemical and electrochemical methods by Brown et al "" ^ firstly concluded that the leading chemical methods of the time read something of the order of 40% higher than the electrochemical procedure. Thelamon" ^ has shown that the UV method also reads lower than the chemical method with the traditional buffer but that results from chemical methods are lowered by changing to a basic acid buffer. These conclusions, generally found also by other workers, led to a swing towards a standard using a basic acid buffer and then to the UV method. Wundrich and Hentrich" ^ made a careful study which led them to conclude that the chemical methods with the original buffer yields the correct figures and also give good reasons for the lower results with other chemical methods and the electrochemical method, but did not explain the UV results!
You may question whether the absolute value of ozone concentration is of importance, it being reproducibility between laboratories and the establishment of a standard that matters. Probably, the main reason why this attitude has not been carried through before now is that it would be logical to settle on an instrumental method as these are used in practice but they are also rather difficult to standardise precisely, being commercial instruments with particular, perhaps arbitrary, characteristics. So, for many years we all

Environmental resistance 331
took enormous care over every aspect of an ozone test, agonised over the effect of air velocity, the time of conditioning and whether or not we could see a crack, whilst probably using a very different concentration to the next fellow.
ISO 1431 Part 3 was finally published in 2000. It is based on the standard calibration principle that which method is used is not important as long as its calibration can be traced to a recognised primary standard. The primary standard recognised by the atmospheric monitoring fraternity, and accepted by the standard, is a UV method. The effective result is that UV is the basic standard proposed but other types are perfectly acceptable if they are suitably adjusted to give the same answer.
ISO 1431-3 specifies that the calibration of the ozone meter is carried out in accordance with ISO 13964" ^ which is the general standard for determination of ozone concentration by UV photometry. The operation of UV meters is also to be in accordance with ISO 13964. The other allowed methods are electrochemical, chemiluminescence and wet chemical. Other instrumental methods are operated in accordance with the manufacturer's instructions (having been calibrated to ISO 13964) whilst the wet chemical methods are given in detail in an appendix. Although not referenced, there is also a general method using chemiluminescence'*' .
The ASTM method^^ is very similar in general content to ISO 1431 with UV being the reference method and other instrumental and wet chemical methods being allowed after calibration.
4,3 Test piece
Ozone only attacks rubber in the strained condition, although with the less resistant rubbers the 'threshold strain' for attack may be very low. The most obvious test piece is a thin strip held in tension between clamps made of a material which does not decompose ozone (Figure 16.4). The elongation is set using gauge marks as the strain near the clamps will be complex. This type of test piece is specified in ISO 1431 and ASTM Dl 149. A variation of this is to add tab ends to the strip to facilitate gripping and this is also included in ISO 1431 but not in ASTM. A particular form, the T50 dumbbell, is the one specified and has the advantage of small size when cutting from products. Stretching tab-ended test pieces is made particularly easy by hooking the ends over suitable frames as illustrated in Figure 16.5. Usually, several test pieces at a range of strains are accommodated on one backing plate.
It is often more convenient with extrusions to wrap them around a mandrel, although the resulting strain is generally less well defined than it is with strips. ASTM D1171^^ is complementary to D1149 and specifically

332 Physical testing of rubber
covers a triangular cross section test piece which may be moulded or extruded and is bent around a mandrel. This test piece will be incorporated into D1149 when the standards are combined. The use of a strip wrapped around a mandrel is no longer included in standards.
©
©
111111111111111111II1
11 1 1111111 11 1111 11 1 1
©
©
1 ll
1 ll
Figure 16-4. Strip test piece
11
H
Figure 16-5. T50 test piece
It is generally desirable to expose test pieces at a number of different strains. The small T50 test pieces are economical when this is the case but, in theory at least, it would be advantageous to have a form of test piece

Environmental resistance 333
which covered several strains simultaneously. An annulus test piece was developed by Amsden"* specifically to give a graduated range of strains when stretched over mandrels, and this is noted in ISO 1431. The only objections to this test piece are that the strain is slightly different on the two sides and a fear has been expressed that cracks in the high strain region may affect the strains remaining in the lower strain regions. Because of this, and its relatively large size, a number of T50 test pieces or even a number of strips are preferred by most workers for multi-strain exposure. ASTM D1149 includes a bent loop (without a mandrel) and a tapered strip which give varying strains along their lengths, although one would not expect these strains to be very precisely defined. A further multi-strain test piece is the trapezoidal specimen proposed by Dlab" ^ but this does not appear to have been evaluated widely.
The areas where a test piece is attached to clamps and cut edges are preferential sites for cracking. It is generally good practice to coat clamped areas with an ozone resistant paint (which does not affect the rubber in any way) but cut edges are best left. For most purposes a Hypalon-based paint is satisfactory. Clamps, even when made of material such as aluminium, should be 'soaked' in ozone prior to use. Any pattern or flaws on the test piece surface will also tend to act as stress raisers and show preferential cracking.
4.4 Conditioning
Because antiozonants and waxes, which to be effective must form a surface bloom, are used to enhance ozone resistance it is usual to condition test pieces in the strained state before exposure. The usual conditioning period is between 48 and 96h and the test pieces should be kept in the dark and in an ozone-free atmosphere. For this treatment to be effective, the test piece surface must not of course be touched in the course of subsequent handling. Where specifications wish to specifically exclude compounds which rely on an adequate wax film for protection, the conditioning period is dispensed with. Hill and Jowett' '' in a criticism of ozone test methods strongly make the point that the conditioning process should be relevant to service conditions if a discriminating evaluation of waxes is to be made.
4.5 Test conditions
Preferably, a series of strains should be used but when for specification or quality control purposes a single strain level is used this is usually 20%.
The most widely used standard ozone concentration is 50±5 pphm (500±50 ppb). This is much higher than levels found in most parts of the

334 Physical testing of rubber
world and a lower test level such as 25 ± 5 pph is perhaps better, but still very high. Any lower levels would be virtually impossible to control with most equipment. Despite 50 pphm being relatively high compared to average ambient levels, it is, with exposure periods of a few days, quite convenient for discriminating between poor and good ozone resistance, although no correlation with service can be implied. To eliminate all but the most ozone resistant rubbers a level of 200 ± 20 pphm is often used. Extremely high levels, such as the 15000 pphm which used to be specified in BS 903, are nowadays very rarely met with in specifications. If a rubber is not completely ozone resistant it will fail at much lower levels than this.
The ISO and BS standards now express the ozone concentration in ppb to satisfy prefix purists, with the more traditional and familiar pphm in brackets. However, ASTM D1149 now uses partial pressure in mPa to eliminate differences due to atmospheric pressure at different altitudes, but ISO 1431-1 only mentions it in a note. ISO 1431-3 gives the options of mgW and mPa in addition to pphm but ppb had not yet become fashionable in 2000 when it was published. The significance of partial pressure has been demonstrated by Veith and Evans" . Basically, the rate of cracking is a function of the collision rate of ozone molecules with the rubber. At different atmospheric pressures in the cabinet, the collision rate, and hence the cracking, will be different at the same concentration expressed in pphm. Clearly, the effect is important in locations with, relatively speaking, extremes of pressure from standard.
Temperature does affect the rate of ozone cracking but it cannot be said simply that higher temperatures accelerate the effect. The blooming characteristics of different waxes can make an increase in temperature increase or decrease ozone resistance. Above about 70°C all ozone is destroyed. In the current major standards, 40°C is specified, just a small degree of acceleration above ambient and practically the lowest level which can be controlled without cooling.
Hill and Jowett" ^ have demonstrated that a test at about 0°C is much better for discriminating between protective wax systems and coincides with a temperature at which protection is most difficult. It can only be for reasons of inconvenience that standards bodies have not adopted this suggestion and their procedure for conditioning mentioned earlier. Lake and Mente" ^ investigated the effects of high and low temperatures and found that these were more associated with threshold strain rather than rate of crack growth, and varied with the polymer and the protective system.
It has been shown^^ that the humidity of the ozonised air can affect the rate of ozone attack. Generally any significant change is restricted to very high humidities and ISO 1431 states that normally the humidity shall be less

Environmental resistance 335
than 65% at the test temperature, but makes allowance for testing at between 80 and 90% as an alternative.
4.6 Test procedure
Briefly, the test pieces are placed in the chamber at the required strain and ozone concentration and inspected at intervals. If opening the cabinet reduces the concentration for appreciable periods this will affect the results, although an automatically controlled cabinet should show a fast response. Some workers observe the test pieces through a window in the cabinet. This avoids disturbing the concentration and any handling of the test pieces but it is doubtful whether the inspection can be as thorough as when the test pieces are removed.
Most specifications give a set strain and exposure period but it is preferable to examine test pieces at a series of times such that data can be obtained on the relationship between strain and time to appearance of cracks. ISO 1431 requires examination to be carried out with a lens of x7 magnification but, unfortunately, any examination of cracks is to some extent dependent on the eyesight of the operator. In practice, many workers say a crack is only a crack if they can see it with the naked eye. The alternative procedure of measuring relaxation in stress will be discussed later. An optical method of automatically detecting cracks has been described by Zeplichal ^ but this is relatively complicated and has not been considered for standardisation.
4.7 Expression of results
When only a single strain and exposure period has been used, the result is simply expressed as either cracking or no cracking. The degree of cracking can also be described and a number of arbitrary scales have been used, but they are all terribly subjective. The most widely used is the 0-3 scale where 0 is no cracking, 1 is cracks only seen under magnification, 2 is very small cracks and 3 anj^hing worse. Even this simple rating scheme falls down when there are one or two large cracks only.
Alternative approaches are based on recording the time until the first appearance of cracks. Regular inspections are necessary but much more information is gained than in a 'go/no go' test. The real advantage of recording time to cracking is reahsed when a number of strains are used. It is then possible to observe the relationship between time to crack and applied strain. In some cases a linear plot will show the existence of a limiting threshold strain as shown in Figure 16.6. For other rubbers a log-log plot will yield a straight line but it is dangerous to extrapolate this to much longer

336 Physical testing of rubber
times. Lake^^ makes it quite clear that assumption of a linear relationship to calculate threshold strains can lead to large errors.
STRAIN
TIME TO FIRST APPEARANCE OF CRACKS
Figure 16-6. Threshold strain. L = Hmiting threshold strain
The first criterion for describing a material as ozone resistant is total freedom from cracking. Therefore, the higher the threshold strain after a given exposure period, or the higher the limiting threshold strain if this exists, or the longer the time before cracks appear at a given strain, the better is the ozone resistance. However, when materials with relatively low ozone resistance are being compared such that cracking is inevitable during service life, then the severity of cracking is important. Very small cracks may be of little consequence apart from a cosmetic point of view. This is usually the case when thick sections of rubber are involved and cracking is confined to the surface.
The way in which the severity of cracking is related to strain is not simple. The usual trend is shown in Figure 16.7; by definition there being no cracks below the threshold strain for any given exposure period. A few cracks, often large, are found at strains slightly above the threshold and the cracks will become more numerous and smaller at progressively higher strains. It is quite possible for the cracks at very high strains to be so small as to be invisible to the naked eye. As exposure time increases numerous very small cracks may coalesce to form larger but relatively shallow cracks. Hence, a non-resistant rubber at high strains could be more suitable than a

Environmental resistance 337
'better' resistance rubber just above its threshold strain. This illustrates the futility of protecting a rubber such that it will just pass a single strain and period standard test when it will exhibit large cracks in service.
AVERAGE CRACK LENGTH
STRAIN
Figure 16-7. Relation between crack size and strain (diagrammatic). T is the threshold strain; curve A, average crack length; curve B, average crack length with coalescence of cracks;
curve C, crack density.
4.8 Dynamic ozone results
All the previous discussion was referring to test pieces exposed to ozone whilst held at a static strain. Because many products are subjected to cyclic strain in service and because protective wax coatings, which are easily removed by mechanical contact, cannot withstand cycling there is much logic in using a dynamic exposure test. The method given in ISO 1431:Part 1 ^ cycles either the strip or T50 test pieces in tension at 0.5 Hz. The low frequency is used so that there is little contribution from fatigue mechanisms. The exposure and expression of results is generally the same as in the static standard method but either continuous cycling or a sequence of dynamic cycles and periods of static strain is specified. Various views have been expressed as to which sequence correlates best with particular service applications^ ' " but no sequence is given in the standard, reflecting the fact that no one sequence has attained widespread acceptance. For general purposes, continuous cycling could be used.

338 Physical testing of rubber
It has also been shown " that T50 test pieces can be successfully used with complete fracture as the criterion of failure. This obviously results in a longer test but the means of assessment is much easier and not subjective. Although rupture is not widely used as a measure of ozone attack it is used in fatigue tests (Chapter 12) and could possibly be used for static ozone tests.
ASTM D3395^^ has a similar method to ISO 1431 but with a higher standard strain and only covers continuous cycling. D3395 also includes a second dynamic exposure procedure in which test pieces are fixed to a fabric belt which runs over a pair of pulleys. The test pieces are, hence, strained by bending so that the degree of strain is dependent on the thickness of the test piece as well as the pulley diameters. The advantage of this method is that there are no clamps to cause preferential cracking, but the maximum strain is less well defined and it is less easy to vary the strain than it is with a test in the tensile mode. At the time of writing, it has been proposed that D3395 is combined with Dl 171.
Apparatus has been produced that used a version of the De Mattia flexer (Chapter 12) in an ozone cabinet but this operates at a high frequency and suffers from poorly defined strain. Ehrhardt ^ favoured the De Mattia on the grounds of reproducibility but the differences appeared minimal and he refered to a very out of date version of ISO 1431-2.
4,9 Stress relaxation
It has been commented earlier that the observation of cracking is a subjective measure and using the time to the onset of cracking still involves detecting the cracks by eye. Measuring the relaxation of stress in the strained test piece as ozone attack proceeds offers an attractive alternative which eliminates any assessment by the operator. Although this approach was suggested at least as far back as 1956, it has not as yet been widely accepted, perhaps because of the extra apparatus, expense and complexity and because a sensitive force detection system is needed to detect early symptoms of attack. Several workers, notably in France, have described apparatus^ ' ^ and proposals were made to ISO that a standard method should be developed, but it did not advance.
Rather than stress relaxation, Prokopchuk et al ^ used the change in tensile strength to monitor the effect of exposure to ozone. They found very significant decreases in strength after exposure times of less than one hour, indicating that this is a very sensitive indicator of degradation, but did not indicate whether the fall in strength was detected before cracks were visible. They also found a synergistic effect with alternate exposure to ozone and dynamic cycling.

Environmental resistance 339
5. WEATHERING
The most catastrophic cause of deterioration of susceptible rubbers when exposed to the atmosphere out of doors is ozone. Because it is hopeless to try to find a consistent level of ozone in the atmosphere, the usual approach is to use the laboratory ozone tests discussed previously. However, outdoor tests are sometimes specified for products. There is no ISO standard specifically for the effect of ambient ozone but procedures are specified in ASTM D1171^* and D518^ . D1171 uses triangular test pieces wrapped around a mandrel whilst D518 is essentially D1149 but for outdoor exposure. As mentioned earlier, it is proposed to amalgamate these standards asD1149.
Accelerated ozone tests are almost exclusively used to make comparisons between materials rather than to attempt prediction of time to cracking under ambient concentrations. If results are obtained of time to cracking as a function of applied strain, there is often an apparent threshold strain below which there is no cracking or the time to cracking is very long. A limiting threshold strain is one below which no cracking occurs even at very long times, but in prolonged natural exposures there can be less evidence of a limiting threshold than in accelerated tests and, hence, this simple approach can be dangerous.
If results are obtained as a function of ozone concentration, in theory it should be possible to make extrapolations to ambient conditions by empirically fitting a relation to the concentration against time to cracking/crack growth rate. For natural rubber, there has been evidence that that the relation is broadly linear.
Ehrhardt both criticizes accelerated ozone tests as not correlating with outdoor exposure^^ and gives procedures for making predictions of outdoor behaviour from cabinet tests^ ' ' . If nothing else, his results do demonstrate some of the problems.
Oxygen, temperature, moisture and sunlight also affect rubber. At normal temperatures the rate of degradation by oxygen is rather slow and accelerated ageing tests are usually used, despite difficulties of correlation (see Chapter 15 Section 4). The effect of light on rubbers is generally considered to be much less important than it is on, for example, plastics and, degradation being generally restricted to the surface layer, is of most consequence in the case of coated fabrics and very thin-walled articles. The exception is change of colour in non-black rubbers. The net result is that weathering tests on rubbers are carried out relatively infrequently. However, this is probably a complacent view as back in 1970 Angert and Dubok^^ reported significant weathering effects on both black and white filled compounds. Recent experience at Rapra^^ was that the effect of weathering

340 Physical testing of rubber
could be significant and should not be ignored. Marcos Maillo and White^^ investigated the effect of UV on a tyre compound whilst under stress and found that the UV was the main cause of cracking at low ozone levels and that stress accelerated the effect.
The standard adopted by ISO has been developed from, and is closely related to, the plastics equivalents which have been in existence for many years. ISO 4665^^ covers exposure to both natural sunlight and laboratory light sources. The "natural exposure" can be direct outdoor weathering, exposure under glass or to intensified light by using Fresnel mirrors. The laboratory light sources may be xenon arc, fluorescent tubes or carbon arc. ISO 4665 is a relatively short document as it really only covers the procedures for changes in properties and expression of results, because the exposure apparatus and exposure procedures are specified by reference to the equivalent plastics documents " . Earlier versions of ISO 4665 gave details of apparatus and procedures but these were little more than copies from the plastics standards and this duplication has been eliminated. There is a British standard identical to ISO 4665 pubhshed as BS ISO 4665.
The plastics standards are very detailed and have become more complicated at each revision, reflecting advances in equipment to give better reproducibility and, of course, the great importance of weathering for plastics. At the time of writing, further revisions are in progress.
However well you standardise the procedures for natural weathering exposure, the great advantage of obtaining deterioration data under "real" conditions is to some extent nullified by the enormous variation of those real conditions from site to site and time to time. Also, the tests will usually need to be continued for very long times. In this respect, it is often recommended that exposure trials of any new product should begin as early as possible so that the experience or data is always ahead in time of actual use and may be used to give advance notice of any possible trouble.
Provision is made in ISO 4665 for exposure of strained test pieces so that, in addition to the effect of light and temperature (and perhaps rain), the effect of ozone can be investigated. The procedures are the same as in ISO 1431 for exposure in an ozone cabinet.
When we come to artificial weathering, it should be remembered that the aspects of weathering generally of most concern with rubbers, ozone attack and oxidative ageing, are catered for by the specific accelerated tests already discussed. ISO 4665 covers general artificial weathering in which the main consideration is the effect of light and, if required, rain cycles, but where the temperatures are usually fairly modest by rubber ageing standards and ozone is deliberately excluded.
The first objective in an accelerated test is to use a light source which simulates natural sunlight, particularly in the UV region. It is generally

Environmental resistance 341
considered that the xenon arc with filtering below 300nm and to reduce the infrared gives the best simulation over the whole spectrum, but fluorescent tubes also reproduce the important UV region. They have potential advantages over the Xenon arc of low cost and lack of heat generation which has made them popular. The carbon arc does not simulate sunlight very well and it not clear why it was it was included in this edition of ISO 4665. It will be appreciated that, with a choice of light source and also choice of conditions specified in the plastics standards, it is necessary that all the conditions used are recorded and care taken in comparing data.
Although the standards specify the irradiance of the light sources, they do not say how it should be measured, but reference is made to ISO 9370 " for the use of a radiometer. It used to be specified that, as an alternative to measuring the irradiance, blue wool actinometric standards could be used to estimate the integrated radiation dose but this is not now included. Polymeric reference materials probably have advantages over wool standards if a cheap but less precise alternative to instrumental methods is wanted. Polysulphone materials are specified in BS 2782 method 540C^^ but it is not known if they can still be obtained. A document covering polyethylene standards is currently being progressed in ISO TC 61 for plastics (DTR 19032).
The irradiance of lamps tends to change with time and, if this is monitored, adjustments can be made. UV lamp apparatus can be controlled by replacement and rotation of tubes but an electronic control system has been described^ .
The temperature of exposed samples is dependent on both the air temperature in the cabinet and the absorbance of direct radiation. Temperature is usually measured with a black panel thermometer which gives the surface temperature of a perfectly absorbing material. A white panel thermometer gives the other extreme. The actual temperature reached by a sample depends on the material and its colour. It will also depend on air temperature and velocity so that both air and black panel temperature should be controlled.
More detailed information on weathering tests, natural as well as artificial, can be found in the large numbers of published papers which refer to plastics. The volume of this hterature is very considerable and only a few references are given here. For earlier work, an exhaustive bibliography was compiled by the building Research Establishment^^ which follows on from the RAPRA review^^ of the subject up to 1968. There was a further review report in 1992^ . Brown^^ has given a short overview of test procedures for artificial weathering which references some key papers, while further information and guidance on weathering tests is given by Kockott in Handbook of Polymer Testing^'. Minematsu^^ has provided definitions of the units used in irradiance monitoring.

342 Physical testing of rubber
Effects of various climatic conditions on rubbers were given by Bergstrom^^ and Sourisseau and Ehrhardt " . Spetz^^ describes a composite test approach to evaluating weather stripping, whilst the composite test approach to tyres has been reported by Huang et al ^ and Prokopchuk et al ''. To improve the reproducibility of weathering tests, Chin et af ' ^ developed an exposure chamber based on an integrating sphere.
Making predictions of service life from weathering tests is clearly more complicated than heat ageing alone because there are temperature effects added to the light and, probably, other agents such as moisture, ozone etc as well. An outhne of models which have been applied has been given by Brown^ ' ^\ Although not strictly weathering. Derringer and Watkins^^ conducted statistical experiments for the exposure of elastomers to multi-component environments typical of deep sour wells.
For special purposes, more complex equipment is occasionally used (not covered by 4665) which additionally attempts to simulate corrosive or polluted atmospheres. There is an ISO standard for plastics for a salt spray exposure test ^ which could in principle be applied to rubber should such an exposure be needed. Cyclic exposure to corrosive atmosphere could be more representative of service " ' ^ One particular circumstance is exposure to a marine environment and there is an ISO standard covering this for plastics^^.
6. BIOLOGICAL ATTACK
Rubber (and/or the additives in it) can, under some circumstances, prove a tasty morsel for living organisms, particularly micro-organisms. Fortunately, their interest is not so great that no piece of rubber is safe, and significant attack is comparatively rare. There are, however, circumstances in tropical countries where biological attack on rubber is a serious problem and there has been considerable concern that rubber seals for water pipe are susceptible even in temperate climates.
Exposure to living organisms is hardly a physical test (although measurement of the damage would be) and it is a very specialised subject. It is generally agreed that T)iological ageing' is a subject best entrusted to the experts and if a rubber is to be tested the assistance of industrial or academic estabhshments specialising in that field should be sought.
For particular products or circumstances where biological attack is very important, the problem has received careful consideration. Pipe joints, mentioned above, are a good example. After quite extensive investigations, the British Standard for pipe joint rings ' now includes a requirement for resistance to microbiological degradation. Two fairly extensive but very dated reviews^ ' ^ cover microbiological deterioration and attack by insects

Environmental resistance 343
and rodents respectively, whilst references 100-102 are further examples of discussion of microbiological degradation. Cundell and Mulcock^^ ' ^" describe methods they used to assess microbiological attack of natural rubber and Barton et al* ^ used a video microscope to observe bacterial growth on polymers. Eastwood et al ^ say that micro biological spoilage of polymers costs milhons of pounds and describe a method for determining susceptibility to microbial growth on plastics which does not require a specialized laboratory. There is an international standard, ISO 84 ^ , for the evaluation of the action of microorganisms on plastics which has four procedures: fungal growth, fungistatic effects, resistance to bacteria and resistance to microbially active soil. It is not immediately clear why there is also a standard for effectiveness of fungistatic compounds in plastics *^ and a further new work item covering the same area is being considered.
The development of biodegradable materials has attracted a great deal of attention in recent times. One result is the development of a considerable suite of ISO test methods for the biodegradability of plastics. Although biodegradable rubbers do not appear to have aroused much interest, the plastics methods could be adapted if needed and can be found by searching the ISO web site. The variety of tests can be a trifle confusing but an overview has been given by Itavaara and Vikman^^ .
7. FIRE
Most rubbers bum, although this fact has caused nothing like the alarm which the flammability of plastics, and particularly foams, has given rise to. The fire hazards of plastics and the methods of test have received enormous attention in recent years, including careful attention to the 'philosophy' of fire testing. Rubber has received the same attention on a much smaller scale and, in general, the principles of the fire testing of plastics apply to rubbers. Hence, fire testing will be dealt with briefly here, bearing in mind that a more detailed study of the subject as applied to polymers can be made by reference to the quantities of published information on plastics.
Some form of agreed and understood philosophy of fire testing is necessary because it is fairly easy to invent a host of more or less ad hoc fire tests which are confusing as to which aspect of fire they are meant to cover, may give positively dangerous impressions because of ill-conceived presentation of results and in no way predict the performance of the material in a real fire situation.
The most important distinctions to make are between large scale and small scale tests and to clearly define which aspect of fire is being evaluated, for example ease of ignition, rate of burning, smoke production, etc. Large

344 Physical testing of rubber
scale tests are necessary to evaluate the performance of a material or product in most real fire situations.
The point has been illustrated by the example of wood. It is easy to set fire to matchsticks with a small flame which would never get a large log burning, but if that log is fired by a large flame it may bum very well and would burn better if there were several logs together. In addition, one log might produce far more smoke than another, which may be far more dangerous than the flame or heat. Small scale tests are, in general, restricted to investigating the ease of ignition of small amounts of materials by small flames and for the quality control of materials.
The international and most national standards committees whose terms of reference are concerned specifically with the polymer industry deal only with small scale tests. The large scale tests, which are not usually specific to any one type of material, are covered by committees whose concern and expertise is fire.
There are no ISO, ASTM or British fire test method standards specifically for solid rubbers and there is no active fire test work being pursued in TC 45. There are, however, a number of published international test methods for cellular materials and plastics, the majority of which could be applied to rubbers. A comprehensive account of fire testing of plastics has been given by Paul in the Handbook of Polymer Testing^ There may be fire resistance requirements for particular rubber products and some examples were given by Schultz^^ .
8. RADIATION
Radiation is taken here to mean atomic and nuclear particles, i.e. gamma rays, electrons, neutrons, etc. The intensity of such radiation at the earth's surface is not high enough to significantly affect rubbers, and tests are only required in connection with applications in nuclear plant, where radiation is used to induce crosslinking or for sterilization. Not surprisingly, such a specialised subject has not given rise to a wide scale standardisation of test methods. There is, however, an lEC standard in four parts which is a guide to determining the effects of ionising radiation on insulating materials^ " " and can be used as a basis for a test programme. ASTM 1027 for exposure of polymeric materials to radiation was withdrawn in 1996.
Each of the types of radiation has a characteristic way of interacting with matter and transferring its energy. Alpha radiation has the least penetrating power and its effects are limited to the surface layers of a material, so it only needs to be considered when a surface is contaminated by an alpha emitter. Beta radiation has a range of up to a centimetre or two whilst X-ray, gamma
Environmental resistance 345
radiation and neutrons are very penetrating. Most often, accelerated tests are carried out using gamma radiation from an isotope source or an electron beam from an accelerator. The unit of radiation dose is the Gray (which is 100 times larger than the earlier unit, the Rad).
The actual exposure clearly requires a very specialised facility but the methods used to monitor changes are the same as for other ageing tests. For example, change in hardness and tensile properties would serve for general purpose evaluation and compression set and stress relaxation are relevant for seals.
Whilst the assumption can be made that degradation is independent of dose rate, in practice it is often found that the effect of a given dose decreases with increased dose rate. The main reason is that acceleration levels can be very high (in accelerated tests the dose rate might be up to lOGy/s whereas in service rates are often below ImGy/s) and the limiting factor is the rate of oxygen diffiision. Recommended practice is to test at two or more dose rate levels to determine the magnitude of the effect.
When heat and radiation are considered together, the two effects will be additive. However, there can also be a synergistic factor, as reported by Ito^^^ lEC 61244-1^^^ explains techniques for monitoring diffusion limited oxidation. Burnay^*^ has developed a predictive model which is based on the use of the superposition technique to determine thermal and dose rate shift factors relative to a master curve of compression set versus time. This relation has also been quoted by Brown^V Claverreul and Pellegrin^^^ developed a kinetic model for accelerated gamma irradiation. Three methods used to extrapolate from high dose rates to those more typical of service are given in IEC61244-2^^^
It has been observed^^^ that gamma radiation reacts with oxygen to form ozone which can attack the surface of the test piece. The result was an increase in modulus at the surface and cracking if the test piece was strained.
REFERENCES
1. Soden A L and Wake W C. Trans. IRI, 27,223,1951. 2. ASTM D3137, 1984 (2001). Hydrolytic stability. 3. Flory P J. Journal of Chem. Phys., 18,108,1950. 4. Flory P J and Rehner J. Journal of Chem. Phys., 11,521,1943. 5. Kraus G. Rubb. World, 67, October 1956. 6. Murgic Z H, Jelencic J, Bravar M. Kaut. u. Gummi Kunst., 45, 11, 1992, p939. 7. Cholinska M, Glijer T. Int. Polym. Sci. Tech., 5, 5, 1978, pT77. 8. Faridah HAH, Tinker A J, Farid A S. J. of Rubber Research, 7, 4,2004, p248. 9. Martin J W, Peterson E R and McCormick H E. ACS Meeting, Cleveland, Oct. 13-16 1981,
Paper 3, 10. ISO 1817, 1999. Determination of the effect of Hquids.

346 Physical testing of rubber
11. Brown R P. RAPRA Research Report No. 191,1970. 12. ASTM D471, 1998. Effect of liquids. 13. ASTM D1460, 1986 (2001). Change in length during liquid immersion. 14. ASTM D5964, 1996 (2001). Rubber IRM 902 and IRM 903 replacement oils for ASTM
N°2andN°3oils. 15. Brown R P and Jones W L. RAPRA Bulletin, 42, February 1972. 16. Brown R P and Hughes R C. RAPRA Members Journal, 194, August 1973. 17. Pope D S, Koros W J, Fleming G K. J. Polym. Sci. Polym. Phys., 27, 5, 1989, pi 173. 18. Spieglberg S H. SPOE Polymer Analysis Division, Newark, 2"'' November 1999,
Proceedings p73. 19. Ustinova T A, Baranova G A, Romanenko N S. Int. Polym. Sci. Technol., 1, 8, 1974,
pT87. 20. Prime R B. Thermochimica Acta, 26, 1978, pl65. 21. Piccinini E, Bacshettin M G, Sarti G C. Journal of Membrane Science, 234, 1-2, 2004,
p95. 22. Knoergen M, Heuert U, Schneider H, Kuckling D, Richter S, Amdt K F. Macromolecular
Symposia, 145, October 1999, p83. 23. Babitskii B L. Int. Polym.Sci. Technol, 4, 12, 1877, pTll. 24. BS 903:Part A18, 1973. Determination of equilibrium water vapour absorption. 25. Briscoe B J, Savvas T, Kelly C T. Rubb. Chem. Technol., 67, 3, 1994, p384. 26. Stevenson A, Morgan G. Rubb. Chem. Technol, 68,2, 1995, pi97. 27. ISO 1431:Part 1,2004. Resistance to ozone cracking - Static and dynamic strain testing. 28. ISO 1431 :Part 3, 2000. Resistance to ozone cracking - Reference and alternative methods
for determining the ozone concentration in laboratory test chambers. 29. ASTM Dl 149, 1999. Surface ozone cracking in a chamber. 30. ASTM D518, 1999. Surface cracking. 31. ASTM Dl 171, 1999. Surface ozone cracking outdoors or chamber (Triangular
specimens). 32. ASTM D3395, 1999 Dynamic ozone cracking in a chamber. 33. ASTM D4575, 1996 (2001). Reference and alternative methods for determining ozone
level in laboratory test chambers. 34. Suga S, Mitsuhashi K, Abe Y, Tanno H. Polym. Test., 8, 2, 1988/9, pl31. 35. Cheetham K and Gurney W A. Trans. IRI, 37, 35,1961. 36. Seeberger D. Gummi Fas. Kunst., 40, 2, 1987, p64. 37. Crabtree J and Kemp A R. Ind. Eng. Chem. Anal. Ed., 18, 769, 1946. 38. Brewer A W and Milford J R. Proc. Roy. Soc, A256, (1287), 470, 1960. 39. Bonell P and Brown R P. Rubb. J., September 1971, p.64. 40. Brown R P and Peppiatt A. RAPRA Members Report No. 13, 1978. 41. Thelamon C. Polym. Test, 3, No. 2, 1982. 42. Wundrich K and Hentrick H. Polym. Test, 6, No. 3, 1986. 43. ISO 13964, 1998. Air quality - Determination of ozone in ambient air - Ultraviolet
photometric method. 44. ISO 10313, 1993. Ambient air - Determination of the mass concentration of ozone -
Chemiluminescence method. 45. Amsden C S. The Annulus Ozone Test', ICI Ltd., Dyestuffs Div., 1967. 46. Dlab J. Plasty a Kaucuk, 12, 8,1975, p253. 47. Hill M and Jowett F. Polym. Test., 1, No. 4, 1980. 48. Veith A G and Evans P L. Polym. Test., 1, No. 1, 1980. 49. Lake G J, Mente P G. Polymers in Extreme Environments, Nottingham, 1991, Paper 2.93. 50. Kempermann T. Rubb. News, 13, 9, 26, 1974.

Environmental resistance 347
51. Zephichal F. Rev. Gen. Caout. Plast, 49,11,1972, pl047. 52. Lake G J. Polym. Test., 11,2, 1992, pi 17. 53. Lamm G and Thelamon C. LRCC Tech. Bull., No. 85,1970. 54. Fletcher W. RAPRA (Unpublished Work.). 55. Ehrhardt D. Int.Polym. Sci. and Tech., 24, 5, 1997, pTl. 56. Emin G. Rev. Gen. Caout. Plast, 48, 2, 1971, pl45. 57. Bertrand G and Sebonc J. Rev. Gen. Caout. Plast., 50,9,1973, p719. 58. Zuev Yu S and Postorskaya A F. Kauch i Rezina, No. 5, 26, 1974. 59. LRCC Technical Bulletin No. 92, 1973. 60. Ganslandt E and Svensson, S. Polym. Test., 1, No. 2, 1980. 61. Prokopchuk N R, Kudinova G D, Aslovskaya O A, Gugovich S A. Int. Polym Sci. and
Tech.,25,7, 1998,pT45. 62. Ehrhardt D. Int. Polym. Sci. and Tech., 24,10, 1997, pT13. 63. Ehrhardt D. Int. Polym. Sci. and Tech., 25, 7, 1998, pTl 1. 64. Ehrhardt D. Int. Polym. Sci. and Tech., 25, 5, 1998, pTl. 65. Angert L G, Dubok N N. Soviet Rubber Technology, 1970,11 (November), 29. 66. Brown R P, Butler T, Hawley S W. Ageing of Rubber, Accelerated Weathering and
Ozone Test Results, Rapra Technology Ltd, Shawbury, 2001. 67. Marcos Maillo C, White J R. Plast. and Rubb. Composites., 28, 6, 1999, p277. 68. ISO 4665, 1998. Resistance to weathering. 69. ISO 877, 1994. Plastics. Exposure to direct weathering, to weathering under glass-fihered
sunlight and to intensified weathering by daylight using Fresnel mirrors. 70. ISO 4892-1, 1999. Plastics. Methods of exposure to artificial light sources. General
guidance. 71. ISO 4892-2, 1994. Plastics. Methods of exposure to artificial light sources. Xenon Arc
lamps. 72. ISO 4892-3, 1994. Plastics. Methods of exposure to artificial light sources. Fluorescent
UV lamps. 73. ISO 4892 Part 4 1994. Plastics. Methods of exposure to artificial Hght sources. Open
flame carbon arc lamps. 74. ISO 9370, 1997. Instrumental determination of radiant exposure in weathering tests -
General guidance and basic test method. 75. BS 2782 Method 540C 1988. Determination of UV radiation intensity using polysulphone
film. 76. Fedor G R, Brennan P J, Grossman S J. Plastic Finishing, Detroit 21-22""* March 1995,
Proceedings p81. 77. BRE Library Bibliography No. 247, Feb. 1975. 78. Matthan J, Scott K A and Wiechers M. Ageing and Weathering of Plastics, RAPRA
Technology, 1970. 79. Halliwell S M. Rapra Review Report No. 53, 1992. 80. Brown R P. Polym. Test., 12, 5, 1993, p459. 81. Brown R P (Editor). Handbook of Polymer Testing, Marcel Dekker, New York, 1999. 82. Minematsu Y. Int. Polym. Sci. Technol., 14, 7, 1987, pT/34. 83. Bergstrom E W. US, NTIS, Rept. AD B000996, 1974. 84. Sourissean R and Ehrhardt D, Int. Rubb. Con., Kiev. 1978, Preprint C12. 85. Spetz G. IRC86, Goteborg, 1986, Proceedings, Vol. 2, p524. 86. Huang D, LaCount B J, Castro J M, Ignatz-Hoover F. Polym. Degrad. and Stab., 74, 2001,
p353. 87. Prokopchuk N R, Kudinova G D, Aslovskaya O A, Gugovich S A. Int. Polym. Sci. Tech.,
23, ll,1996,pT54.

348 Physical testing of rubber
88. Chin J W, Martin J, Enbree E, Byrd E. ACS Polymer Materials: Science and Engineering Meeting, Washington DC, 20-24^^ August 2000, volume 83, pi45.
89. Chin J W, Martin J, Nguyen T, Enbree E, Byrd E, Tate J D. ANTEC 2002, San Francisco, 5-9* May 2002, Proceedings, Paper 75.
90. Brown R P. Polym Test.l4, 5, 1995, p403. 91. Brown R P. Practical Guide to the Assessment of the Useful Life of Rubbers, Rapra
Technology, Shawbury, 2001. 92. Derringer G, Watkins M J. Rubb. World, 193, 3, 1985, p29. 93. ISO 4611, 2001 Plastics - Determination of the effects of exposure to damp heat, water
spray and salt mist. 94. Austin M J. Polym. Paint Col. J., 182, No.4317, 1992, p570. 95. Brennan P J. Paint and Ink Int., 7,4, 1994, p24. 96. ISO 15314,2004. Plastics - Methods for marine exposure. 97. BS 2494 1990. Specification for elastomeric joint rings for pipework and pipelines. 98. Heap, W M. RAPRA Information Circular No. 476,1965. 99. Pacitti, J. RAPRA Information Circular No. 475, 1965. 100. Rook J J. Appl. Microbiol., 3, 302, 1955. 101. Heap W M and Morrell S H. J. App. Chem., 18, 189, 1968. 102. Kilkarni R K. Polym. Eng. and Sci., 5,4, 1965, p227. 103. Cundell A M and Mulcock A P. Int. Biodetn Bull., No. 9, 91, 1973. 104. Cundell A M and Mulcock A P. Int. Biodetn. Bull. No. 9, (1-2), 17, 1973. 105. Barton A J, Sagers R D, Pitt W G. J. Biomed. Mat. Res., 32, 2, 1996, p271. 106. Eastwood I M, Kneale C J, Ogden G. Polymer Testing '97, Shawbury, 7^-11* April
1997, Proceedings, Paper 2. 107. ISO 846 1997. Evaluation of the action of microorganisms. 108. ISO 16869, 2001. Assessment of the effectiveness of fungistatic compounds in plastics
formulations. 109. Itavaara M, Vikman M. J. Environmental Polym. Degrad., 4, 1, 1996. 110. Schultz N. Rubb. World, 207, 3, 1992, pl2. 111. lEC 60544 Electrical insulating materials. Determination of ionising radiation. Part 1
1994. Radiation intensity and dosimetry. 112. lEC 60544 Part2, 1991. Procedures for irradiation and test. 113. lEC 60544 Part 4 2003. Classification system for service in radiation environments. 114. lEC 60544 Part 5 2003. Procedures for assessment of ageing in service. 115. Ito M. Int. Polym. Sci. Technol., 14, 7, 1987, pT38. 116. lEC 61244-1, 1993. Determination of long term ageing in polymers. Part 1: Techniques
for monitoring diffusion limited oxidation. 117. Bumey S G. OPERA 89 Conference, Lyon, France, 1989, Proceedings Volume 2, p561. 118. Clavreul R, Pellegrin L. Polym. Test., 20,7,2001, p769. 119. lEC 61244-2, 1996. Determination of long term ageing in polymers. Part 2: Procedures
for predicting ageing at low dose rates. 120. Clough R L, Gillen K T. Journal of Polymer Science Part A, 27,1989, p2313
Chapter 17
PERMEABILITY
Rubbers are by no means impermeable to vapours and gases, although in many cases the rate of transmission is low. In a number of applications even a small loss (or gain) of liquid or gas may be important, for example balloons, fuel tanks or water vapour barriers and, in consequence, the rate of transmission then needs to be measured.
The theoretical aspects of permeation through polymers have been considered in some detail in a very comprehensive review by Lomax ' and by Hands in Handbook of Polymer Testing^. Only the basic concepts are necessary here and Lomax's review and the chapter by Hands are recommended for a more detailed consideration of the subject. The review describes and comments on virtually all known test methods at the time as well as considering the theory and providing a bibUography of almost 100 references, whilst the book chapter has the same scope and provides more recent references.
1. BASIC THEORY
Gas or liquid can flow through the holes in a porous material but, even if there is no porosity or flaws, permeation through the material will take place by a process of absorption and diffusion. In the ideal case, the quantity of gas or vapour being transmitted builds up to a constant steady state level after a period of time and in the steady state:-
,=e«i

350 Physical testing of rubber
where: q = volume of gas transmitted, Q = permeability coefficient, t = time, P = partial pressure difference across the test piece, A = test piece area, and d = test piece thickness.
In many cases, Q is a constant for a given gas and polymer combination but for other combinations, particularly with vapours, Q varies with, for example, test piece thickness or pressure difference. Hence, it is necessary to know the dependence of Q on all possible variables in order to characterise the permeability of the material completely.
The preferred units for permeability coefficient are m' s' N" (m^ms''Pa" m" ) but the terms permeability coefficient or permeability constant are often applied to various transmission rates using a variety of units and care must be taken to avoid confusion. Useful conversion factors are given by Yasuda and Stannett" . When the permeability coefficient is dependent on test piece thickness, it is convenient to use a transmission rate -the amount of permeant transmitted per unit time and area for a given test piece thickness - which may be in units of m s' N" (m^s' Pa' m' ). Transmission rate is almost always used in the case of vapours and often in the units g24h" m" .
The permeation of a gas through a polymer (disregarding flaws) takes place in two steps, the gas dissolving in the polymer and then the dissolved gas diffusing through the polymer. The solubility constant is the amount of a substance which will dissolve in unit amount of the polymer under specified conditions whilst the diffusion constant is the amount of substance passing through unit area of a given plane in the polymer in unit time for a unit concentration gradient of the substance across the plane. It can be shown that:
Q = SD
where: S = the solubility constant, and D = the diffusion constant. Although this simple relationship holds for some gases, for other gases
and most vapours it does not and, as noted above, the permeability 'constant' is then not a constant. It depends on the solubility and diffusion characteristics but these may vary with different conditions. The permeability constant varies with temperature and, although simple theory predicts that the change will follow an Arrhenius type relationship, this also is not true for many vapours.
The permeability constant has been defined for steady state conditions, and at times before this is reached a smaller apparent permeability constant will be measured. Hence, when measuring permeability constant or transmission rate it is necessary to wait until the steady state has been

Permeability 351
reached or to make an extrapolation. For some vapours, particularly with thick films, equilibrium can take several days or even longer.
2. GAS PERMEABILITY
The traditional procedures for measuring gas permeability involve setting up a pressure differential across the test piece and measuring by change of pressure or volume the amount of gas passing to the low pressure side of the system. In the basic manometric method both volume and pressure on the low pressure side change with time. A number of variations on this theme have been used but two procedures, testing at constant volume and at constant pressure, are standardised for rubbers in ISO 2782^ The equivalent British Standard method, BS 903:Part A30^ is identical. The two procedures were previously in separate standards and the combined text leaves a lot to be desired in terms of clarity.
There is no ASTM standard for manometric methods specifically for rubbers but ASTM D1434^ has basic manometric and constant pressure procedures for plastics. The ISO method for plastics, ISO 2556^, gives only a basic manometric procedure.
These standard methods are outlined below but for a critical understanding of the problems of operation and likely errors reference should be made to, for example, the review by Lomax ' .
2.1 Constant Volume Method
The apparatus for constant volume method (Figure 17.1) consists of a metal cell having two cavities separated by the test piece. The high pressure cavity is filled with the test gas at the required pressure and this pressure must be measured to an accuracy of 1%.
It is suggested that the usual test pressure is between 0.3 and 0.5 MPa and the cavity should be at least 25 ml volume to minimise pressure loss during the course of the test. The low pressure cavity should be of as small a volume as possible and this requirement is helped by the use of rigid porous packing to support the test piece against the pressure of the test gas. The low pressure side is connected to a pressure measuring device. Traditionally (as described in the standard) this is a capillary U-tube manometer which has an adjustable height reservoir and a bypass valve.
The test cell is enclosed in a constant temperature bath or other device to maintain the temperature within ±1°C (for temperatures up to 175^C). Previously, a closer tolerance of ±0.5°C was given on the grounds that the permeability of many gases is extremely sensitive to temperature.

352 Physical testing of rubber
The test piece is a disc, suitable dimensions being between 50 mm and 65 mm diameter and thickness between 0.25 mm and 3 mm. The lower the permeability of the rubber the more advantageous it is to use a thin test piece. It is essential that the means of clamping the test piece in the cell is such that there is no leakage of gas.
After the cell and test piece have been assembled and the high pressure side filled with gas at the test pressure, the increase in pressure on the low pressure side is measured as a function of time. The standard suggests a conditioning period of at least 16 h to reach steady state conditions unless an approximate value of the diffusion coefficient is known, when the minimum conditioning time can be estimated from:
t = 2D
where: d = test piece thickness, and D = diffusion coefficient.
^To measuring device Clamp
J _ L
Permeable packing
X Z
/ . / . / / / / i i / / / / / / . / / ^ / i\\\\\\\<\\\\r -/
Test piece
Tube and valve for flushing Gas inlet
Pressure gauge
Figure 17-1. Basis of manometric gas permeability apparatus
In the steady state, a plot of pressure change against time should be linear. Any departure from linearity in the direction of increasing slope with time indicates that the steady state has not been reached. Leakage around the edges of the test piece will only result in an unexpectedly high rate of

Permeability 353
pressure rise. Any tendency for the slope to decrease with time is an indication of a leak from the low pressure side.
When a manometer system is used to measure pressure, the reservoir height is adjusted to bring the liquid level above a datum mark with the bypass valve open so that the pressure in the low pressure side is atmospheric. The bypass valve is then closed. As the gas diffuses through the test piece the increase in pressure causes the liquid level to fall and as the meniscus passes the datum line a clock is started (i.e. at zero time). The reservoir is then raised to bring the meniscus above the datum line and both time and the manometer reading are noted when again the meniscus passes the datum line. This process is repeated to give a series of readings. In this way the pressure reading (manometer reading) is always taken at constant volume of the low pressure side of the cell.
The apparatus and procedure described require great care in setting up and in operation. The effort is eased considerably if an automatic pressure measuring device operating at effectively constant volume is used instead of the manometer^. Probably, all apparatus now has some form of pressure transducer. Improvements as regards accuracy and sensitivity can also be obtained by, for example, having a vacuum instead of atmospheric pressure on the low pressure side.
Using a capillary, the permeability of the test piece can be calculated from:
dhVxdx273x9Slxl0^xp
dt AxPxTxlOUOQ
where: dh/dt = rate of manometer rise (m/s), V = effective volume of low pressure side of the cell (m), d = test piece thickness (m), p = density of manometer liquid (Mg/m^), A = effective test piece area (m^), P = pressure difference across the test piece (Pa) and T = test temperature (K). 273 and 101300 are the standard temperature and pressure respectively. The factor 10 is due to the density being in MgW.
2.2 Constant Pressure Method
The test cell is similar to that for the constant volume method, the test piece dividing the cell into high and low pressure cavities. The essential difference is that the low pressure side is connected to a device to measure the volume increase as gas diffuses to the low pressure side whilst maintaining constant pressure. In ISO 2782, a graduated capillary tube is used to measure the volume change and the tube may be arranged either vertically or horizontally. In the vertical arrangement, a U-tube capillary

354 Physical testing of rubber
together with a reservoir is used so that the apparatus is effectively the same as used as for the constant volume procedure. In the horizontal arrangement, only a straight length of capillary is needed which contains a single drop of liquid which is pushed along as volume increases. The capillary cross section must be known to within 1% and areas between 0.7 and 10' to 2 x 10" are suggested.
The operation of the apparatus is very similar to the constant volume procedure. In the case of a horizontal capillary, the movement of the liquid drop is monitored as a function of time. With a vertical capillary, zero time is taken when the meniscus passes the datum line and readings of the level of the meniscus are taken as a function of time, the pressure being compensated for before each reading by adjusting the height of the reservoir to keep the height in the two legs of the tube equal.
The permeability of the test piece can be calculated from:
_ c// c /X273Xpxa
dt Ax{P-p)xTxl0l300
where dl/dt = rate of displacement of liquid in the capillary (m/s), d = test piece thickness (m), p = pressure in low pressure side (Pa), P = pressure in high pressure side (Pa), a = cross-sectional area of capillary (m^), A = effective test piece area (m ) and T = absolute temperature (K). 273 and 101300 are the standard temperature and pressure respectively.
As commented in Section 2.1, the vertical capillary type of apparatus requires considerable care to set up and operate. A horizontal capillary results in a little more simple apparatus compared to a vertical capillary but in either case there is the extra necessity in the constant pressure method to accurately calibrate the capillary. Generally, the most convenient procedure is to use the constant volume method with an apparatus equipped with modern pressure transducers.
2J Carrier Gas Methods
Carrier gas methods for measuring permeability are those where the quantity of gas passing through the test piece is estimated from the change in chemical composition of the gas mixture on the receiving side of the test piece. The test gas flows on one side of the test piece and a second gas, the carrier gas, flows on the other side and is quantitatively analysed to determine the quantity of test gas which has passed through the test piece. The principle is shown in Figure 17.2. In such procedures there is no need for a pressure differential across the test piece, although the process of

Permeability 355
chemically detecting the transmitted gas can of course be used with high differential pressures.
Permeant in Permeant out
/ / / / > / / / / / / / / / / / / / /
Carrier gas in Carrier gas and permeant out to detection device
Figure 17-2. Principle of carrier gas method
This type of method offers several advantages over the pressure differential methods discussed previously. With little or no pressure differential there is less problem from leaks, no difficulty in supporting the test piece, and the situation is more like that in many packaging applications. Greater sensitivity is possible enabling very low permeability materials to be tested conveniently and the different transmission rates of the components of gas or vapour mixtures can be measured. The principal disadvantage is that the apparatus is relatively expensive.
Because of the greater sensitivity of carrier gas methods and their particular value in packaging applications, most developments have been for plastic films. However, an early standard method for hydrogen through rubber was given in BS 903 in 1950 (now discontinued) in which the carrier gas was air and the concentration of hydrogen was found by measuring the change in thermal conductivity of the gas mixture.
Many carrier gas methods were reviewed in detail by Lomax ' . Apparatus using the measurement of thermal conductivity to estimate permeability has been described, for example, by Yasuda and Rosengren^^

356 Physical testing of rubber
and Pasternak et al^\ Al-Ati et al ^ adapted a thermal conductivity tester for measurements with gases and vapours to give solubility and diffusion coefficients as well as permeability data. The use of a gas chromatograph to measure the concentration of transmitted gas enables more sensitive detection devices to be used and several types of apparatus have been described^ ' . A mass spectrometer offers the possibihty of measuring several gases simultaneously^ ' ^ . Other detection systems have been used including absorption of light to detect sulphur dioxide^ , an oxygen specific coulometric device^ a near infrared luminescence spectometer^^ and chemiluminescence^^ West and Paul " used tapered test specimens combined with x-ray photoelectron spectroscopy and secondary ion mass spectroscopy. Ullsten and Hedenqvist^^ used a commercial head space analyzer which has two sensors on test pieces in the form of pouches. The coulometric sensor method for oxygen has been standardized for testing plastics in ASTMD3985^^
2.4 High pressure measurements
Permeation through rubbers is also of interest for certain application at very high pressures, which introduces extra measurement difficulties. Campion and Morgan^^ used a device which allowed measurement of the test piece thickness in situ under pressure. Briscoe et al ^ developed a novel technique whereby gas absorption under high pressures was monitored using the change of resonant frequency of a rubber test piece/steel rod assembly. The same sort of approach was taken by Keller et al ^ in combination with gravimetric measurements of absorption. A direct technique for measurement of permeability at high pressures was developed by Wiff and Roach^ , whilst Flaconneche et al ^ described two devices for measurement at high pressure and high temperature. Rather than a dual chamber approach, Davis et aP^ studied sorption and diffusion at high pressure by pressure decay techniques.
3. VAPOUR PERMEABILITY
The classical method of measuring vapour, especially water vapour, permeability is the gravimetric or dish method, detecting the quantity transmitted by change in weight. The apparatus illustrated in Figure 17.3 is typical of that used for measuring water vapour permeability of sheet materials. A desiccant is placed in the dish and the test piece in the form of a thin disc is sealed with wax across the mouth of the dish, using a template to accurately define the effective test piece area. The dish assembly is then

Permeability 357
placed in a cabinet at a controlled humidity and weighed at intervals to measure the amount of water vapour transmitted and absorbed by the desiccant.
(a ) V * ^
(b)
(c)
(d)
L -- • — J
Figure 17-3. Water vapour permeability dish, (a) Waxing template; (b) lid; (c) shallow dish for materials of normal permeability; (d) deep dish for materials of high permeability.
Such a method is detailed in ISO 2528^^ and ASTM E96^^ for sheet materials in general. To avoid leaks, the wax seal must be applied very carefully using the templates specified, and the temperature and humidity during exposure of the sealed dishes must be controlled closely. The test must be continued until the increase in weight is substantially linear with time, i.e. equilibrium has been reached.
The result is always expressed as a transmission rate, not a permeability, and is, hence, dependent on test piece thickness. Generally, transmission rate is not a linear function of temperature or relative humidity and, preferably, test conditions are chosen to be as close as possible to those found in service.

358 Physical testing of rubber
Instead of putting the desiccant inside the dish, with a controlled humidity outside, the dish could contain water which is then transmitted out into a dry atmosphere and the amount transmitted measured by weight loss. By inverting the container, the transmission rate when the water is in contact with the test piece can also be measured. The transmission rates measured by the various alternative procedures will be different because different vapour pressure gradients across the test piece are being used and, logically, the conditions most relevant to service would be chosen.
The alternative to using a dish is to form the material into a bag and this so-called pouch or sachet method is often used for plastics films. The advantages are that a larger surface area is exposed, leaks through the wax seal are eliminated, and the conditions are more similar to packaging applications. It is less attractive for rubbers because they are not often used in that sort of packaging application and an alternative to heat sealing the pouch would be necessary.
The procedure whereby the water is placed in the container can be adapted for use with other volatile liquids and a standard method of this type has been published as ISO 6179^^ by TC45. The British standard is identical, pubhshed as BS EN ISO, and there is a similar method in ASTM D814^^ A suitable apparatus is shown in Figure 17.4, consisting of a lightweight aluminium container with a screw-on collar to retain the test piece. The rotating part of the collar applies pressure to the clamp ring through ballbearings so that the test piece is not distorted when the collar is tightened. The two filling valves allow the liquid to be changed during test without disturbing the test piece and this is recommended when a mixture of two or more liquids is used which are not transmitted at the same rate, so changing the properties of the liquid left in the cell.
Two procedures are defined in the standard. In both cases the cells, after assembly, are inverted so that the liquid is in contact with the test piece and left for a preliminary exposure of 24 hours, which enables a check to be made for correct sealing. For procedure A, the container is then emptied and re-filled at 24 hour intervals until the weight loss per 24 hours is effectively constant. In procedure B, the weight loss is simply determined without emptying and refilling between weighings. The time periods can be varied for very fast or slow transmission rates, and plotting a graph of transmission rate against time will clearly identify when equilibrium is reached. With some liquids there will be appreciable swelling of the rubber which means that the thickness and permeability will not be constant and this will effect the time to equilibrium.
The standard requires that the containers are placed with free passage of air across the surface of the test piece but a very high air velocity could

Permeability 359
affect the result, whereas build up of solvent in a confined space could be unpleasant or dangerous.
NON-ROTATING CLAMP RING
SCREW TOP
TEST PIECE
BEARING
FILLING VALVES
Figure 17-4. Permeability cell for volatile liquids
The various gravimetric methods for vapour permeability discussed above are all essentially simple but require great care to achieve good reproducibility, are time consuming, and are not generally sensitive enough to measure very low transmission rates.
A considerable number of alternative techniques have been suggested for measuring vapour permeability of plastics, generally with the aim of making the measurement more convenient and increasing sensitivity. For water vapour transmission, carrier gas type commercial apparatus using an infrared sensor is now commonly used. This procedure is standardised in ASTM

360 Physical testing of rubber
F1249^ . An outline of the development of water vapour methods has been given by Demorest and Mayer ^ and the IR method has been compared with a gravimetric procedure for roofing membranes^ . Other techniques reported include a diode laser spectroscope"* , a procedure based on the evaluation of the heat of evaporation"*^ and the use of TGA"* .
For hydrocarbons, a cell using a flame ionization detector has been used'* and procedures described for selective measurement of the permeation of fuel mixtures'*"*' ^^. A novel approach applicable to any liquid employed a differential transformer and a float to monitor the level of the source liquid"* . Another unusual method is to use radioactive tracers'* . Hinestroza et al"* combined a biaxial stretching device with a permeation cell to investigate the effect of strain.
REFERENCES
1. Lomax, M. Polym. Test., 1, No. 2, 1980. 2. Lomax, M. Polym. Test., 1, No. 3, 1980. 3. Brown R P (Editor). Handbook of Polymer Testing, Marcel Dekker, New York, 1999. 4. Yasuda H and Stannet V. Polymer Handbook, 2nd Edition (Ed. J. Brandrup and E.H.
Immergut), John Wiley and Sons, 1975. 5. ISO 2782, 1995. Determination of permeability to gases. 6. BS 903:Part A30, 1996. Determination of permeability to gases. 7. ASTM D1434, 1982 (2003). Standard test method for determining gas permeability
characteristics of plastic film and sheeting. 8. ISO 2556, 1974. Determination of the gas transmission rate of films and thin sheets under
atmospheric pressure - Manometric method. 9. Pye D G, Hoehn H H and Panar M. J. Appl. Polym. Sci., 20, 1921, 1976. 10. Yasuda H and Rosengren K. J. Appl. Polym. Sci., 14,2839,1970. 11. Pasternak R A, Schimecheimer J F and Heller J J. Polym. Sci., A-2, 8,467, 1970. 12. Al-Ati T, Garza J, Hotchkiss J H. Packaging Technology and Science, 16,6, 2003, p249. 13. Duskova D. Int. Polym. Sci. and Tech., 1, 9, 1974, pT/108. 14. Pye D G, Hoehn H H and Panar M J. Appl. Polym. Sci., 20, 2, 1976, p287. 15. Caskey T L. Modem Plastics, December 1967, p.l48. 16. Pogrebnoi A M, Kudin L S, Butman M F. Int. Polym. Sci. Tech., 19, 5, 1992, p T/47. 17. Tadlaoui N, Clement B, Namiesnik J, Torres L. Polym. Test., 12,3, 1993, pl95. 18. Ivashchenko D A, Krotov V A, Talakin O G and Fuks E V. Vys. Soed., 14A, 9, 1972,
p2109. 19. Watson J M, Zhang G S, Payne P A. Diffusion in Polymers, York, Proceedings, 1991,
p23/l. 20. Davies E G, Rooney M L and Larkins P L. J. Polym. Sci., 19,7, 1975, pl829. 21. Grade J W. SPE 33rd Annual Tech. Conf Antec 75, Atlanta, GA., May 1975, p.592. 22. Gao Y, Ogilby P R. Macromolecules, 25,19, 1992, p4962. 23. Hiramatsu M, Muraki H, Ito T. J. Polym. Sci. Polym. Lett., 28,4, 1990, pl33. 24. West R H, Paul A J. Diffusion in Polymers, York, 1991, Proceedings, pl9/l. 25. Ullsten N H, Hedenqvist M S. Polym. Test., 22, 3, 2003, p291.

Permeability 361
26. ASTM D3985, 2002. Standard test method for oxygen gas transmission rate through plastic film and sheeting using a coulometric sensor.
27. Campion R P, Morgan G J. Plast. Rubb. Comp. Proc. App., 17, 1,1992, p51. 28. Briscoe B, Gritsis D, Kelly C, Khojasteh P, Liatsis D, Zakaria S. Diffusion in Polymers,
York, 1991, Proceedings, p6/1. 29. Keller J U, Rave H, Staudt R. Macromolecular Chemistry and Physics, 200, 10, 1999,
p2269. 30. Wiff D R, Roach J F. Polym. Eng. Sci., 41, 12,2001, p2200. 31. Flaconneche B, Klopffer M-H, Martin J, Taravel-Condat C. Oilfield Engineering with
Polymers, London, 28-29* November 2001, Proceedings, P81. 32. Davis P K, Lundy G D, Palamara J E, Duda J L, Danner R P. Industrial and Engineering
Chemistry Research 43, 6,2004, pi537. 33. ISO 2528, 1995. Sheet materials - Determination of water vapour transmission rate -
Gravimetric (dish) method. 34. ASTM E96,2000. Standard test method for water vapor transmission of materials. 35. ISO 6179, 1998. Rubber sheets and rubber coated fabrics - Determination of transmission
rate of volatile liquids (gravimetric technique). 36. ASTM D814, 1995 (2000). Standard test method for rubber property - Vapour
transmission of volatile liquids. 37. ASTM F1249, 2001. Standard test method for water vapor transmission rate through
plastic film and sheeting using a modulated infrared sensor. 38. Demorest R L, Mayer D W. TAPPI Polymers, Laminations and Coatings Conference,
Boston, 8-12* September 1996, pi29. 39. Dutt O, Lavallee C, Ashton H E. J. Test. Eval., 21,3, 1993, pl99. 40. Gibson P, Rivin D, Berezin A, Nadezhdinskii A. Polymer Plastics Technology and
Engineering, 38, 2, 1999, p221. 41. Hes L, Bernardo C A, Queiros M A. Polym. Test., 15, 2, 1996, pi89. 42. Ogawa T, Nagata T, Hamada Y J. Polym. Sci., 50, 6, 1993, p981. 43. Delbarre P. ANTEC 2002, San Francisco, 5-9th May 2002, Proceedings, Paper 296. 44. Nguyen X Q, Nguyen Q T, Clement R, Uchytil P J. Appl. Polym. Sci., 54, 13, 1994,
p2023. 45. Twardon G, Twardon F, Lux H-P. ANTEC 98, Atlanta, 16-30* April 1998, Proceedings
p2647. 46. Yan Feng, Honnma S, Ito A J. Appl. Polym. Sci., 63,4, 1997, p433. 47. Barson C A. Diffusion in Polymers, York, 1991, Proceedings, p22/l. 48. Hinestroza J, De Kee D, Pinatauro P N. Industrial and Engineering Chemistry Research,
40,9,2001,p2183.

Chapter 18
ADHESION, CORROSION AND STAINING
Rubber is frequently used as a composite with other soHds, for example in tyres, belting and coated fabrics, or may be in contact with other solids during use. The testing of composite materials or products containing rubber is, in general, outside the scope of this book but certain tests which are usually considered to be 'rubber tests' are included here. These are adhesion to metals, adhesion to fabrics, adhesion to cord, corrosion of metals and paint staining.
Adhesives and adhesion are of course very large subjects that are by no means restricted to polymers, let alone rubbers. There are numerous test methods for characterizing and measuring the performance of adhesives which may be relevant to rubber but they are outside the scope of this chapter.
1. ADHESION TO METALS
Rubber is bonded to metal during processing to form a variety of products and in most cases a very strong bond is necessary for the product to perform satisfactorily. It is usually desirable to measure bond strength by testing the actual product but this is not always possible or convenient and, particularly for evaluating bonding systems, there is a need for tests using standard laboratory prepared test pieces. Whether the product or a test piece is used, the bond should be strained in essentially the same manner as would occur in service, although this may be complex rather than, for example, in simple tension or shear.
Some possible modes of straining for laboratory test pieces are illustrated in Figure 18.1. With peel and direct tension tests, failure tends to occur in

364 Physical testing of rubber
the rubber if the bond strength is high. It can be argued that if the bond is stronger than the rubber it is strong enough, but this attitude assumes that failure would be similar with another mode of straining and may not allow discrimination between a good and a very good bond. The tension test with cone-shaped metal end pieces was developed to encourage failure at the interface between rubber and metal because of a stress concentration at the tips of the cones.
RUBBER,
RUBBER
(b)
METAL
CEMENT
RUBBER
(d)
RUBBER
Figure 18-1. Rubber to metal bond strength, modes of straining, (a) 90^ peel; (b) shear; (c) direct tension; (d) direct tension with conical end pieces.
It is usual to report the type of failure as well as the numerical value of the bond strength. Symbols are commonly used as follows:
R = failure in the rubber. RC = failure at the interface between the rubber and the cover cement. CP = failure at the interface between the cover cement and the primer cement. M = failure at the interface between the primer cement and the metal. In practice, it is not always possible to distinguish between RC and CP
and in any case a single coat bonding system might have been used.

Adhesion, corrosion and staining 365
1.1 Standard methods
Test methods have been standardised internationally for peel, direct tension, shear and 'tension' with conical ends.
1.1.1 Peel tests
The method given in ISO 813 Ms a 90° peel test using a test piece, 6±0.1 mm thick and 25±0.1 mm wide, bonded to a 1.5 mm thick metal strip along 25 mm of its length. The rubber is peeled at 50±5 mm/min using (preferably) a low inertia tensile machine, having first started to strip the rubber from the metal using a sharp knife. This rather dubious procedure of cutting at the bond line is intended to lessen the probability of failure in the rubber and the standard states that if the rubber starts to tear during the test it shall be cut back to the metal.
The maximum force during stripping over 25 mm length expressed per mm of width is taken as the bond strength. It is suggested that an autographic recording of the strength over the 25 mm length is taken but no account taken of the possibility of the trace exhibiting several peaks and troughs. A brief annex mentions the possibility of making tests at a series of temperatures and test speeds and producing plots on semi-log paper. Despite the relatively recent date, this standard has not really been fully revised.
The British Standard, BS 903:Part A21.1^ is identical to ISO 813. The ASTM equivalent is D429^ method B which is also essentially the same as the ISO method but gives the test piece thickness as 6.3 mm, i.e. retaining the direct conversion from Imperial units. ASTM D429 Method E also uses peel geometry for tests intended for tank linings. There is the choice of a simple dead load test or pulling at 90^ at a speed of 50 mm/min. Why a second peel method and an archaic dead weight method are needed is not immediately obvious.
The basic method is a closely specified test intended for quality control or the comparison of bonding systems, but could readily be extended to investigate the effects of test piece dimensions, peeling angle, test speed, etc.
The measured adhesion strengths from peel tests are lower than those from tension tests and the theoretical aspects of this have been discussed by Kendall" . Choosing 90 for the peal test is to some extent arbitrary and Gent and Kaang^ have investigated the effect of peel angle for adhesive tapes. Orthman^ studied the ISO method and found that a great deal of the scatter in results could be attributed to the direction of peeling relative to any pattern on the metal plate, and proposed a modified test piece with which peeling could take place in two opposite directions.

366 Physical testing of rubber
1.1.2 Tension tests
The international standard method given in ISO 814^ uses a disc test piece 3±0.1 mm thick and between 35 and 40 mm in diameter, bonded to metal plates which are approximately 0.1 mm less in diameter than the rubber. The slightly smaller size of the metals is intended to prevent the rubber tearing from the edges of the metals during test.
The assembly is separated at 25 mm/min in a tensile machine and great care must be taken to ensure that the test piece is accurately aligned so that the tension is uniformly distributed over its cross section during test. Any misalignment will tend to introduce a peeling action. In practice, the stress at the rubber/metal interface does not remain even because shear forces are introduced as the rubber deforms under tension. Because of this, the measured bond strength depends on the shape factor (see Chapter 8, Section 6) of the rubber disc, the strength increasing with decreasing thickness^. The result is expressed as the maximum force divided by the cross-sectional area of the test piece.
The equivalent British Standard, BS 903:Part A21.2^ is identical to ISO 814. The ASTM equivalent, D429, Method A^ is very similar but uses slightly different test pieces dimensions - 3.2 mm thickness, diameter fixed at 39.9 mm and the metal disk the same diameter as the rubber. ASTM has gone all purist here and speed is given as 0.4 mm/s.
ASTM D429 also has another direct tension procedure as Method D, which is for test pieces bonded after vulcanization (normally the bond is formed during curing of the rubber). Curiously, this differs from method A in that a compression set test piece is specified, but which one is not stated, and the speed is 0.83 mm/s.
Salitan et al ^ devised a very simple but clever modification to make gripping the direct tension assembly semi-automatic and to reduce its height.
A "tension" method using conical metal end pieces is standardised in ISO 4600^^ BS 903 Part A40^^ is identical and ASTM D429, Method C is very similar. The test piece diameter is 25 mm and the cone angle 45° but the distance between the tips of the cones is 12±1 mm in ISO and 11.5±1.2 mm in ASTM. An earlier draft of ISO 5600 had the tolerance as ±0.1 mm which perhaps implies that this dimension is critical. The grip separation rate is 50 mm/min (or 0.83 mm/s in ASTM) and the result is simply expressed as the maximum force recorded.
The test was investigated by Painter^^ who showed that the stress is concentrated at the tips of the cones. The stress distribution is not even and the action is not pure tension but involves peel and shear forces. Painter's results showed that failure occurred at the interface rather than in the rubber

Adhesion, corrosion and staining 367
and the measured strengths were lower than with a plain disc test piece of similar diameter, more in line with the results of peel tests.
ASTM D429 has a further tension test. Method F is somewhat similar to the conical end pieces method but the ends are convex and have slightly smaller diameter than the rubber (25 mm as opposed to 28.7 mm). The speed is 0.83 mm/s and the result given as a force. The advantages of this method have been reported by Rearick*" . The most important factor is that it is claimed to discriminate better between bonding agents than the other tension and peel tests. The reproducibility is said to be better than direct tension and only a little less good than peel and conical ends, while it is easier to apply the bonding agent than is the case for conical ends. The failure mode is shear at the outer edges of the test piece which is given as an explanation for the discriminating ability.
1.1.3 Shear tests
There was previously a separate ISO standard for adhesion in shear but this was withdrawn in favour of extending the standard for shear modulus to allow the test to be continued to the failure point, i.e. the two methods have been combined. The composite method is contained in ISO 1827 ^ and uses the same quadruple element test piece as did the separate adhesion standard. The double sandwich construction is intended to provide a very stiff test piece which will remain in alignment under high stresses. The present standard quadruple test piece uses rubber elements 4±1 mm thick and 20±5 mm long and these tolerances are much less tight than previously. The measured adhesion strength in shear is less affected by the test piece shape factor then tension tests^ and the wider tolerances should be perfectly satisfactory. The test piece is strained at a rate of 50 mm/min, in line with the speed for most other adhesion to metal tests, and the result expressed as the maximum force divided by the total bonded area of one of the double sandwiches. The British equivalent BS 903 Part A 14 ^ is identical.
The same geometry is used in ASTM D429 Method H but the adhesion force is not measured. Instead, after applying a pre-strain, a nylon block is inserted between the two centre metal elements and the assembly exposed to any specified ageing environment. After periods of exposure under strain, the degree of debonding is measured.
ASTM D429 Method G uses the same principle of exposing a test piece under strain, but in this case the geometry is a double shear test piece (in series, not parallel) and the strain maintained by a special jig. The development and application of this method has been reported^ .
Methods G and H are obviously not directly comparable with the other adhesion methods. They could be called static fatigue tests, or perhaps creep

368 Physical testing of rubber
tests, but their prime objective is apparently the exposure to an aggressive environment. Logically, other adhesion test geometries could be used with a pre-strain and/or exposed to periods of ageing, whilst method H could be used to measure adhesion strength as in the ISO standard. The geometry of method G is not designed for strength measurement. The use of the quadruple shear test piece to predict performance of a cylindrical bonded bush with exposure to various atmospheres has been investigated^^.
1.2 Other Methods
It is worth remembering, and this is applicable also to adhesion to fabrics or any other substrate, that adhesion is only a tiny part of testing rubbers whereas it is the prime consideration for adhesives. Hence, for a fuller understanding of the relevance and limitations of adhesion tests as well as for alternative test methods it is suggested that reference should be made to the great volume of literature from that industry.
The mechanics and shortcomings of some of the commonly used tests for adhesives generally have been considered by Adams^ . Gent ^ analysed the direct tension and peel tests for rubbers, while more recently Muhr et al ^ studies fracture mechanics of peel, rod pull out and simple shear test pieces for natural rubber to metal. BS 903-5^^ gives relations for obtaining tearing energy from peel and rod pull out tests. It notes that for directionally stable crack growth the tear angle should be much less than is commonly used, and for rod pull out the criterion to avoid friction contribution is given. Aubrey et al ^ made a systematic study of the most commonly used methods and developed a procedure for industrial laboratories to predict strength and lifetime of bonded components.
With very good bonding systems, it is often difficult to discriminate between the systems because of failure in the rubber and yet in service differences in performance may be evident. This situation was recognised by Buist et al ' "* who made comparisons of various methods and observed that, in service, bonds may be subjected to impacts (i.e. high strain rates) or to repeated dynamic cycling (fatigue). Neither of these factors is considered in the standard methods discussed above.
Buist and Naunton^ suggested impact methods based on Izod and falling weight apparatus, preferring the falling weight apparatus, with each test piece receiving a single blow. With the particular case of automobile bumpers in mind. Given and Downey^^ developed a high speed test using a double element shear test piece and a sophisticated servo-hydraulic universal test machine.
Impact methods can be used to test fatigue resistance of bonds by making repeated blows but this is not very convenient. Buist and Naunton^ used the

Adhesion, corrosion and staining 369
Goodrich Flexometer (see Chapter 12) with a modified test piece holder to fatigue bonds in tension and were able to discriminate between bonding systems which appeared equal in the standard tension test. Buist et al "* used the Goodrich Flexometer in compression prior to making the standard tension test and also developed a slow speed cycling test in shear. Beatty^^ used a modified 'Rotoflex' machine which fatigues the bond by bending. Modem universal tensile machines would seem very convenient for dynamically testing bonds in various modes of straining and at different strain rates but it is costly to utilise such machines in this way. Many ad hoc rigs have been constructed to test bonded components and it would seem reasonable to develop a fairly simple dynamic apparatus to fatigue standard test pieces. A rod pull out test has been described by, for example, Khromov and Yakovleva^^ and this test piece could presumably be tested dynamically. A BRMA publication^^ which gives recommendations for testing rubber to metal bonded components in general, suggests conditions for carrying out dynamic tests.
In service, rubber to metal bonds are often required to withstand harsh environments. Dillard et al ^ considered several techniques to evaluate the effect of corrosive conditions and Bjork and Stenberg^^ found loading during exposure to be better than unstrained exposure for determining the effect of water. Ostman and Persson^^ in a study of the effect of metal surface texture also found a creep peel method the most effective. These approaches are reflected in the ASTM D429 Methods G and H discussed above.
Campion^^ has described a double peel method to minimize the unwanted dissipation of energy other than for directly debonding. The two peel test pieces are attached back-to-back such that when pulled they rotate and the peel angle varies. Lawrence et al ^ devise a method combining pure and simple shear that could produce failure very close to the rubber/bonding agent surface. Lawrence and Lake " have also described a robust testing facility for an industrial environment. Alternative procedures of blister tests and double cantilever beam test pieces for elastomers have been described by Dillard et aP^
1.3 Non-Destructive Tests
To be able to estimate bond strength by a non-destructive method is extremely attractive, especially for quality control purposes. The possibility of using ultrasonics for this application has been recognised for a long time^^ and efforts have been made to standardise a procedure for the inspection of such components as engine mountings.
Basic ultrasonic flaw detection operates on the principle that the amount of ultrasonic energy transferred from one material to another is related to the

3 70 Physical testing of rubber
difference between their acoustic impedances. For example, at a rubber/air interface there is a large difference in acoustic impedance and less ultrasonic energy will be transmitted than at a well-bonded rubber to metal interface. Hence, if there is an area of debonding at the rubber/metal interface and there is a thin layer of air or a vacuum between the two this can be detected by loss in the transmitted, or increase in the reflected, ultrasound.
Attractive and simple as the technique is in theory, in practice there are a number of difficulties which severely limit its value. Only areas of disbond, not a weak bond, can be detected although very weak areas can be made to part by pre-stressing, which is in any case necessary to separate the debonded areas. Notwithstanding these remarks, there have been considerable developments in ultrasonic flaw detection over the years although there has not been any widespread adoption of the technique in the rubber industry generally.
Other non-destructive tests have been suggested to estimate bond quality, but such techniques as holography and radiography, and also ultrasonics, have mostly been used in the rubber industry for detection of flaws in tyres. It is not considered appropriate to cover non-destructive flaw detection in general here but an account of applications to polymers has been given by Gros in Handbook of Polymer Testing^ .
2. ADHESION TO FABRICS
Rubber is used as a composite with textile fabrics in such products as belting and hose and also as a coating on the fabric to form 'proofed' materials.
Tests for adhesion are carried out in peel or direct tension, peel being the most common, although tension tests are particularly useful for thin coatings where the rubber is too thin or too weak to successfully carry out a peel test.
2,1 Peel Tests
The international method, ISO 36^ , for adhesion strength of rubber to fabrics uses a 25 mm wide strip test piece, long enough to permit separation over at least 100 mm. The fabric and rubber are separated by hand over a length of about 50 mm and the two ends placed in the grips of a tensile testing machine. The grips are separated at a rate of 50±5 mm/min so as to give a rate of ply separation of 25 mm/min.
The angle between the two gripped 'legs' of the test piece is nominally 180° (see Figure 18.2). The plies should separate at a sharp angle but this will depend on the thickness and stiffness of the phes. The standard suggests

Adhesion, corrosion and staining 371
that the thickness should be reduced if necessary so that the hne of separation of the pHes Ues as closely as possible to the plane of the axis of the 'legs' of the test piece held in the grips. The unstripped portion of the test piece is left to find its own level during the test but variation in the angle (Figure 18.2) will affect the measured result. The angle depends on the relative stiffness of the plies B and C, the greater the stiffness ratio B/C the nearer the angle approaches 180°. It would seem better to restrain the unpeeled portion A so that a is either 90° or 180°.
B
a /
Figure 18-2. Rubber to fabric peel test
The stripping force is recorded continuously so that a trace as shown in Figure 18.3 is obtained. How to obtain the adhesion value from this trace has been the subject of much debate. However, consensus was reached and since 1985 reference is made to ISO 6133^^ which has five procedures, for traces having less than five peaks, 5 - 2 0 peaks, more than 20 peaks, undulating traces and large number of peaks too close for counting, respectively, which has already been discussed in Chapter 8, Section 9.4. It should be noted that the peaks, and especially the troughs, are affected by the dynamic response of the test machine' '' ^ For this reason, only measuring systems having very low inertia should be used for this test.
The equivalent British Standard, BS 903:Part AH'^^ is identical to ISO 36, and ISO 6133 is reproduced as BS ISO 6133. ASTM D413^^ contains a method similar to ISO 36 but also has methods for 90^ peel of strip and ring test pieces. A ring could be obtained from a product such as hose, and the ASTM standard is realistic in putting some emphasis on the test pieces

372 Physical testing of rubber
coming from products with various thickness of the plies. The speeds are dependent on the method, 0.8 mm/s for 180 , 2.5 mm/s for 90^ and 0.4 mm/s for rings, but the logic is not too clear.
Figure 18-3. Example of stripping force trace.
ASTM D413 also gives simple dead load methods for adhesion strength whereby a mass, large enough to cause peeling, is hung from one leg of the test piece and the rate of separation noted. The problems of interpreting the results are discussed but tensile machines are common enough that there would seem to be little use for this type of procedure.
Because coated fabrics are generally dealt with in separate standards committees, and because the thinner coatings are not strong enough to allow the use of the peel methods described above, separate standards have been developed for these products. The problem of failure in the coating is overcome by using reinforcements of fabric or cement. These methods are really product tests and outside the scope of this book but the appropriate references can be noted. The international standard for coated fabrics is ISO 2411' ^ the British methods are identical as BS EN ISO 2411 and the ASTM methods are in D751' ^ There are also methods for conveyor belts in ISO 252-1^^
When using peel tests on such products as belts to separate the plies, it can be difficult to obtain interfacial failure. Loha et al" ^ successfully used test pieces including a perforated metal sheet at the interface to measure rubber to rubber adhesion strength.

Adhesion, corrosion and staining
2.2 Direct Tension Tests
373
Borroff and Wake' ^ and later Meardon" , developed a direct tension method which was claimed to more nearly measure the 'true' adhesion between fabric and rubber. It is particularly useful for discriminating between adhesive systems, when the peel tests can be misleading. The main objection to the method is practical in that the preparation of test pieces is rather difficult.
The method is covered in ISO 4637^ . The test piece consists of two metal cylinders, 25 mm diameter, between which the composite to be tested is cemented (see Figure 18.4). The metals are gripped in a tensile machine and separated at a rate of 50 mm/min and the maximum force recorded. The most important part of the test is the preparation of the metal/rubber/fabric test piece and international interlaboratory tests showed that, unless very careful preparation of the metals was carried out, failure occurred at the metal surface. ISO 4637 gives considerable detail on surface preparation; after machining, the ends are lapped and degreased with trichloroethylene whilst the test piece is wiped with a solution of ammonium hydroxide in acetone. The assembly is cemented together with a cyanoacrylate adhesive using a special jig and it should be noted that the piece of fabric/rubber under test is a square of side approximately 32 mm and, hence, larger than the metal cylinders.
r—^- - -^^^
' ^ ^ ^ ^ ' ^ - - ^ _ ^
Figure 18-4. Direct tension adhesion test: A is the rubber-fabric test piece; B and B' are metal cylinders; C is adhesive.
ISO 4637 was developed from the British standard, BS 903:Part A27^\ which was eventually revised to be identical with the international method. It is one of those regrettable lapses in standardisation that this revision had to

3 74 Physical testing of rubber
wait seventeen years and seven years after the international method was pubhshed.
2.3 Dynamic Tests
A dynamic ply separation test is really a fatigue test on the rubber/fabric composite to weaken the bond or to determine the number of cycles until the bond fails. The relative bond strengths of different rubber/textile systems may be different in dynamic and static tests. It would, hence, seem important to assess any composite that will be subjected to fatigue in service by a dynamic method. In principle any flexing test (see Chapter 12) could be used but there is little evidence of particular methods being standardised. The notable exception is the Scott flexer detailed in ASTM D430^^ which is specifically intended for testing ply separation of belts and tyres etc, and tests for adhesion to cord considered in Section 3 below. Tests for fatigue of coated fabrics and other specific composite products are outside the scope of this book.
3. ADHESION TO CORD
The adhesion of cord, textile or metal, to rubber is a specialised measurement in that virtually all interest centres on tyres and to some extent belting. Most static tests consist essentially of measuring the force to pull a cord out of a block of rubber into which it has been vulcanised and it is apparent that the result is critically dependent on the efficiency with which the test piece was moulded. The measured force is also dependent on the amount that the rubber deforms during the test.
A great deal of effort has been put into improving the procedure for test piece production and to finding the best test piece and supporting jig geometry and, largely because of various experts favouring different variations on the basic theme, progress to international standardisation was slow.
The "original" method, the H-puU or "H-block" test, was first standardised by ASTM together with a variant, the "U" test. In the former, two blocks of rubber are gripped in the tensile machine and in the latter a loop of cord is hooked onto one of the grips.
An international version of the H-puU test for textile cord was published as ISO 4647^^ in 1982 and the method for steel cord, ISO 5603^^ in 1986. It is perhaps a reflection of the responsible ISO committee being concerned with rubber testing generally, and not having any specific expertise in tyres, that the methods have not been revised since. In the steel cord method the

Adhesion, corrosion and staining 375
block of rubber is held in one grip and the cord held in the other grip. Factors affecting the measured adhesive strength and improvements to the standard methods have been discussed by, for example, Hicks et al , Skolnik^^ and Campion and Redmond ' . ISO 5603 contains two methods of moulding, the second being of ASTM origin and the first results from the work of Campion in particular.
BS 903:Part A48^^ is identical to ISO 4647 and Part A 56 ^ identical to ISO 5603. It is significant that the equivalent ASTM standards are not produced under the auspices of the committee for rubber but in a subcommittee of the textiles committee specifically covering tyre cord and fabrics. The H-test is in D4776^^ and the method for steel cord in D2229^\ There is also a method for strap peel adhesion test of reinforcing cords or fabric in D4393^l
One of the main points of debate with the above methods is the stress distribution due to gripping the rubber block. Nicholson et al ' " used a test with two cords embedded in the block of rubber and avoided holding the block in one grip of the testing machine. Further analysis was made by Brodsky^^ who used three cords. Ellul and Emerson^^ ^ used cords embedded in steel enclosed rubber cylinders with alternatively hot and cold bonding. Ridha et al ^ have calculated the stress fields in tyre cord adhesion test pieces and Mollet ^ has compared the various methods. Adonian' ^ considered the effect of sample geometry on mechanical characteristics.
Tyres are very definitely fatigued during use and, as mentioned for fabric/rubber adhesion above, it is very important to carry out dynamic tests to assess bond efficiency. Methods have not apparently been standardised but a variety of procedures have been reported'' ' ^ Some workers have used the same or a similar test piece as in static tests and applied a cyclic tensile stress or strain, whilst others have used some form of fatigue tester operating in compression/shear to repeatedly stress or strain cord/rubber composite, or even to flex samples in the form of a belt. Khromov and Lazareva^^ describe a method using test pieces cut from tyres.
4. CORROSION OF, AND ADHESION TO, METALS
Some rubber compounds can cause corrosion of, and tend to stick to, metal surfaces with which they are in contact, and corrosion can even be caused to a metal in close proximity but not touching the rubber. Although not a very widespread problem, there has been sufficient concern, particularly for some military applications, for tests to be devised to assess the relative degree of corrosion and adhesion caused by different compounds.

3 76 Physical testing of rubber
Most tests are based simply on placing the rubber in contact with metal under load, ageing for a period under specified conditions and assessing corrosion and adhesion by visual inspection. It has proved rather difficult to obtain good reproducibility and it is essential that great care is given to the preparation of samples, in particular as regards cleanliness. An international standard method has been published as ISO 6505^^ in which rubber strips are sandwiched between the metals of interest (usually copper, brass, aluminium or mild steel) under a load of 10 kg and clamped. The sandwich is normally aged under relatively dry conditions, for example 7 days at 70°C, and then visually examined for signs of adhesion or corrosion.
At the time of writing, a revision of ISO 6505 is nearing completion which adds an 0-ring test piece and makes provision for tests in a very humid atmosphere. This arises from O-rings exposed to 90% relative humidity being specified in product standards. There have been editorial problems in developing the revision but it is intended that either test piece can be used either wet or dry with a choice of length of exposure.
The same method is given in BS 903:Part A37^^ which also contains a national annex giving a second method for assessing the degree of corrosion when the rubber is not in contact with the metal. Zinc is used as the standard metal as this is fairly readily corroded. A strip of zinc and the rubber test piece are both suspended over distilled water in a stoppered container maintained at 50°C. After a period of three weeks, the corrosion products are removed from the zinc by immersion in chromium trioxide solution and the loss in weight used as the measure of degree of corrosion. This is a very sensitive method but even more care has to be taken than in the contact method to avoid contamination and to obtain reproducible results.
5. STAINING
Paint or other organic materials can become stained by rubber in contact with them or by water which contains leached out constituents of the rubber. Heat and/or light may intensify the degree of staining. The staining is caused particularly by such ingredients as anti-oxidants, and the problem for the compounder is to achieve adequate environmental resistance without an unacceptable degree of staining. Staining is important in such consumer products as cars and kitchen appliances and, although no staining would be ideal, in practice some staining may have to be tolerated. Hence, tests to produce and measure staining are often included in specifications for products such as door seals.

Adhesion, corrosion and staining 377
5.1 Definitions
A variety of test procedures have been in fairly widespread use for many years, virtually all of them being subjective in that visual assessment of the degree of staining is used. There has also been considerable confusion over the use of such terms as migration staining, which has been used differently in different commercial standards, so that it was particularly helpful when an international standard was published.
As defined in ISO 3865^ : Contact stain is the stain which occurs on the surface directly in contact
with the rubber. Migration stain is the stain which occurs on the surface surrounding the
contact area. Extraction stain is the stain caused by contact with liquid containing
leached-out constituents of the rubber. Penetration strain is the staining of a veneer layer of an organic material
bonded to the rubber surface. It must be noted that the stain on the surface directly in contact with the
rubber is always contact stain even if the stain has to be intensified by exposure to light after removal of the rubber, whilst any stain outside the area of contact is always migration stain.
To distinguish between colour changes caused by ageing of the paint rather than by the rubber a blank test assembly may be used. A blank is an assembly prepared and tested in the same manner as the samples under test but the rubber is replaced by an inert material such as aluminium.
By contrast, a reference sample is a test assembly using the rubber under test but which is protected from light during any irradiation exposure period and is, hence, used to distinguish between the effects of light and heat.
5.2 Procedure
Contact and migration stain are generally measured at the same time. In ISO 3865, the rubber test piece in the form of a rectangle cut from sheet is sandwiched between painted metal panels (or other test material) and stored at 70°C for 24 h. One panel is then examined for both contact and migration stain and the other panel is exposed, without the rubber test piece, to artificial light before re-examination. If required, only the heat exposure may be carried out or, alternatively, the panel and test piece can be exposed to artificial light having omitted the heat ageing stage and the panel examined for migration staining. It is usual to carry out the full procedure.
For extraction stain, distilled water is dripped on to the test piece held at 30° to the horizontal so that the water runs down the test piece on to the

3 78 Physical testing of rubber
painted panel. A segment of filter paper and a cotton cord conduct the water along the panel into a drip container. One litre of water is dripped over a period of 24 h after which the panel is examined for staining. Optionally, the panel can be exposed to artificial light before re-examination. An alternative procedure is to immerse test pieces in water for 24 h and then replace them with painted panels for a further 24 h.
For penetration stain, a 0.5 mm thick veneer of white, non-discolouring rubber, is applied under pressure to a sheet of the test rubber and the composite vulcanized. A test piece cut from the composite sheet is exposed to artificial light and examined for staining. The composition of the white veneer is left for agreement between the interested parties. Alternatively, part of a finished product incorporating a veneer may be used or the rubber test piece without the veneer coated with a non-staining white laquer.
The only light source now specified is a xenon lamp, as used for artificial weathering tests, and 24, 48 or 150 h is suggested as the exposure time with a surface temperature of 55±3°C. Previously, a mercury lamp was also allowed when exposure times of 2, 4 or 8 h were suggested. It is extremely doubtful that the two sources will give equivalent effects. Variations in the light dosage and in surface temperature during exposure are likely to be important in cases of slight staining but it is a pity that there is not provision for a less expensive light source. The use of fluorescent tubes would seem reasonable.
At the time of writing, a revision of ISO 3865 is almost complete which in most respects should be relatively little changed technically. The option to only expose to light for contact and migration staining is being deleted as it is a somewhat pointless exercise. If the panel discoloured without any rubber it would do so all over.
5.3 Assessment of Staining
ISO 3865 allows the degree of staining to be assessed by eye, by eye with the help of a grey scale, or by using a reflectance spectrophotometer, but in practice the purely visual method is almost exclusively used. Many interlaboratory disputes are a result of lack of objectivity on the part of the operator, particularly if it is his/her material which has stained badly. In principle, the instrumental method is much superior and interlaboratory tests have shown that relatively simple spectrophotometers can give satisfactory results. Unfortunately, due to the small area of staining, simple spectrophotometers are not suitable for assessing migration and extraction stains and for many applications these are the most important types of staining.

Adhesion, corrosion and staining 379
5.4 Other Standards
BS 903:Part A33^^ is identical to ISO 3865. ASTM D925^^ has methods for contact, migration and diffusion (equivalent to penetration) staining. The contact stain method is similar to ISO 3865 except that there is no provision for developing the stain by exposure to light. Migration stain is not measured at the same time.
The migration stain method omits any exposure to heat so that the paint panel and rubber are exposed only to artificial light. This separation of procedures for contact and migration stain tends to give the impression that contact stain is produced by heat and migration stain by light, which is not true. Light will intensify both contact and migration stain. Only a specific sun lamp light source is specified in ASTM and the requirements are given in considerable detail. This is obviously desirable from a standardisation point of view, although a little restrictive, and avoids the expense of a xenon arc.
The ASTM diffusion (penetration) stain method is similar to that in ISO 3865 but more detail is given on preparation of the veneer, including a formulation.
There have been suggestions that a further method is needed to measure staining caused by the close proximity of the rubber without actual contact. This type of staining can occur, for example, in the boot of a car due to airborne migration of constituents of the spare tyre and tests have been devised by individual motor companies.
REFERENCES
1. ISO 813, 1997. Determination of adhesion to a rigid substrate - 90^ peel method 2. BS 903: Part A21.1,1997. Adhesion to rigid substrates - 90^ peel method. 3. ASTM D429,2003. Rubber property - Adhesion to rigid substrates. 4. Kendall K. J. Adhesion, 5, 1, 1973, p77. 5. Gent A, Kaang S Y. J. Adhesion, 24, 2-4, 1987, pi73. 6. Othman A B. Polym. Test, 8, 4, 1988/89, p289. 7. ISO 814, 1996. Determination of adhesion to metal - Two plate method. 8. Buist J M and Naunton W J S. Trans. IRI, 25,378, 1950. 9. BS 903: Part A21.1, 1997. Determination of rubber to metal bond strength - Two plate
method. 10. Salitan E M, Kulakova G V, Mashina I A. Int. Polym. Sci. and TechnoL, 17, 4, 1990,
pT82. 11. ISO 5600, 1986. Determination of adhesion to rigid materials using conical shaped parts. 12. BS 903:Part A40, 1988. Determination of adhesion to rigid materials using conical shaped
parts. 13. Painter G W. Rubber Age N.Y., 86, 262, 1959. 14. Rearick B A. ACS Rubber Division Meeting, Pittsburgh, 11-14 ^ October 1994, Paper 62.

380 Physical testing of rubber
15. ISO 1827, 1991. Determination of modulus in shear or adhesion to rigid plates -Quadruple shear method.
16. BS 903 Part A 14 1992. Determination of modulus in shear or adhesion to rigid plates -Quadruple shear method.
17. Hansen P, Thompson B. Polymer Bonding Conference, Munich, 27-28^^ April 2004, Proceedings, p51.
18. Fernando M, Forge C, Clarke J. Polymer Bonding Conference, Munich, 27-28* April 2004, Proceedings, p39.
19. Adams R D. Euradh Conference, Karlsruhe, Germany, 21-24* September 1992, Proceedings, p40.
20. Gent A N. Rubber World, June 1979, p 33. 21. Muhr A H, Thomas A G, Varkey J K. J. Adhesion Sci. Technol., 10, 7, 1996, p593. 22. BS 903-5, 2004. Guide to the application of rubber testing to finite element analysis. 23. Aubrey D W, Southern E, Harman A D. PED Review Meeting, Loughborough, 1985,
Paper 52. 24. Buist J M, Meyrick T J and Stafford R L. Trans. IRI, 32,149, 1956. 25. Given D A and Downey R E. Polym. Sci. Tech., 9A, ACS Symposium Philadelphia, Pa.,
April 1975, p.315. 26. Beatty J R. ACS Div. Rubb. Chem. Fall Meeting, 1973, Preprint 42. 27. Khromov M K and Yakovleva T L. Kauchuk I Rezina, No. 12,48, 1976. 28. BRMA Publication: Testing of Rubber to Metal Bonded Components, 1982. 29. Dillard D A, Leichti K M, Lefebvre D R, Lin C, Thornton J S. Adhesively Bonded Joints,
Testing, Analysis and Design, Baltimore, 1986, Proceedings p 83. 30. Bjork F, Stenberg B. Polym. Test., 6, 5,1986, p369. 31. Ostman E, Persson S. Int. J. Adhesion & Adhesives, 10, 2, 1990, pl02. 32. Campion R P. ACS Rubber Division Meeting, Cleveland, 21-24* October 1997, Paper 24. 33. Lawrence C C, Lake G J, Thomas A G. Adhesion 99 conference, Cambridge, 15-17*
September 1999, Proceedings, p257. 34. Lawrence C C, Lake G J. Polym. Test., 20, 3,2001, p339. 35. Dillard D A, Liechti K M, Lefebvre D R, Chih Lin, Thornton J S, Brinson H F. ASTM
Special PubHcation STP 981, 1988, p83. 36. Heughan D M. and Sproule D O. Trans. IRI, 29, 5, 1953, p255. 37 Gros X E. In Handbook of Polymer Testing (Brown R P Ed.), Marcel Dekker, New York,
1999. 38. ISO 36, 1999. Determination of adhesion to textile fabric. 39. ISO 6133, 1998. Analysis of multi-peak traces obtained on determinations of tear strength
and adhesion strength. 40. Pickup B. Proc. 3rd Rubb. Tech. Conf, Cambridge, 1954, p.439. 41. Eagles A E and Norman R H. Rubb. J. Int. Plastics, 135,189,1958. 42. BS 903:Part A12, 1999. Determination of adhesion to textile fabric. 43. ASTM D413, 1998 (2002). Rubber property - Adhesion to flexible substrates. 44. ISO 2411,2000. Rubber or plastics coated fabrics - Determination of coating adhesion. 45. ASTM D751,2000. Test methods for coated fabrics. 46. ISO 252-1, 1999. Textile conveyor belts - Adhesive strength between constitutive
elements. Part 1 Methods of test. 47. Loha P, Bhowmick A K, Chakravarty S N. Polym. Test., 7,3, 1987, pl53. 48. Borroff E M and Wake W C. Trans. IRI, 25, 199, 1949. 49. Meardon J I. Rubb. and Plast. Weekly, 142,107,1962. 50. ISO 4637, 1979. Determination of rubber to fabric adhesion - Direct tension method.

Adhesion, corrosion and staining 381
51. BS 903:Part A27, 1986. Determination of rubber to fabric adhesion: direct tension method.
52. ASTM D430, 1995 (2000). Rubber deterioration - Dynamic fatigue. 53. ISO 4647,1982. Determination of static adhesion to textile cord - H-puU test. 54. ISO 5603, 1986. Determination of adhesion to wire cord. 55. Hicks A E, Chirico V E and Ulmer J D. Rubb. Chem. and Tech., 45,1, 1972, p26. 56. Skolnik L. ACS Div. of Rubb. Chem. Fall Meeting, Denver, October 1973, Paper 13. 57. Campion R P and Redmond G B. Rubb. Ind., 9, 1, 1975, pl9. 58. BS 903:Part A48,1984. Determination of static adhesion to textile cord - H-pull test. 59. BS 903 Part A 56, 1989. Determination of adhesion to wire cord. 60. ASTM D4776, 2004. Standard test method for adhesion of tire cords and other reinforcing
cords to rubber compounds by H-test procedure. 61. ASTM D2229, 2004. Standard test method for adhesion between steel tire cords and
rubber. 62. ASTM D4393, 2004. Standard test method for strap peel adhesion of reinforcing cords or
fabrics to rubber compounds. 63. Nickolson D W, Livingston D I and Fielding-Russell G S. Tire Sci. TechnoL, 6, No. 1,
1978. 64. Fielding-Russell G S, Livingston D I and Nickolson D W. Rubb. Chem. Technol. 53, No.
4, 1980. 65. Brodsky G I. Rubb. World, 190, No. 5, 1984. 66. Ellul M D, Emerson R J. ACS Rubber Division Meeting, Cleveland, 1987, Paper 36. 67. Ellul M D, Emerson R J. ACS Rubber Division Meeting, Cleveland, 1987, Paper 37. 68. Ridha R A, Roach J F, Erickson D E and Reed T F. Rubb. Chem. Technol. 54, No. 4,
1981. 69. Mollet J R. International Rubb. Conference, Paris, June 2-4,1982, Paper 012. 70. Andonian A. ACS Rubber Division Meeting, Cleveland, 21-24* October 1997, Paper 10 71. Lunn A C, Evans R E and Ong C J. ACS meeting, Cleveland, Oct. 13-16. 1981, Paper 20. 72. Bourgois L., Davidts J. and Schittescatte M. Text. Inst. Ind. 11, No. 1, 1973. 73. Campion R P and Corish P J. Plast. Rubb. Mat. Appln. 2, No. 2, 1977. 74. Kachur V and Weaver E J. ACS Meeting, Minneapolis, April 1976, Paper 2. 75. Hewitt N L. Rubb. Plast. News 15, No. 5, 1985. 76. Vorachek J J, Causa A G and Fleming R A. ACS Meeting New Orleans, Oct. 7-10, 1976,
Paper 60. 77. Mitsuhashi K. Int. Polym. Sci. Technol., 8, 11, 1981, pT104. 78. Mitsuhashi K. Int. Polym. Sci. Technol, 9, 2, 1982, pT3. 79. Panchuk F O, Semak B D, Grabov I F, Oplochenko N A. Int. Polym. Sci. Technol, 17, 6,
1990, pT12. 80. Khromov M K, Lazareva K N. Int. Polym. Sci. Technol, 14,2, 1987, pT102. 81. ISO 6505,1997. Determination of tendency to adhere to and to corrode metals. 82. BS 903 .Part A37,1997. Determination of tendency to adhere to and to corrode metals 83. ISO 3865,1997. Methods of test for staining in contact with organic material 84. BS 903:Part A33,1998. Methods of test for staining in contact with organic material. 85. ASTM D925, 1988. Staining of surfaces (Contact, migration and diffusion).

INDEX
Abrasion 227-240 Accelerated ageing 300-312 Adhesion
to cord 375-376 to fabrics 370-374 to metals 363-370, 376-377
Adiabatic calorimeter 277 ADL tester 185 Air
conditioning 56 pressure ageing 302
Akron abrader 236, 240 American National Standards Institute 38 Amsden test piece 333 Apparent hardness 125-127 Apparent properties 9 Arrhenius relation 306, 310, 311 ASTM International 2, 38-39 Automation 21-22
Bagley correction 77 Bashore resilience 185 Biaxial extension 148-149 Biological attack 342-343 Blue wool standards 341
Bouncemeter 185 British Standards Institute 2,
36-37 Brittleness temperature 296-299 Buffing 47-49 Bulk compression 154
Calibration 17-18, 132 Capillary rheometers 76-77,
81,82 Clash and Berg apparatus 293 Coaxial cylinder viscometer 75 Compression plastimeters 67-71,
83 Compression set 213-215 Compression stress strain 149-
154 Conditioning 11,53-59 Cone and plate viscometer 75 Contact stain 377, 378, 379 Conti abrader 238 Corrosion of metals 376-377 Creep 202-204 CrystalUsation 299-300 Curemeters 82-88 Cut growth 246-254

384 Physical testing of rubber
Cutting dies 45-47 Cutting resistance 167-168
Dead load hardness tests 121-127
Defometer 69,70,81,82 Delft test piece 160, 162-163 Delta Mooney 74 DeMattia machine 246-248, 249,
338 Density 96-99 Design data 8 Dielectric constant 80,271 Dielectric vulcametry 88 Die swell 77, 78 Differential scanning calorimetry
(DSC) 88, 276-277, 278, 282, 290
Differential thermal analysis (DTA) 276,278
Diffusion staining 379 Dimensional stability 104 Dimensions 99-106 DIN abrader 234-236 Dispersion 104-106 DMTA 192, 194-195, 197 Double exponential distribution
146 Drop calorimeter 277 Dunlop abrader 238, 240 Dunlop pendulum 184,198 Dunlop tripsometer 183,184 DuPont abrader 236, 240 DuPontflexer 249 Durometers 80, 127-133 Dynaliser 195 Dynamic adhesion tests 369, 374
Effect of gases 326-338 of liquids 318-326 ofozone 327-338
Electric strength 269-270 EUipsometry 325 Elongational flow 79 Elongation measurement 141-145 European standards 34-35 Explosive decompression 327 Extensometers 142-145 Extraction stain 377, 378 Extruders 77-78 Extrusion rheometers 76-77,81,
82,
Failure investigation 8 Faraday ice pail 268 Finite element analysis 115-118 Firestone flexometer 255 Fire tests 343-344 FKK tester 238-239 Flex cracking 246-254 Flexometers 254-256 Flexural stress strain 158-159,
295 Flipper machine 246-247, 249 Flory-Rehner equation 318 Forced vibration methods
192-198 Force measurement 141 Fracture mechanics 166-167 Free vibration methods 186-191 Frick-Taber abrader 238 Friction 219-227 Functional properties 9 Fundamental properties 9
Garveydie 77-78 Gas permeability 351-356 Gavin grips 139 Gehman test 293-296, 298-299 Glass transition temperature
289-290 Goodrich flexometer 255-256 Goodyear-Healey pendulum

Index 385
183-184 Grasselli abrader 238 Green strength 90 Grips 139-140 Guarded hot plate 280
Hardness 118-133,203,298, 299-300
Hartshorn and Ward apparatus 272
Heat ageing 300-312 buildup 254-256 transfer coefficient 283-284
H-pull test 375 Humboldt penetrometer 80 Humidity cabinets 57 Hygrometers 57 Hysteresis 177
ILAC 17 Inclined plane 226 Intercal 19 Interlaboratory comparisons
18-20 International Electrotechnical
Commission (lEC) 34 International Standards
Organisation (ISO) 2,31-34 IRHD method 121-127,130-133
Laboratory Abrasion Machine 238, 240
Laboratory accreditation 17,20 Lamboume abrader 238, 240 Laser-optic triangulation 102 Lee's disk 279 Leroux pendulum 225 Limitations of results 16 Low temperature tests 291-300 Lucas apparatus 208-209 Lupke pendulum 182-183,184
Martindale abrader 238 Mass 95-96 Mechanical conditioning 11,
59-61 Microhardness 124-125, 127,
128,133 Microscopy 4, 102, 104-106 Migration stain 377, 378, 379 Mixing 41-43, 78-79 Modulus enhancement factor 211 Moist heat tests 317-318 Monsanto processability tester 77 Monsanto rheometer 83 Mooney-Rivlin relation 112-113,
115-116 Mooney viscometer 72-75,81,
82,83 Moulding 43-44 Moyal and Fletcher machine 196 Mullins effect 59
NBS abrader 237, 239 Newtonian flow 66 NMR imaging 325 Non-destructive testing 4,
369-370
Oil ageing 318 Oscillating die rheometer 79,
83-85 Oscillating disc rheometer 79-80,
83-85 Ovens 56-57,71-72,300-302 Oxygen
bomb 301, 302 diffusion 302-303 uptake method 303
Ozone 327-338
Paint staining 378-380 Peel tests 365-366, 369, 370-373

386 Physical testing of rubber
Penetratin stain 377, 378, 379 Permittivity 271-272 Philosophy of testing 7-11 Pico abrader 237 Plasticity 67-76, 80-82
retention index 71-72 Plasticorder 78 Pohle method 162 Poisson's ratio 114-115,154 Power factor 271-272 Product testing 24-26, 47-49 Processability 63-64 Pure shear 157 Pusey and Jones plastometer 127
Quality control 8 systems 16-20
Rabinowitsch correction 77 Radiation 244-245 Rapid plastimeters 69, 80, 81 Rapra sinusoidal strain machine
194 Reciprocating paddle curemeter
83-84 Relaxed modulus 147-148 Resilience 80, 181-185, 198,291 Resistance 260, 264-265,
267-268 Resistivity 260-264, 265-267 Resonant beam apparatus 196 Rheovibron 194 Roeleg machine 194 Ross flexer 246-247, 249 Rotary power loss machine 194 Rotation plastimeters 72-76 Rotorless curemeters 83-88 Rubber Process Analysiser 79
Sample preparation 64-65 Sampling 14-15,64,65
Satra slip test 225 Schering bridge 272 Schiefer abrader 238, 240 Schob pendulum 182-183,184,
198,253 Schopperring 135 Scleroscope 185 Scorch 82-88 Scott flexer 248-249 Sealing force 204 Set 211-216 Shape factor 150-152 Sharpening cutters 46-47 Shear
adhesion 367-368 rate 66-67 stress strain 154-158
Shore hardness 127-133 Shrinkage 90 Simple shear 155-157 Skid tester 224 S-N curve 251,252 Specific gravity 96 Specific heat 277-278 Staining 378-380 Standard atmospheres 53-55 Standard hardness blocks 132 Standard liquids 323-324 Standard rubbers 233-234 Standards 27-30
organsiations 31-39 Statistics 13-14 Steam tests 317-318 St Joe flexometer 255 Storage 51-52 Stress relaxation 90, 204-211,
304-305, 338 Stress-strain relationships
110-114 Stress Relaxation Processability
Tester 70-71 Surface charge 268-269

Index 387
Surface roughness 103 Swelling tests 318-326
Taber abrader 237, 240 Tack 88-89 Tear 159-167 Tearing energy 166-167 Temperature retraction test
291-293,298-299 Tensile
machines 138-145 stress strain 133-149
Tension adhesion tests 366-367, 373-374 fatigue 249-253 set 215-216
Test conditions 12, 55-56 equipment 20-22
Test method standards 28-30 Test piece history 11-12 Thermal analysis 276-277 Thermal conductivity 278,
279-282 Thermal diffusivity 279, 282-283 Thermal expansion 288-289 Thermodilatometry 289 Threshold strain 335-337 Thermometers 58 Thermoplastic elastomers 22-23 Torque rheometers 78-79 Torrens machine 246-247 Torsion 158,293-295,298
pendulum 188-191 Torsional braid analysis 188 Tortus tester 275 Tracking resistance 270-271 Transformer bridge 272 Transition temperature 289-290
UKAS 17 Ultrasonics 88, 173, 196, 370 Uncertainty 14 Unguarded hot plate 279, 281 Units 39-40 UV resistance 339-342
Vapour permeability 356-360 Vicattest 80 Viscoelastic flow behaviour
65-67 Volume change 318-326 Vulcameter 83
Wallace rapid plastimeter 69, 80, 82
Wallace Shawbury curemeter 83 Water absorption 325-326 Weathering 339-342 Williams plastimeter 67, 69, 80,
81,82 Wear 227-240 WIRA abrader 238 WLF equation 310-311 Wohler curve 251
Yersley oscillograph 187-188, 214
Young's modulus 111,150,154, 178,295
Zerbini pendulum 182-183