Embed Size (px)
Citation preview

Occupational Injuries From
Electrical Shock and Arc Flash Events
Final Report
Prepared by:
Richard B. Campbell, ScD. Fire Analysis and Research Division National Fire Protection Association
Quincy, Massachusetts USA
David A. Dini, P.E. Commercial and Industrial R&D
UL LLC Northbrook, Illinois USA
© March 2015 Fire Protection Research Foundation
THE FIRE PROTECTION RESEARCH FOUNDATION ONE BATTERYMARCH PARK
QUINCY, MASSACHUSETTS, U.S.A. 02169-7471 E-MAIL: [email protected]
WEB: www.nfpa.org/Foundation

—— Page ii ——
(This page left intentionally blank)
—— Page iii ——
FOREWORD
Electrical safety in the workplace is an important topic that is addressed by NFPA 70E, Standard for Electrical Safety in the Workplace® (2015 edition). This standard addresses arc flash and shock hazards, and there is a need for more empirical incident data on the actual hazards that may be experienced when equipment faults or adverse electrical events occur. The availability of such information would allow for better-informed decisions for on-going revisions to this standard. Specifically, NFPA 70E now includes detailed tables for arc flash hazard identification and arc flash PPE categories in the 2015 edition. These tables require specific levels of personal protective equipment (PPE) for various types and ratings of electrical equipment. Certain tasks where the risk of an arc flash or shock hazard may be lower, such as, normal operation of properly installed and maintained equipment which may not require the use of any special PPE. Some of this risk reduction is based on anecdotal data and/or the collective experience of the technical committee, and there is a desire to have more empirical incident data on the actual hazards and associated injuries that may be experienced when equipment faults or adverse electrical events occur. The goal of this project is to gather information on occupational injuries from electric shock and arc flash events through a review of literature, electrical incident data, and similar sources. This will include pertinent information such as the nature of the incident, adherence to safety requirements, use of appropriate PPE, and extent of injury. The Research Foundation expresses gratitude to the report authors Richard Campbell with NFPA Fire Analysis and Research Division and David Dini with the Electrical Hazards Research Group in Commercial and Industrial R&D of UL LLC. Likewise, appreciation is expressed to the Project Technical Panelists and all others who contributed to this research effort for their on-going guidance. Special thanks are expressed to the NFPA and UL LLC for their in-kind support for this project. The content, opinions and conclusions contained in this report are solely those of the authors.

—— Page iv ——
ACKNOWLEDGMENTS The Fire Protection Research Foundation expresses gratitude to those that assisted with the development and review of the information contained in this report. The Research Foundation appreciates the guidance provided by the Project Technical Panel and the assistance of the NFPA, which provided funding. In addition to expressing thanks to the members of the project technical panel for their guidance and contributions to this report, the authors wish to acknowledge several other people whose assistance was critical to this effort. Derek Deskins from the Fire Protection Research Foundation provided skillful assistance with the illustrations and table formats used throughout this report, and Paula Levesque from the Fire Analysis and Research Division was instrumental in putting the report into its final form. In addition, the authors thank Casey Grant from the Fire Protection Research Foundation and Marty Ahrens from the Fire Analysis and Research Division for their support of this project and encouragement from start to finish. About the Fire Protection Research Foundation The Fire Protection Research Foundation plans, manages, and communicates research on a broad range of fire safety issues in collaboration with scientists and laboratories around the world. The Foundation is an affiliate of NFPA. About the National Fire Protection Association (NFPA) NFPA is a worldwide leader in fire, electrical, building, and life safety. The mission of the international nonprofit organization founded in 1896 is to reduce the worldwide burden of fire and other hazards on the quality of life by providing and advocating consensus codes and standards, research, training, and education. NFPA develops more than 300 codes and standards to minimize the possibility and effects of fire and other hazards. All NFPA codes and standards can be viewed at no cost at www.nfpa.org/freeaccess. Keywords: NFPA 70E, workplace injury, electrical injury, electric shock, arc flash, electrocution, lockout/tagout, personal protective equipment, electrical safety, workplace injury prevention

—— Page v ——
PROJECT TECHNICAL PANEL
Tammy Gammon, PhD, (GA)
Palmer Hickman, Electrical Training Alliance (MD)
David A. Lombardi, PhD, Liberty Mutual Research Institute for Safety (MA)
Mark McNellis, Sandia National Laboratories (NM)
Gil Moniz, National Fire Protection Association (MA)
Andrew Trotta, Consumer Products Safety Commission (MD)
David Wallis, OSHA, retired, (DC)
PROJECT SPONSORS
NFPA
UL LLC

—— Page vi ——
(This page left intentionally blank)
i
Table of Contents
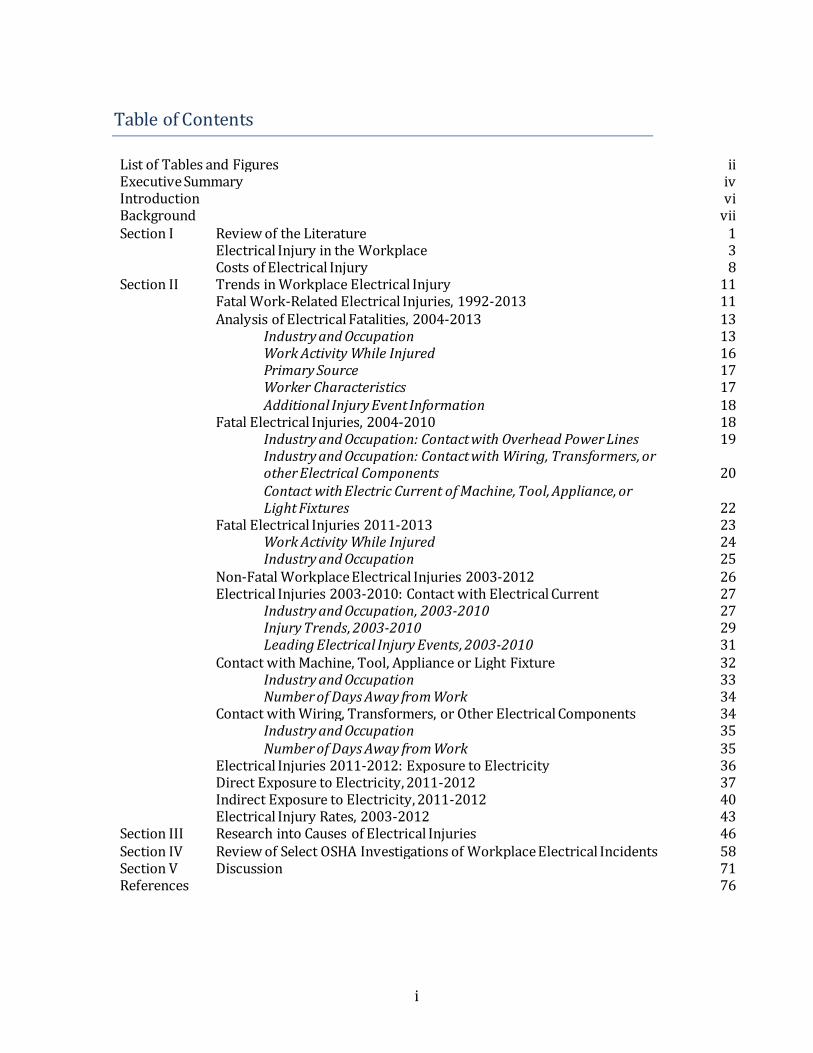
List of Tables and Figures ii Executive Summary iv Introduction vi Background vii Section I Review of the Literature 1 Electrical Injury in the Workplace 3 Costs of Electrical Injury 8 Section II Trends in Workplace Electrical Injury 11 Fatal Work-Related Electrical Injuries, 1992-2013 11 Analysis of Electrical Fatalities, 2004-2013 13 Industry and Occupation 13 Work Activity While Injured 16 Primary Source 17 Worker Characteristics 17 Additional Injury Event Information 18 Fatal Electrical Injuries, 2004-2010 18 Industry and Occupation: Contact with Overhead Power Lines 19 Industry and Occupation: Contact with Wiring, Transformers, or other Electrical Components 20 Contact with Electric Current of Machine, Tool, Appliance, or Light Fixtures 22 Fatal Electrical Injuries 2011-2013 23 Work Activity While Injured 24 Industry and Occupation 25 Non-Fatal Workplace Electrical Injuries 2003-2012 26 Electrical Injuries 2003-2010: Contact with Electrical Current 27 Industry and Occupation, 2003-2010 27 Injury Trends, 2003-2010 29 Leading Electrical Injury Events, 2003-2010 31 Contact with Machine, Tool, Appliance or Light Fixture 32 Industry and Occupation 33 Number of Days Away from Work 34 Contact with Wiring, Transformers, or Other Electrical Components 34 Industry and Occupation 35 Number of Days Away from Work 35 Electrical Injuries 2011-2012: Exposure to Electricity 36 Direct Exposure to Electricity, 2011-2012 37 Indirect Exposure to Electricity, 2011-2012 40 Electrical Injury Rates, 2003-2012 43 Section III Research into Causes of Electrical Injuries 46 Section IV Review of Select OSHA Investigations of Workplace Electrical Incidents 58 Section V Discussion 71 References 76
ii
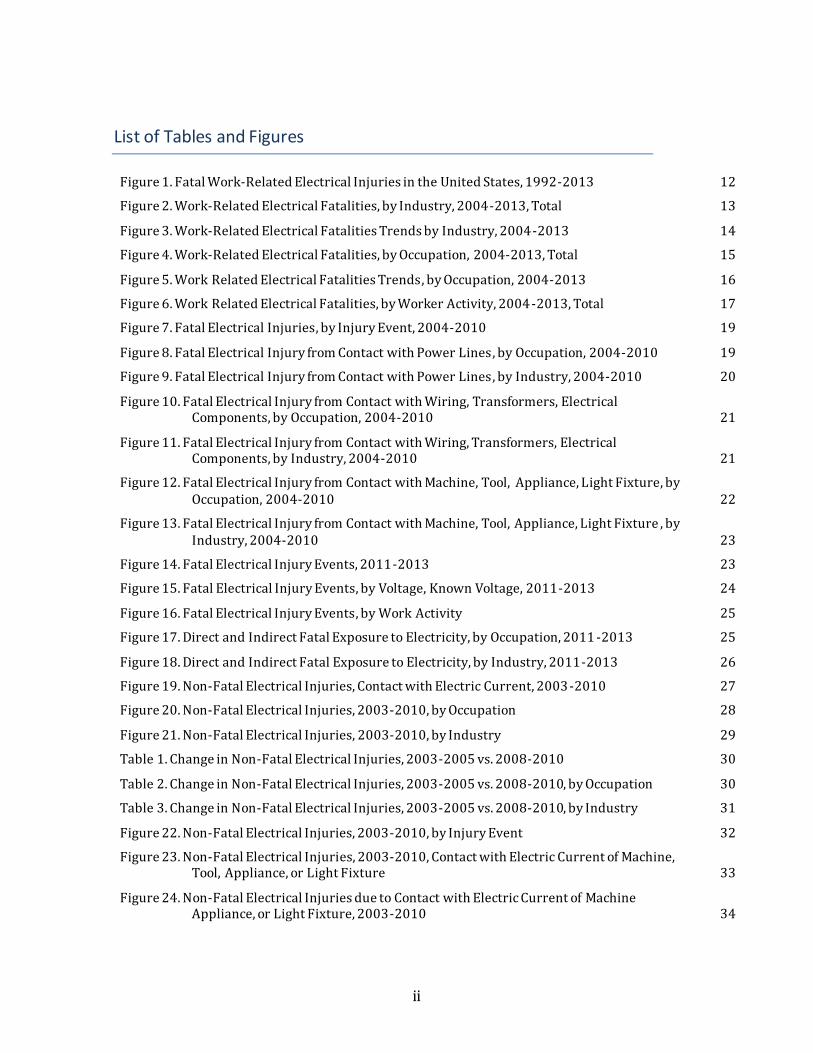
List of Tables and Figures
Figure 1. Fatal Work-Related Electrical Injuries in the United States, 1992-2013 12
Figure 2. Work-Related Electrical Fatalities, by Industry, 2004-2013, Total 13
Figure 3. Work-Related Electrical Fatalities Trends by Industry, 2004-2013 14
Figure 4. Work-Related Electrical Fatalities, by Occupation, 2004-2013, Total 15
Figure 5. Work Related Electrical Fatalities Trends, by Occupation, 2004-2013 16
Figure 6. Work Related Electrical Fatalities, by Worker Activity, 2004-2013, Total 17
Figure 7. Fatal Electrical Injuries, by Injury Event, 2004-2010 19
Figure 8. Fatal Electrical Injury from Contact with Power Lines, by Occupation, 2004-2010 19
Figure 9. Fatal Electrical Injury from Contact with Power Lines, by Industry, 2004-2010 20
Figure 10. Fatal Electrical Injury from Contact with Wiring, Transformers, Electrical Components, by Occupation, 2004-2010 21
Figure 11. Fatal Electrical Injury from Contact with Wiring, Transformers, Electrical Components, by Industry, 2004-2010 21
Figure 12. Fatal Electrical Injury from Contact with Machine, Tool, Appliance, Light Fixture, by Occupation, 2004-2010 22
Figure 13. Fatal Electrical Injury from Contact with Machine, Tool, Appliance, Light Fixture , by Industry, 2004-2010 23
Figure 14. Fatal Electrical Injury Events, 2011-2013 23
Figure 15. Fatal Electrical Injury Events, by Voltage, Known Voltage, 2011-2013 24
Figure 16. Fatal Electrical Injury Events, by Work Activity 25
Figure 17. Direct and Indirect Fatal Exposure to Electricity, by Occupation, 2011 -2013 25
Figure 18. Direct and Indirect Fatal Exposure to Electricity, by Industry, 2011-2013 26
Figure 19. Non-Fatal Electrical Injuries, Contact with Electric Current, 2003-2010 27
Figure 20. Non-Fatal Electrical Injuries, 2003-2010, by Occupation 28
Figure 21. Non-Fatal Electrical Injuries, 2003-2010, by Industry 29
Table 1. Change in Non-Fatal Electrical Injuries, 2003-2005 vs. 2008-2010 30
Table 2. Change in Non-Fatal Electrical Injuries, 2003-2005 vs. 2008-2010, by Occupation 30
Table 3. Change in Non-Fatal Electrical Injuries, 2003-2005 vs. 2008-2010, by Industry 31
Figure 22. Non-Fatal Electrical Injuries, 2003-2010, by Injury Event 32
Figure 23. Non-Fatal Electrical Injuries, 2003-2010, Contact with Electric Current of Machine, Tool, Appliance, or Light Fixture 33
Figure 24. Non-Fatal Electrical Injuries due to Contact with Electric Current of Machine Appliance, or Light Fixture, 2003-2010 34
iii
List of Tables and Figures (continued)
Figure 25. Non-Fatal Electrical Injuries due to Contact with Wiring, Transformers, Other Electrical Equipment, 2003-2010 35
Figure 26. Non-Fatal Injuries From Exposure to Electricity, 2011-2012 36
Figure 27. Non-Fatal Injuries from Exposure to Electricity, by Age, 2011-2012 37
Table 4. Non-Fatal Injuries from Direct Exposure to Electricity, by Age and Gender, 2011-2012 38
Table 5. Non-Fatal Injuries from Direct Exposure to Electricity, by Occupation 38
Table 6. Non-Fatal Injuries from Direct Exposure to Electricity, by Industry 39
Table 7. Non-Fatal Injuries from Direct Exposure to Electricity, by Days from Work 40
Table 8. Non-Fatal Injuries from Direct Exposure to Electricity, by Age and Gender, 2011-2012 41
Table 9. Non-Fatal Injuries from Indirect Exposure to Electricity, by Industry, 2011-2012 41
Table 10. Non-Fatal Injuries from Direct Exposure to Electricity, by Occupation, 2011-2012 42
Table 11. Non-Fatal Injuries from Direct Exposure to Electricity, by Days Away from Work, 2011-2012 43
Figure 28. Electrical Injury Incidence Rates, Construction & Utilities, 2003-2012 44
Figure 29. Electrical Injury Incidence Rates, Real Estate & Food Services, 2003 -2012 45
iv
Executive Summary Electrical injuries represent a serious workplace health and safety issue. Data from the U.S. Bureau of Labor Statistics (BLS) indicate that there were nearly 6,000 fatal electrical injuries to workers in the U.S. between 1992 and 2013. BLS data also indicates that there were 24,100 non-fatal electrical injuries from 2003 through 2012, the most recent 10-year period for which data is available. The number of fatal workplace electrical injuries has fallen steadily and dramatically over the past 20 years, from 334 in 1992 to 139 in 2013. However, the trend with non-fatal electrical injuries is less consistent. Between 2003 and 2009, non-fatal injury totals ranged from 2,390 in 2003 to 2,620 in 2009, with a high of 2,950 injuries in 2005. Non-fatal injury totals between 2010 through 2012 were the lowest over this 10-year period, with 1,890 non-fatal injuries in 2010, 2,250 in 2011, and 1,700 in 2012. There has been little change in the non-fatal electrical injury incidence rate over the past decade. Injury rates represent an important measure by taking account of injury occurrence relative to the underlying population. From 2003 through 2009, the non-fatal electrical injury incidence rate was 0.3 per 10,000 workers across all industry each year. The rate fell to 0.2 in 2010, rose again to 0.3 in 2011, and fell again to 0.2 in 2012. The leading electrical injury event for non-fatal injuries between 2003 and 2010 (after which changes were introduced in injury event codes) was “contact with electric current of machine, tool, appliance, or light fixture,” which accounted for 37% of the injuries during his period. The second leading non-fatal electrical injury event was “contact with wiring, transformers, or other electrical components,” with 35% of injuries. Other leading event categories included “contact with electric current, unspecified” (11%) and “contact with electric current, not elsewhere classified” (10%). “Contact with overhead powerlines,” which was the cause of over 40% of fatal electrical injuries, accounted for only 2% of the non-fatal injuries. Additional Findings:
A review of select Occupational Safety and Health Administration (OSHA) investigations of electrical injury incidents and prior research indicate that work inappropriately performed on energized equipment is associated with a substantial share of electrical injuries. Some of the work on energized equipment is inadvertent and results from a failure to recognize all electrical sources. Thorough pre-job planning with qualified personnel is essential for identifying all electrical sources, including unanticipated hazards that are not included in drawings.
Prior research indicates that time pressures and supervisor demands contribute to workers taking shortcuts with safety requirements. Workers may receive mixed messages when organizational communications counsel them to follow safety procedures while also emphasizing the importance of keeping to production schedules or other factors that may compromise safety.

v
Many workers who experience electrical injury have insufficient training for working on or around energized electrical equipment.
Failure to use appropriate personal protective equipment for electrical safety work practices is a contributing factor in many electrical injuries.
Priority Issues:
Reduce the practice of inappropriately working on energized electrical conductors and circuit parts. NFPA 70E only permits energized work where 1) de-energizing introduces additional hazards or increased risk, 2) equipment design or operational limitations make it infeasible to de-energized, 3) less than 50 volts is involved, or 4) the work only involves normal operation of properly installed and maintained equipment.
Improve the provisions for and mandatory use of all appropriate personal protective equipment for workers exposed to electrical hazards and improve the recognition of the level and type of personal protective equipment for electrical safety work practices required for specific situations.
Improve training in the recognition and avoidance of electrical hazards that might be present with respect to the equipment and work methods involved. This should also include essential electrical safety work practices for non-electrical workers, supervisors of non-electrical workers, and workers who repair or trouble shoot electrical machinery or equipment.
Require that all employers implement an overall electrical safety program as part of their occupational health and safety management system. This program should include, among others, risk assessment procedures to address employee exposure to electrical hazards. This risk assessment must identify hazards, assess risks, and implement control measures according to a hierarchy of approved methods.
vi
Introduction The National Fire Protection Association first appointed a technical committee on Electrical Safety Requirements for Employee Workplaces in 1976. This co mmittee was tasked with assisting the Occupational Safety and Health Administration (OSHA) in preparing electrical safety standards that could be promulgated through the Occupational Safety and Health Act, enacted by Congress in 1970. The first edition of NFPA 70E, Standard for Electrical Safety Requirements for Employee Workplaces, was issued in 1979, and it has been regularly revised and updated in the years since. NFPA 70E was the first nationally recognized standard for electrical safety-related work practices in the United States, and it served as the reference document for OSHA in its Electrical Safety-Related Work Practices regulation, promulgated in 1990. The electrical safety-related work requirements outlined in NFPA 70E provide crucial guidance for employers in complying with OSHA standards in the area of electrical safety and for employers as well as employees in identifying essential electrical safety-related work practices. For assistance in determining the appropriate safeguards and required levels of personal protective equipment (PPE) for different tasks on energized equipment, the 2015 edition of NFPA 70E now includes an arc flash hazard identification and PPE requirement table. For various tasks and equipment conditions, this table identifies when arc flash PPE is or is not required. If arc flash PPE is required, additional tables identify various arc flash PPE categories (e.g. 1 through 4) based on the type of equipment and electrical ratings involved. Another table then specifies the required level and type of PPE to be used, such as the minimum arc rating for clothing, for the specific PPE category involved. In general, the judgments regarding risk reduction that inform the tables are based upon the collective experiences of members of the NFPA 70E Technical Committee. However, the 70E Committee is always interested in increasing its knowledge base of experience by drawing upon new empirical incident data or better delineation of the actual hazards associated with adverse electrical events. Another area of recent technical committee discussion has been promoting recognition of the need for greater protection of non-electrical workers who may be exposed to electrical hazards while performing their non-electrical job functions. Historically, the scope of NFPA 70E has been more focused on the needs of qualified electrical workers who routinely work on energized electrical conductors and circuit parts during the course of their work. Because workers in non-electrical jobs may not have extensive electrical safety training and their work may not be guided by electrical safety work practices, the NFPA 70E technical committee added the following informational note to the Scope statement of the 2015 edition of NFPA 70E:
This standard addresses safety of workers whose job responsibilities entail interaction with electrical equipment and systems with potential exposure to energized electrical equipment and circuit parts. Concepts in this standard are often adapted to other workers whose exposure to electrical hazards is
vii
unintentional or not recognized as part of their job responsibilities. The highest risk for injury from electrical hazards for other workers involve unintentional contact with overhead power lines and electric shock from machines, tools, and appliances. (National Fire Protection Association, 2014)
Better information on the electrical hazard injuries to non-electrical workers is needed to assess the guidance needed in NFPA 70E to these workers in future editions of the standard. To this end, this special project, “Review of Occupational Injuries from Electrical Shock and Arc Flash Accidents,” was requested by the NFPA 70E Technical Committee in order to generate a more rigorous foundation for assessing risk in relation to electrical hazards, including quantitative data on electrical injuries, in-depth assessment of select adverse electrical events, and a review of literature on electrical hazards. Such information is essential for assessing the effectiveness of current safety practices, potential barriers to implementation, and prospective areas for future safety initiatives. Through the sponsorship of the Fire Protection Research Foundation, the project was able to move forward, and this report presents the findings of the research. Some clarification about terminology may be useful in introducing this review of electrical injuries to workers. It is not uncommon in discussions of workplace electrical hazards to see reference to “electrical workers: and “non-electrical workers” in order to distinguish between workers who routinely work with energized conductors or other circuit parts and those who do not. In fact, those who work with electrical energy sources can be found in a range of occupational groups , as elaborated in the Standard Occupational Classification (SOC) System used by U.S. federal government agencies. For instance, the SOC places electricians and electrician helpers under “Construction and Extraction Occupations,” while line (power -line and telecommunications) installers and repairers and electrical and electronic equipment mechanics, installers, and repairers are found under “Installation, Maintenance, and Repair Occupations,” and electrical and electronics engineers and technicians are found under “Architecture and Engineering Occupations.” Accordingly, the “electrical worker” distinction is, in some respects, more a reference to the type of work activity performed than to occupation. NFPA 70E does not itself refer to electrical workers, but instead refers to a “qualified person” as someone who has demonstrated skills and knowledge related to the construction and operation of electrical equipment and installations and has received safety training to identify and avoid any accompanying hazards. Background NFPA 70E is a national consensus safety standard that identifies safe work practices to protect workers from the hazards of electricity, including electric shock and electrocution, arc flash, and arc blast. NFPA 70E states “This standard addresses safety of workers whose job responsibilities entail interaction with electrical equipment and systems with potential exposure to energized electrical equipment and circuit parts. Concepts in this standard are often adapted to other workers whose exposure to
viii
electrical hazards is unintentional or not recognized as part of their job responsibilities. The highest risk for injury from electrical hazards for other workers involve unintentional contact with overhead power lines and electric shock from machines, tools, and appliances.”(National Fire Protection Association, 2014) In addition, the standard identifies safety procedures for other activities that may entail exposure to electrical hazards, such as installing conductors or equipment that connect to the supply of electricity. The focus of NFPA 70E is on the hazards associated with electrical wiring and components within a building or related structure. Electrical safety practices in relation to work performed by electric utilities on the equipment and installations under their exclusive control fall outside the scope of NFPA 70E, but the standard does apply to installations used by an electric utility (such as office buildings, machine shops, etc.) that are not an integral part of a generating plant, substation, or control center. NFPA 70E identifies and elaborates upon essential components of workplace electrical safety work practices through its requirements around electrical safety training, the use and selection of personal protective equipment, electrical safety practices and procedures, equipment maintenance, and electrical hazard warning labeling. Requirements around safety training apply not only to employees who perform work on electrical equipment, but also those who work in the area of equipment that is energized. NFPA 70E establishes strict training requirements for qualified persons who are authorized to work on energized equipment. Other workers who may also be exposed to an electrical hazard must be trained in the safety-related work practices necessary for their safety. Employees who are subject to training requirements must undergo retraining at least every three years, and safety training programs must also be audited at least every three years to ensure compliance with requirements of the standard. When work has to be performed on electrical equipment, the preferred protection for employees set forth by NFPA 70E is to deenergize the equipment through a prescribed set of steps necessary to create an electrically safe work condition. NFPA 70E calls for normally energized conductors and circuit parts to be put in this electrically safe work condition if employees are within a limited approach boundary or arc flash boundary or if an employee interacts with equipment where energized conductors or circuit parts are not exposed, but there is an increased likelihood of injury from exposure to arc flash. Only a qualified person can establish an electrically safe work procedure, and the first step in this process entails identifying all possible sources of electrical supply, if necessary by consulting plans, diagrams, or other documentation. For equipment to be considered electrically safe, all electrical conductors or parts to which employees might be exposed must be disconnected from energized parts and be locked and tagged out. Additional procedures to complete the process require the testing of all conductors and circuit parts to which employees may be exposed with a test instrument in order to confirm that they are not energized, and any equipment with induced voltages or stored electrical energy must be grounded.

ix
Except for certain tasks, such as testing and troubleshooting, when live parts or equipment are not made electrically safe for work as defined by NFPA 70E, a written energized work permit is required before work can proceed if the work takes place within a restricted approach boundary or the employee interacts with the equipment when conductors or circuit parts are not exposed, but there is an increased likelihood of injury from exposure to arc flash. The work permit must include: a description of the circuit and equipment that will be energized, a justification for work to take place in an energized condition, a description of safe work practices to address the additional hazard, the results of shock and arc flash risk assessments, designation of the voltage to which employees will be exposed, designation of the respective shock and flash protection boundaries, identification of the personal protective equipment that will be used to perform the work (based on the task and voltage/equipment, as specified by the standard), delineation of the methods for restricting access of unqualified persons into the work area, and evidence of a job briefing. The permit must be approved and signed by a responsible party who concurs with its contents and that deenergization is not feasible. The shock and flash protection boundaries established by NFPA 70E specify the permissible distances that must be maintained between employees and energized electrical conductors or parts in order to enhance safety, and there are increasingly stringent requirements as the distance decreases. Only qualified persons or unqualified persons who are advised and escorted by a qualified person may enter a “limited boundary” approach, while a “restricted boundary” approach specifies the area which can only be entered by a qualified person with the proper level of personal protective equipment and appropriate tools. Approach boundaries are determined by the voltage of the energized object in the case of shock protection and by incident energy exposure level for flash protection. The standard spells out requirements for the level and type of personal protective equipment to be worn to protect against shock and arc flash within these boundaries, based on a determination of the hazard. There is a broad recognition that the electrical safety work practice requirements established by NFPA 70E have played a vital role in improving workplace safety for both electrical workers and non-electrical workers alike. However, although the incidence of fatal and non-fatal electrical injuries has decreased over the past 20 years, questions remain about how closely employers and employees follow NFPA 70E procedures in their everyday work practices and whether there are areas where NFPA 70E could provide additional improvement, either in its safety requirements or target populations.

1
Section I: Review of the Literature Electrical hazards take a variety of forms and produce different types of injury. The National Safety Council reported in its 2014 edition of Injury Facts that there were 961 fatal injuries from 2008 through 2010 due to exposure to electric current, radiation, temperature, and pressure. While relatively uncommon, electrical injuries are noted for having the potential to be particularly debilitating, with a high morbidity and mortality. (Koumbourlis, 2002) The seriousness of electrical injuries stems in part from their ability to produce multisystem trauma and their association with a range of complications, including cardiopulmonary arrest, cardiac arrhythmia, hypoxia, renal failure, and sepsis. (Cooper and Price, 2002) Exposure to electricity may also produce long-term neurological and psychosocial effects and significantly influence the quality of life. (Pliskin et al., 1994; Noble et al., 2006) The principal injury events associated with electrical hazards are electric shocks and arc flash and arc blast. Low-voltage shock injuries result from direct contact of the victim with electric current, while high-voltage shocks typically create an arc, which carries electric current from the source to the victim without any direct physical contact. (Koumbourlis, 2002; Lee et al., 2000) Electric arcing, commonly referred to as arc flash, occurs when current passes through air between two or more conducting surfaces or from conductors to ground, and it has a variety of possible causes, including gaps in insulation, corrosion, condensation, and dust or other impurities on a conducting surface. (Workplace Safety Awareness Council) Electric arcing may produce temperatures as high as 35,000 degrees and may cause severe burns, hearing loss, eye injuries, skin damage from blasts of molten metal, lung damage, and blast injuries. (Lee, 1982) A critical factor that influences the severity of direct contact with electrical injury is the type of current to which an individual has been exposed. Cooper indicates that exposure to alternating current (AC), the form of current typically found in homes and workplaces, is considered to be three times more dangerous than exposure to direct current (DC) of the same voltage because it is more likely to result in muscle tetany (involuntary contraction of the muscles), extending the duration of exposure. (Cooper, 1995) The exit wounds produced by direct contact with DC current are also more discrete than those produced by AC current. (Bernius and Lubin, 2009) Additional factors that determine the severity of injuries resulting from direct contact with electricity include the strength of the current, the resistance of tissues, the pathway of current, and the duration of exposure. The strength of an electric current, expressed in amperes, is a measure of the energy that flows through a conductor and is a critical determinant in the amount of heat that is discharged to an object. (Cooper and Price, 2002) However, energy and heat may be dissipated by resistance to electric current, and because different tissues or parts of the body offer different resistance to the flow of electricity, the same amount of voltage will produce different currents, and thus varying degrees of damage, in different tissues. (Cooper and Price, 2002; Koumbourlis, 2002; Bernius and Lubin, 2009) Bone, tendons, and fat offer the most
2
resistance to current and will tend to heat up and coagulate, while ner ves, blood, and membranes, and muscles offer the least resistance. Skin is the primary resistor to electric current and is an intermediate conductor, but its resistance varies with individuals and conditions. Wet skin, including skin wetted by perspiration, offers minimal resistance and will maximize the current to which it is exposed. The resistance of skin also increases with its thickness, making thick and calloused skin a poor conductor of electrical current. (Koumbourlis, 2002) Cooper and Price point out that resistance to electrical current increases with carbonization of tissue. (Cooper and Price, 2002) The pathway taken by electric current through the body will determine which and how many organs are at risk and how much electrical energy is converted into heat. (Cooper and Price, 2002; Koumbourlis, 2002) Injuries to the heart and central nervous system are a particular concern. (Koumbourlis, 2002; Bikson, 2004) Current passing through the heart or thorax can cause direct myocardial injury or arrhythmias, while current through the brain may cause respiratory arrest, seizures, and paralysis. (Cooper and Price, 2002; Bernius and Lubin, 2009) Current following a vertical pathway on a parallel axis through the body is particularly serious because it is likely to involve the central nervous system, heart, and respiratory system. (Kombourlis , 2002) A horizontal pathway entering from one hand and exiting through the other may also pass through the heart, but not pass through the brain. (Kombourlis , 2002) In research conducted by Bailey and co-authors, a majority of electrocution when current followed a pathway from upper to lower extremities. (Bailey et al., 2001) Current that passes through the lower part of the body may cause serious injury, but is less likely to prove fatal. (Bikson, 2004; Bernius and Lubin, 2009) Finally, more prolonged contact with electrical current creates greater opportunities for electrothermal heating, and thereby greater tissue destruction. (Cooper and Price, 2002) In addition to the potential for electric shock to cause serious burn injuries or injuries to vital organs, it can also cause severe muscle contractions and hemorrhaging of muscle fibers that result in fractures or dislocation of joints. (Leibovici et al., 1995) Shocks produced by voltages greater than 200 volts can cause damage to the eyes. (Leibovici et al., 1995) Electric shock can also result in secondary injury events, such as falls from height. (Bernius and Lubin, 2009). Exposure to high electrical voltages, typically classified as greater than 1000 volts, is associated with more serious injury because the greater current flow is likely to produce greater tissue destruction. (Cooper and Price, 2002) A review of electrical injury admissions at a hospital burn unit over a 20-year period found that complications were highest in the high-voltage group, and that this group had the longest mean length of stay and required the most operations. (Arnoldo et al., 2004) Lightning strike victims had the highest mortality rate (17.6%), but the mortality rate for high-voltage admissions (5.3%) was nearly twice that of low-voltage admissions (2.8%). Chudasama and co-authors (2010) also compared high and low-voltage injury groups at a burn center in order to compare outcomes on return to work and neuropsychiatric indicators. High-voltage injury victims had significantly larger total

3
body surface burn areas, longer stays in the intensive care unit, longer hospitalizations, and significantly higher rates of fasciotomy (a surgical procedure which involves cutting the fascia to relieve tension or pressure to a limb), amputation, nerve decompression, and outpatient reconstruction. However, patients in low-voltage and high-voltage groups were found to have similar rates of neuropsychiatric complications, return to work limitations, and delays in returning to work. A recent study of patients with electrical burns at a burn unit in Brazil also found that complications were more severe and common among patients in the high-voltage group, with longer hospitalizations and more complex surgical procedures due to the greater depth of burns. (Luz et al., 2009) As indicated in the studies comparing high-voltage and low-voltage electrical injury groups, exposure to low voltage electricity should not be taken to indicate low impact, particularly where low voltage is defined as up to 1000 volts. A study of low-voltage and electric flash injury victims by Theman and co-authors found that 57.5% of the patients attempted to return to work on average 107.7 days after injury, but only one -third of patients successfully returned to work 59.38 days after injury, and they concluded that return to work was complicated by continuing psychological, neurological, and musculoskeletal symptoms. (Theman, et al., 2008) A study of victims of electrical injury at a major Ontario burn center found that low-voltage electrical injury was associated with more frequent long-term complications than high-voltage injuries. (Singerman et al., 2008) Most of the low-voltage injuries were electrical flash burns (55% of study population). The most common sequelae (secondary consequences) among the electrical injury victims were neurological and psychological symptoms. Neurological symptoms most frequently involved numbness, weakness, memory problems, paresthesia, and chronic pain, while psychological symptoms most often involved anxiety, nightmares, insomnia, and event flashbacks. Patients who had more neurological symptoms also had more psychological symptoms. Many symptoms were non-specific and frequently were not manifested until months following the injury. A review of potential risk factors among electrocution victims in Quebec found that 25 of 124 victims were exposed to currents in the 240/120 volt range, and that wet extremities and passage of electric current through the thorax were more common in this group than in higher voltage electrocutions. (Bailey et al., 2001) Atrial fibrillation at low-voltage exposures is rare, but has been reported at less than 350 volts. (Varol et al., 2004) Exposure to less than 300 volts from household appliances may result in ventricular fibrillation. (Sances et al., 1979) Fractures may be produced by exposure to electricity in the 110 to 440 volt range. (DiMaio and Dimaio , 2001) Electrical injury in the workplace A substantial share of electrical injuries occur as a result of work activities. Studies of patients at hospital burn centers have found that the majority of patients reporting with electrical burns were injured while working (Brandt, et al., 2002; Singerman et al., 2008), and the American Burn Association reported in 2014 that 61% of electrical
4
burns with known injury circumstances from 2004-2013 were work-related (3638 out of 5955 fatalities). Data published by the Bureau of Labor Statistics (BLS) indicate that 525 workers suffered fatal injuries due to contact with electrical current from 2008-2010, which would represent 55% of the 961 injuries among all members of the population (work and non-work) due to exposure to electric current, radiation, temperature, and pressure that were reported by the National Safety Council during those years. BLS also reported 7000 non-fatal injuries due to contact with electrical current from 2008-2010. A more detailed review of fatal and non-fatal work-related injuries from 2003-2012 is provided in a separate section of this report. Construction workers account for a disproportionate share of electrical injuries, and there have been a number of studies examining electrical injury in this population. (McMann, 2003; Janicak, 2008; Ore and Casini, 1996; Salehi et al., 2014) From 1992-2002, 47% of workplace electrocutions took place in the construction industry (Cawley and Homce, 2006) and construction workers have been found to be approximately four times more likely to be victims of workplace electrocution than workers in all other industries combined. (Ore and Casini, 1996) Risk of electrocution is greatest among young construction workers, particularly workers aged 16 to 19 years. (Janicak, 2008; Ore and Casini, 1996) In recent research by Lombardi and co-authors (2009) examining non-fatal as well as fatal electrical injuries utilizing workers’ compensation claims, non-fatal injuries comprised 98.8% of cases. The researchers found that service industries accounted for the highest share of claims, 33.4%, followed by the manufacturing industry (24.7%), retail trade (17.3%), construction (7.2%), and finance, insurance, real estate (5.7%). The research also found that while electric shock (48.8%) and burns (19.3%) were the most frequent types of injury, 31.9% of injury claims included a variety of injury types, including strain and sprain, contusion, inflammation, laceration, sprain, syncope, foreign body, fracture, and hearing loss. (Lombardi et al., 2009) Another critical factor that draws attention in literature on electrical injury and work is that there may be substantial barriers to successful return to work. (Wesner and Hickie, 2013; Theman et al., 2008; Stergiou-Kita et al., 2014) In addition to any physical limitations that affect job performance, the neurological effects may encompass behavioral changes, as well as memory and attention issues, and irritability, anger, and physically aggressive behaviors have been noted in electrical injury victims with no prior history of mood disorders, creating evident strains in the work environment. As indicated earlier, even low-voltage injuries can produce psychological and neurological impairments that adversely impact the ability to return to work. (Theman et al., 2008) Research based on in-depth interviews with electrical injury victims identified three distinct challenges to returning to work after electrical injury: physical, cognitive, and psychosocial impairments and their impact upon work performance, feelings of guilt, blame, and responsibility for the injury; and difficulty in returning to the workplace where the injury occurred. (Stergiou-Kita et al., 2014) Social support from family, friends, and co-workers and receipt of rehabilitation services were beneficial sources of support identified by the research.
5
The need for more or better electrical safety training programs that target all workers exposed to electrical safety hazards is emphasized in a number of studies. Lombardi and his co-authors point out that many of the injured workers in their study worked in industries, such as services and retail trade, that do not routinely emphasize electrical safety training. In research of burn center patients, 69% of patients who were injured at work identified themselves as electrical workers, and the researchers suggested that non-electrical workers may not have received adequate training in electrical safety. (Brandt et al., 2002) A corporate case study examining electrical injury reporting and safety practices found that 40% of electrical incidents involved 250 volts or less and were indicative of a misperception of electrical safety as a high-voltage issue. In addition, electrical incidents once again were found to involve a large share of non -electrical workers, with approximately one-half of incidents involving workers from outside electrical crafts, leading to an expansion of electrical safety to include all those potentially exposed to electrical hazards. (Capelli-Schellpfeffer et al., 2000) Research of electrical fatalities in construction found that the highest proportion of fatalities occurred in establishments with 10 or fewer employers and pointed out that smaller employers may have fewer formal training requirements and less structured training in safety practices. (Taylor) The high share of electrical fatalities among worker s in younger age groups has also been seen to call for special training efforts . (Janicak, 2008) Literature on electrical injury has tended to focus on shock and electrocution, while devoting comparatively little attention to injuries resulting from arc flash or arc blast. Research on electrical burns nevertheless shows that burns from electric flash are responsible for many of the work-related burns treated at burn centers. Research at a Michigan burn center found that 34% of patients injured on the job received flash injuries, with direct contact with electric current accounting for the remaining injuries. (Brandt et al., 2002) Arc flash injuries represented 55% of the electrical work-related burn injuries in the Ontario research cited earlier, while 37% of the injuries were due to electrical contact and the remaining injuries had no information concerning burn type. (Singerman et al., 2008) In research involving burn patients in Brazil, 20% of the injuries were flash burn injuries, and 37% of these involved third-degree burns, while the remaining 63% were second-degree burns. (Luz et al., 2009) A study of electrical injuries over a 20-year period at a Texas burn center found that 40% of burns were electrical arc injuries, and that while mortality was the lowest relative to other electrical burns in this group, burn size was the largest, and the mean length of stay was 11.3 days. (Arnoldo et al., 2004) A paper by Ralph Lee in 1982 states that temperatures of electric arcs can reach up to 35000°F at the arc terminals, with lethal burns possible at a distance of several feet from the arc and severe burn injuries common at distances of 10 feet. (Lee, 1982) Clothing can ignite at temperatures from 400°C to 800°C, and arcs may expel droplets of molten terminal metal of 1000°C or more, burning skin or instantly igniting clothing. Arc burns are seen to most often be experienced by electrical workers working close to energized parts of high fault capacity. A common estimate of arc flash occurrence is
6
that there are 5 to 10 arc flash explosions in electrical equipment every day in the U.S., but the origins of this estimate are unclear. (Kowalski-Trakofler and Barrett, 2007) Among the studies of electric arcing injuries is research by the National Institute for Occupational Safety and Health into arcing injuries in the mining industry. (Homce and Cawley, 2007) The research noted that electrical burn injury rates in mining had either remained constant or increased during seven years from 1992-2002 while those rates were decreasing for all industry in the U.S. To explore this trend, the research examined 836 incidents involving “noncontact electric arc burns” from 1990-2001 using data from the Mine Safety and Health Administration (MSHA). The occupations of those who experienced the most injuries were electricians (39%), mechanics (20%), preparation plant workers (6%), and laborers (5%). Work activity at the time of the incident most often involved electrical maintenance or repair work, but many of the events occurred as a result of equipment failure (such as circuit breakers) during normal operation of equipment. A subsequent paper by the authors indicated that 19% of the events occurred during normal operation of equipment. (Cawley and Homce, 2007) Other equipment components involved in the arcing events included conductors, non-powered hand tools, electrical meters, and plugs and connectors. Voltage was reported in 35% of arcing events and was 600 volts or less in 84% of these reports and over 1000 volts in 10% of reports. The NIOSH mining research singled out NFPA 70E as a potential resource for protecting mine workers from arc flash hazards, while noting that its scope explicitly excluded power systems used in underground mines and in powering surface mining equipment. The authors recapitulated the research findings and reviewed in some detail the requirements of NFPA 70E regarding work practices, personal protective equipment, and other equipment as a guide for how miners could protect themselves in the workplace. (Cawley and Homce, 2007) In follow-up research, NIOSH investigators examined behavioral and organizational factors that may have played a role in MSHA electric arcing incidents by reviewing the MSHA reports and conducting personal interviews with 32 respondents who were either arc flash victims or witnesses to an arcing event. (Kowalski-Trakofler and Barrett, 2007) Workers who were interviewed overwhelmingly believed that the incidents could have been prevented, and turning off power was most often cited as the key to prevention. Nearly three-quarters of incidents (73%) occurred in organizations that were seen to have average or good safety cultures. Production pressures, as well as inconsistency in training and communication, were identified by workers as factors that played a role in the arc flash incidents. Findings from this paper will be explored in more detail below. Doan and co-authors recently conducted research examining 40 arc flash incidents involving 54 workers to assess levels of protection offered by personal protective equipment. (Doan, et al., 2010)The authors found that approximately half of the workers who applied hazard analysis in selecting personal protective equipment suffered burn injuries as a result of not wearing gloves or a face shield with hard hat

7
and that wearing an arc rated face shield and leather gloves with sleeve overlap would have prevented 39% of the observed burn injuries. They also found that two -thirds of the workers involved in arc flash incidents were injured when they failed to conduct an arc flash analysis for selecting personal protective equipment. The authors concluded that workers may wear insufficient personal protective equipment if they determine there is a low risk of an arc flash event based on NFPA 70E tables used to establish hazard risk category. Arc rated protective clothing and equipment was seen to provide protection as long as it was selected to match level of exposure and was worn according to NFPA 70E guidelines. In another recent paper, Wellman utilized data from OSHA investigation reports to examine arc flash incidents, classifying events by voltage range and investigating the types of injury and critical factors contributing to the incidents. (Wellman, 2012) The research had a particular interest in the incidence of low voltage injuries, and it found that injuries resulted from exposure to arc flashes at 120 to 277 volts. Only 6% of the burns from exposure to less than 1000 volts were produced by 300 volts or less, indicating that arc flashes at low voltages are difficult to sustain. The research also found that all of the injuries could have been prevented by de-energizing the equipment and stressed this as a point of emphasis in communicating NFPA 70E requirements. Findings from this research will be also be presented in more detail in Section III of this report. Available information of barriers to the use of personal protective equipment does not specifically address workers exposed to electrical hazards, but nevertheless may offer insights for future research in this area. A study of construction workers found that 58% of the research participants were reluctant to wear personal protective equipment and that 53% reported that they had observed co-workers failing to wear personal protective equipment in situations where it was clearly needed. (Farooqi, et al., 2009) Workers most often expressed reluctance to wear personal protective equipment because they found it to be uncomfortable or did not fit properly. Workers also indicated that employers failed to provide sufficient personal protective equipment or did not enforce its use, and nearly one-quarter of the respondents had not received training in proper use of personal protection equipment. Research with workers in a metal refining plant also found that a low percentage of workers perceived personal protective equipment to be either comfortable or satisfactory. (Akbar-Khanzadeh, 1998) The personal protection equipment used at the worksite included safety glasses or goggles, hard hats, respirators, hearing protection, safety shoes, and safety harnesses. Workers most often indicated that they disliked using personal protection equipment because they felt it wasn’t needed, created a new hazard, interfered with work, was too heavy or hard to wear, inhibited breathing or communication, or didn’t fit or feel right. In research conducted by the Bureau of Labor Statistics with workers who had experience heat burns, many respondents indicated that they were wearing some form of personal protective equipment when injured, but were not wearing a full ensemble that would have protected the burn area, either because they didn’t believe it was needed or because it was not provided by employers. (Personick, 1990). Research which evaluated physiologic stress associated
8
with four different work ensembles found that subjects perceived relative degrees of physiologic strain under laboratory conditions, and that the heaviest ensemble (firefighter turnout gear) produced the greatest physiologic and subjective stress among research subjects. (White, et al., 1989)
Costs of electrical injury Establishing the cost of workplace injury is recognized as a critical factor in promoting workplace injury prevention efforts to employers by demonstrating that prevention carries economic payoffs. Information about injury costs is also useful in bringing injury prevention to the attention of policy makers as an important social good, and in underscoring to individual workers the importance of safety at a personal level by illustrating the economic hardships that can accompany the pain and suffering imposed by workplace injury. (U.S. Department of Labor, 2014) However, determining accurate estimates of the full cost of workplace injury are nevertheless extremely complicated and subject to tremendous variation, based on underlying assumptions, cost components, and the availability of data. The most easily determined portion of economic costs of workplace injury are the direct costs, which typically are seen to include workers’ compensation payments, medical expenditures, and any associated legal expenses. (U.S. Department of Labor, 2014) Much more difficult to calculate are the indirect costs of injury, comprised of a variety of less tangible costs, including wage costs paid during work stoppage, administrative costs related to injury, property damage and repair, training and compensation for replacement workers, lost productivity through use of less experience workers, fines related to workplace safety violations, and potential increases in absenteeism or decreases in morale. (American Society of Safety Engineers, 2002; U.S. Department of Labor, 2014) The American Society of Safety Engineers (2002) has estimated that the indirect costs of workplace injury may be as much as 20 times higher than direct costs, (American Society of Safety Engineers, 2002) but a more conservative standard has assumed a 4:1 ratio of indirect to direct costs (Manuele, 2011), and other estimates are still lower. Although there is little consensus on the most appropriate ratio, there does seem to be agreement that indirect costs are higher for injuries that have lower direct costs. OSHA’s approach to determining workplace injury costs is based on a ratio proposed in a 1982 publication Business Roundtable publication, “Improving Construction Safety Performance: A Construction Industry Cost Effectiveness Project Report,” which assumes that indirect costs are 4.5 times higher than direct costs of less than $2,999, 1.6 times higher for direct costs of $3,000 to $4,999, 1.2 times higher for $5,000 to $9,999, and 1.1 times higher for direct costs of $10,000 or more. However, a recent paper suggests that no published ratios are currently valid because the direct costs of workplace injuries over the past 15 years have increased at a substantially greater rate than indirect costs. (Manuele, 2011)

9
For a variety of reasons, the difficult task of accurately estimating the full cost of workplace injury is likely to be even more complicated in the case of electrical injury. Not only do electrical injuries range widely in their severity, but a number of injuries from electrical events may not be recognized or classified as having an electrical origin, such as falls or heart events. The potentially long-term neurological and psychosocial consequences of electrical injury -- and their complicated implications for return to work – also pose a sizable challenge for estimating cost. In addition, the predominance of electrical injuries in younger age groups exacerbates both the replacement costs of electrical injury for employers and the social costs of injury for the economy as a whole, while compounding the tragedy of many types of electrical injury for the victims. There have been a few efforts to estimate the cost of electrical injury, with some fairly disparate results. Research by Lutton in 1994 estimated the economic impact of electrical events involving injuries to 62 electrical utility employees, with injuries of varying severity, and a mix of age groups, job categories, and years of job tenure represented among the injury victims. (Lutton, 1994) The research summed the total dollar cost for workers’ compensation, contract pay, replacement time, equipment replacement, and lost productivity for the day of the accident for all cases, and then calculated the average dollar cost per case based on these factors, producing an estimate of $49,823 in the average dollar cost per case in accounted for dollar costs. The researchers acknowledged a number of dollar costs that were not accounted for in the cost estimate, including the cost of overtime related to a specific event, the cost of supervisor wages for time associated with the event, the cost of learning period for new workers, the cost of time for management and clerical workers, the cost of accident investigation, and training necessitated as a result of the accident investigation. If the estimated $49,823 in accounted for costs per case in 1994 is adjusted for inflation through the Consumer Price Index inflation calculator, the cost per case in 2014 dollars would increase to $80,023. These costs would obviously increase with the inclusion of indirect costs. An estimate of the cost of burn injuries from arc flash/blast explosions is available from a 2006 report from the Washington State Department of Labor and Industries, “Burn Injury Facts,” which reported that workers’ compensation costs for 30 serious arc flash or blast burn injuries that took place between September 2000 and December 2005 were in excess of $1.3 million. (Washington State Department of Labor and Industries, 2006) If the $1.3 million in workers’ compensation costs were assigned to 2003 as the approximate mid-point for the injury period and converted to adjust for inflation, the costs in 2014 dollars would be approximately $1.7 million, an average of $56,667 per claim in workers’ compensation costs alone. Workers’ compensation benefits include both medical expenses and wage replacement during periods of disability, but it is not clear from the report which costs are included in the $1.3 million in workers’ compensation costs, complicating any assessment of how completely the reported costs reflect actual injury costs.
10
A paper by Wyzga and Lindroos (1999) sought to take account of indirect as well as direct costs in estimating the cost of electrical injury. Based on data from a U.S. utility between 1990 and 1991, they assumed a representative cost of $250,000 a year in immediate direct medical costs, and an additional minimum of $1.3 million in direct costs after the first year, for a total of $1.55 million in direct costs. They calculated that indirect costs would amount to $11.24 million, based on an indirect to direct cost ratio of 8.25:1, for an estimated total of $12.8 million in total costs, which they increased to $15.75 million in 1998 dollars. The CPI calculator estimates that the value of $15.75 million in 1998 would be $23 million in 2014 dollars. More recently, in issuing a final rule, Electric Power Generation, Transmission, and Distribution Maintenance and Construction (29 CFR 1910.269 and 29 CFR Part 1926, Subpart V), OSHA in 2014 estimated a value of $62,500 per nonfatal injury prevented by a new health and safety standard for workers performing electric power generation, transmission, and distribution work (U.S Department of Labor, Occupational Safety and Health Administration, 2014b). This estimate utilized a willingness-to-pay methodology, which is based on the amount that an individual (or society) is willing to pay in exchange for a marginal change in risk of injury, disease, or death. Based on available reviews of studies in this area, OSHA assumed a value of $50,000 in 2000 dollars, which was increased to $62,500 using the Gross Domestic Product deflator, an alternative method to the Computer Price Index for making adjustments to prices based on inflation. By means of comparison, the CPI adjustor estimates that $50,000 in the year 2000 is worth $69,100 in 2014 dollars. OSHA acknowledged in the final rule that it conservatively underestimated nonfatal injury costs in reaching its $62,500 estimate, and noted that if it had included a higher valuation for burn injuries (based on a study of burn injuries between 1991 and 1993) the estimated cost would rise to $76,694 in 2009 dollars. OSHA also estimated that the new rule would reduce costs of $8.7 million for each life saved by its strengthened protections, again based on studies using the willingness-to-pay approach.
11
Section II: Trends in Workplace Electrical Injury Comprehensive data on work-related electrical injuries is essential for prevention efforts. The Bureau of Labor Statistics, U.S. Department of Labor, maintains separate databases for fatal and non-fatal work-related injuries, and these provide information about the types of workers who have experienced injury from electrical hazards, the work activities when injury occurred, the occupations and industries of injured workers, demographic information on injury victims, and other key descriptors that are useful in identifying injury trends and areas of concern. As further described below, fatality data is collected through the Census of Fatal Occupational Injuries, a surveillance system that draws upon multiple information sources. Data on non-fatal injuries is available through the Survey of Occupational Injuries and Illnesses (SOII), which collects data from a sample of employers each year, utilizing employer records of occupational injury and illness to generate injury and illness estimates. (U.S. Bureau of Labor Statistics, 2009) Injuries which must be recorded by employers include injuries resulting in days away from work, restricted work or transfer to another job, medical treatment beyond first aid, loss of consciousness, or significant injury otherwise diagnosed by a physician or other licensed health care professional. We utilized these databases to compile data on electrical injury over time, focusing our analysis on injuries over the most recent 10-year period for which data was available. It is important to note in reviewing this information that workers in particular occupations, including those who commonly work with electrical hazards, may be employed in a variety of different industries. While, the construction industry employs the highest number of electricians, for instance, electricians are also found in service, manufacturing, transportation and public utilities, and other industries. In addition, as the following data will show, those who experience electrical injury cover an array of occupations and industries.
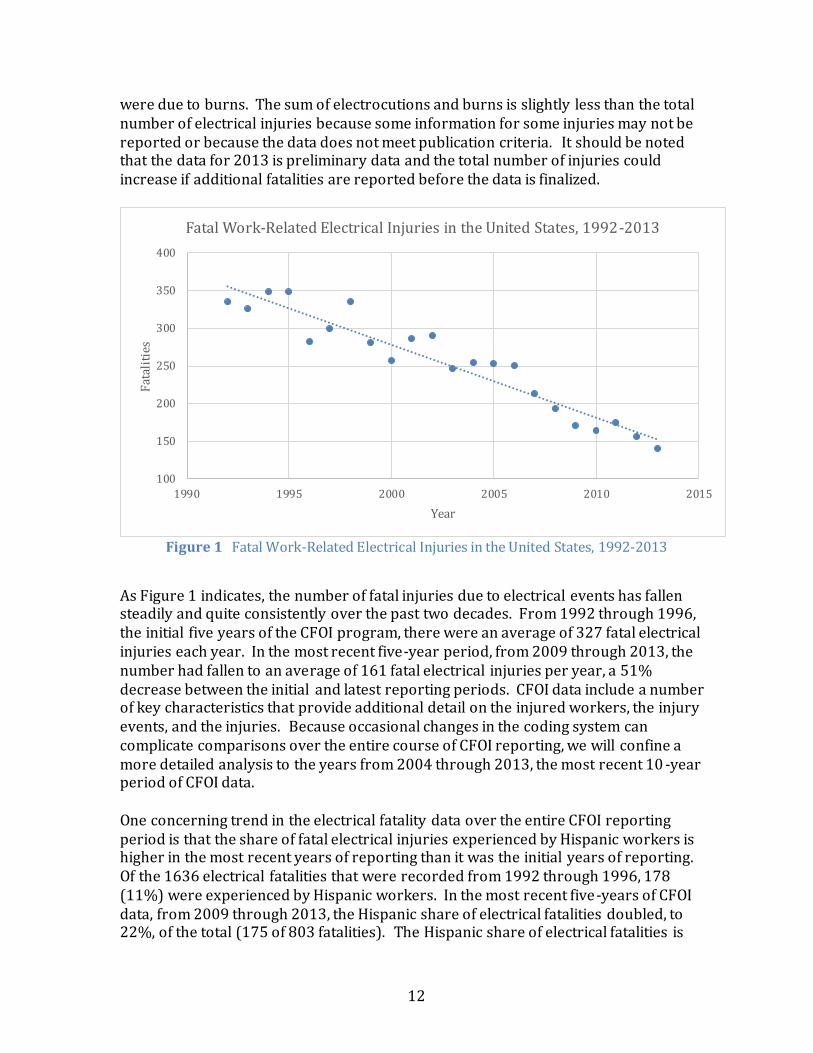
Fatal Work-Related Electrical Injuries, 1992-2013 Data on fatal electrical injuries is available from the Census of Fatal Occupational Injuries (CFOI), introduced by the Bureau of Labor Statistics in 1992 in order to create a comprehensive count of fatal occupational injuries in the United States through the use of multiple source documents. CFOI collects information of fatal work injuries in each state from multiple source documents, including death certificates, workers’ compensation records, data from federal agencies, and newspaper reports, and used them to assemble a comprehensive fatal injury profile of workers. The use of multiple information sources is credited with the creation of a more comprehensive injury database than would be available through a single data source, and CFOI for this reason has been endorsed by both the National Safety Council and the National Center for Health Statistics as the data source for fatal worker injuries. (U.S. Bureau of Labor Statistics, 2009) Between 1992 through 2013, CFOI recorded a total of 5587 fatal electrical injuries, an average of 254 fatal electrical injuries each year. Of these injuries, 5527 (99% of the total) were reported to be electrocutions, while less than one percent of the fatalities
12
were due to burns. The sum of electrocutions and burns is slightly less than the total number of electrical injuries because some information for some injuries may not be reported or because the data does not meet publication criteria. It should be noted that the data for 2013 is preliminary data and the total number of injuries could increase if additional fatalities are reported before the data is finalized.
Figure 1 Fatal Work-Related Electrical Injuries in the United States, 1992-2013
As Figure 1 indicates, the number of fatal injuries due to electrical events has fallen steadily and quite consistently over the past two decades. From 1992 through 1996, the initial five years of the CFOI program, there were an average of 327 fatal electrical injuries each year. In the most recent five-year period, from 2009 through 2013, the number had fallen to an average of 161 fatal electrical injuries per year, a 51% decrease between the initial and latest reporting periods. CFOI data include a number of key characteristics that provide additional detail on the injured workers, the injury events, and the injuries. Because occasional changes in the coding system can complicate comparisons over the entire course of CFOI reporting, we will confine a more detailed analysis to the years from 2004 through 2013, the most recent 10 -year period of CFOI data. One concerning trend in the electrical fatality data over the entire CFOI reporting period is that the share of fatal electrical injuries experienced by Hispanic workers is higher in the most recent years of reporting than it was the initial years of reporting. Of the 1636 electrical fatalities that were recorded from 1992 through 1996, 178 (11%) were experienced by Hispanic workers. In the most recent five-years of CFOI data, from 2009 through 2013, the Hispanic share of electrical fatalities doubled, to 22%, of the total (175 of 803 fatalities). The Hispanic share of electrical fatalities is
100
150
200
250
300
350
400
1990 1995 2000 2005 2010 2015
Fat
alit
ies
Year
Fatal Work-Related Electrical Injuries in the United States, 1992-2013
13
also disproportionately high relative to the percentage of the U.S. labor force that is Hispanic, which stood at 16% in 2012 (U.S. Bureau of Labor Statistics, 2013). This data clearly suggests that special efforts may be needed to target electrical safety training to Hispanic workers.
Analysis of electrical fatalities, 2004-2013
In the 10-year period from 2004 through 2013, CFOI recorded 1,962 fatal electrical injuries. The data show a clear decline in electrical injuries over the 10-year period, with 1159 fatalities taking place in the first half of the period (2004-2008) and 803 in the second half (2009-2013), a 31% decrease. The downward trend was consistent, with drops occurring from one year to the next in eight of the 10 years. As with the complete compilation of CFOI data, nearly all of the fatal injuries were electrocutions (99%), with 19 of the injuries (1%) classified as burns.
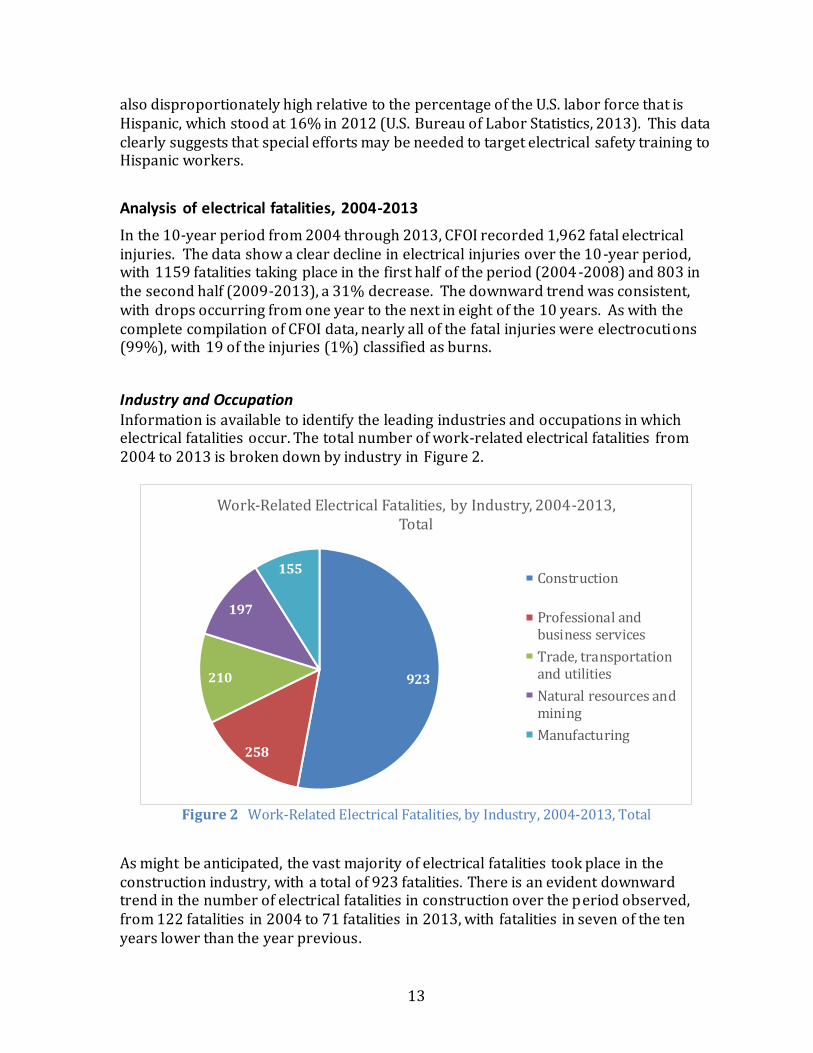
Industry and Occupation Information is available to identify the leading industries and occupations in which electrical fatalities occur. The total number of work-related electrical fatalities from 2004 to 2013 is broken down by industry in Figure 2.
Figure 2 Work-Related Electrical Fatalities, by Industry, 2004-2013, Total
As might be anticipated, the vast majority of electrical fatalities took place in the construction industry, with a total of 923 fatalities. There is an evident downward trend in the number of electrical fatalities in construction over the period observed, from 122 fatalities in 2004 to 71 fatalities in 2013, with fatalities in seven of the ten years lower than the year previous.
923
258
210
197
155
Work-Related Electrical Fatalities, by Industry, 2004-2013, Total
Construction
Professional andbusiness services
Trade, transportationand utilities
Natural resources andmining
Manufacturing
14
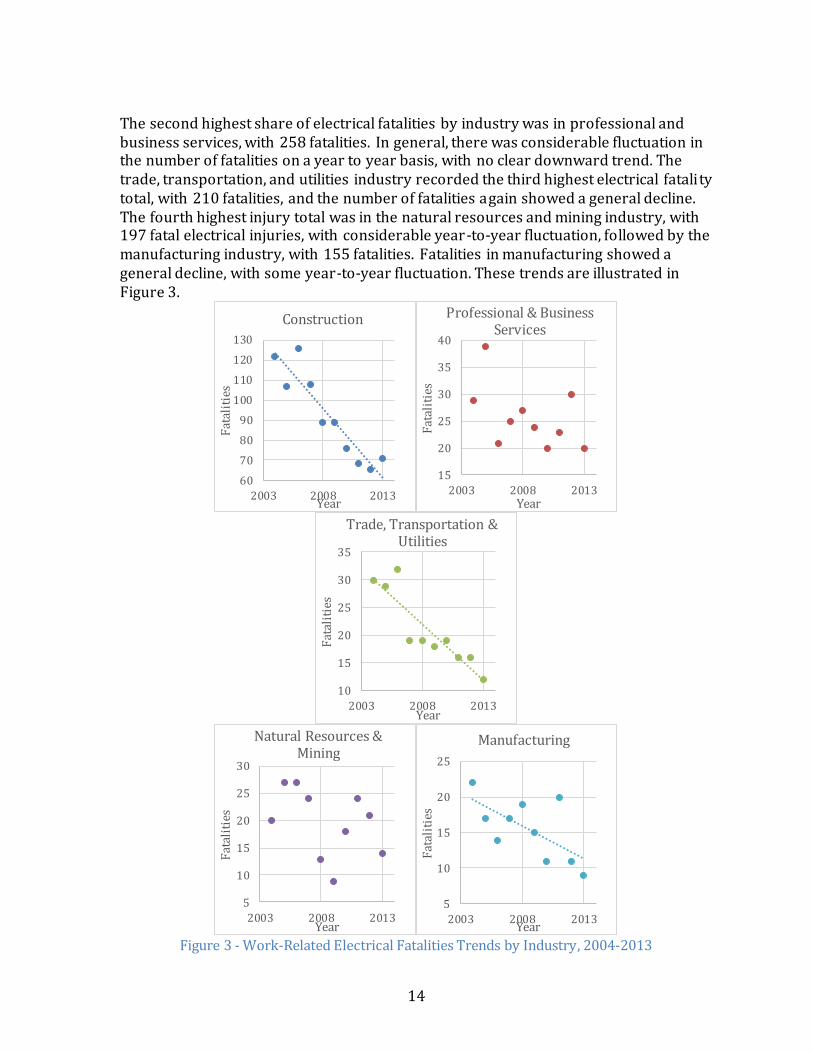
The second highest share of electrical fatalities by industry was in professional and business services, with 258 fatalities. In general, there was considerable fluctuation in the number of fatalities on a year to year basis, with no clear downward trend. The trade, transportation, and utilities industry recorded the third highest electrical fatality total, with 210 fatalities, and the number of fatalities again showed a general decline. The fourth highest injury total was in the natural resources and mining industry, with 197 fatal electrical injuries, with considerable year-to-year fluctuation, followed by the manufacturing industry, with 155 fatalities. Fatalities in manufacturing showed a general decline, with some year-to-year fluctuation. These trends are illustrated in Figure 3.
Figure 3 - Work-Related Electrical Fatalities Trends by Industry, 2004-2013
60
70
80
90
100
110
120
130
2003 2008 2013
Fat
alit
ies
Year
Construction
15
20
25
30
35
40
2003 2008 2013
Fat
alit
ies
Year
Professional & Business Services
10
15
20
25
30
35
2003 2008 2013
Fat
alit
ies
Year
Trade, Transportation & Utilities
5
10
15
20
25
30
2003 2008 2013
Fat
alit
ies
Year
Natural Resources & Mining
5
10
15
20
25
2003 2008 2013
Fat
alit
ies
Year
Manufacturing
15
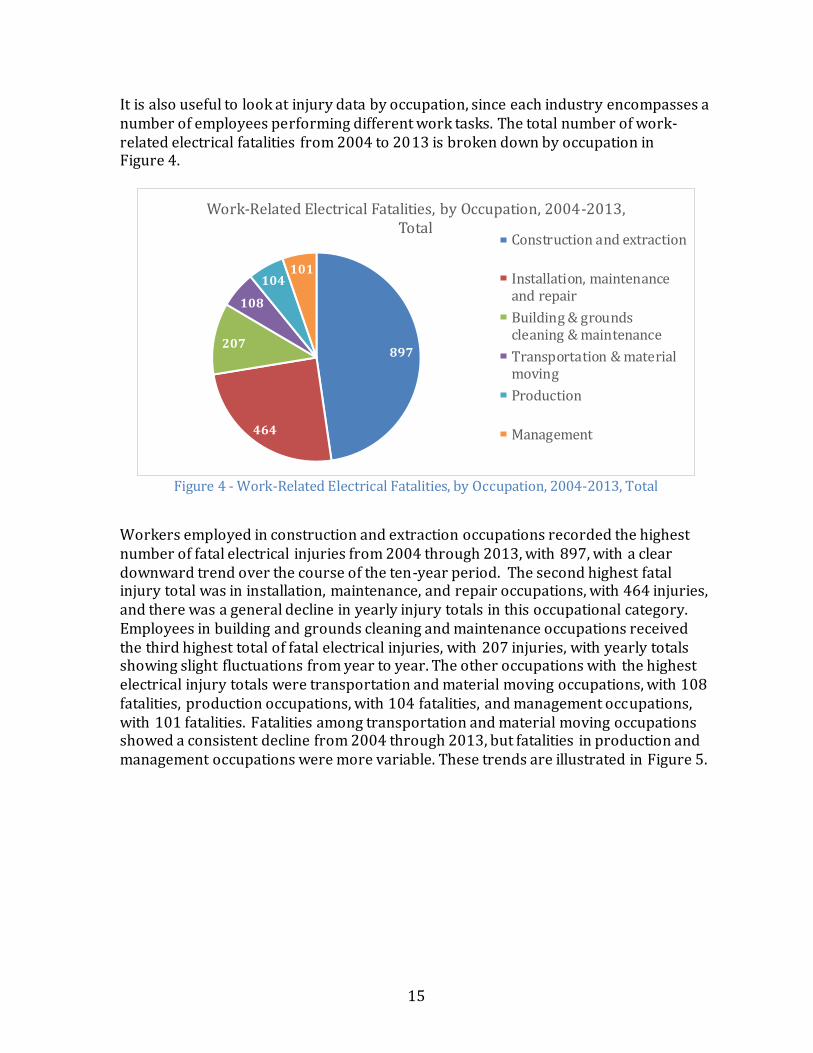
It is also useful to look at injury data by occupation, since each industry encompasses a number of employees performing different work tasks. The total number of work-related electrical fatalities from 2004 to 2013 is broken down by occupation in Figure 4.
Figure 4 - Work-Related Electrical Fatalities, by Occupation, 2004-2013, Total
Workers employed in construction and extraction occupations recorded the highest number of fatal electrical injuries from 2004 through 2013, with 897, with a clear downward trend over the course of the ten-year period. The second highest fatal injury total was in installation, maintenance, and repair occupations, with 464 injuries, and there was a general decline in yearly injury totals in this occupational category. Employees in building and grounds cleaning and maintenance occupations received the third highest total of fatal electrical injuries, with 207 injuries, with yearly totals showing slight fluctuations from year to year. The other occupations with the highest electrical injury totals were transportation and material moving occupations, with 108 fatalities, production occupations, with 104 fatalities, and management occupations, with 101 fatalities. Fatalities among transportation and material moving occupations showed a consistent decline from 2004 through 2013, but fatalities in production and management occupations were more variable. These trends are illustrated in Figure 5.
897
464
207
108
104101
Work-Related Electrical Fatalities, by Occupation, 2004-2013, Total
Construction and extraction
Installation, maintenanceand repair
Building & groundscleaning & maintenance
Transportation & materialmoving
Production
Management

16
Figure 5 - Work-Related Electrical Fatalities Trends by Occupation, 2004-2013
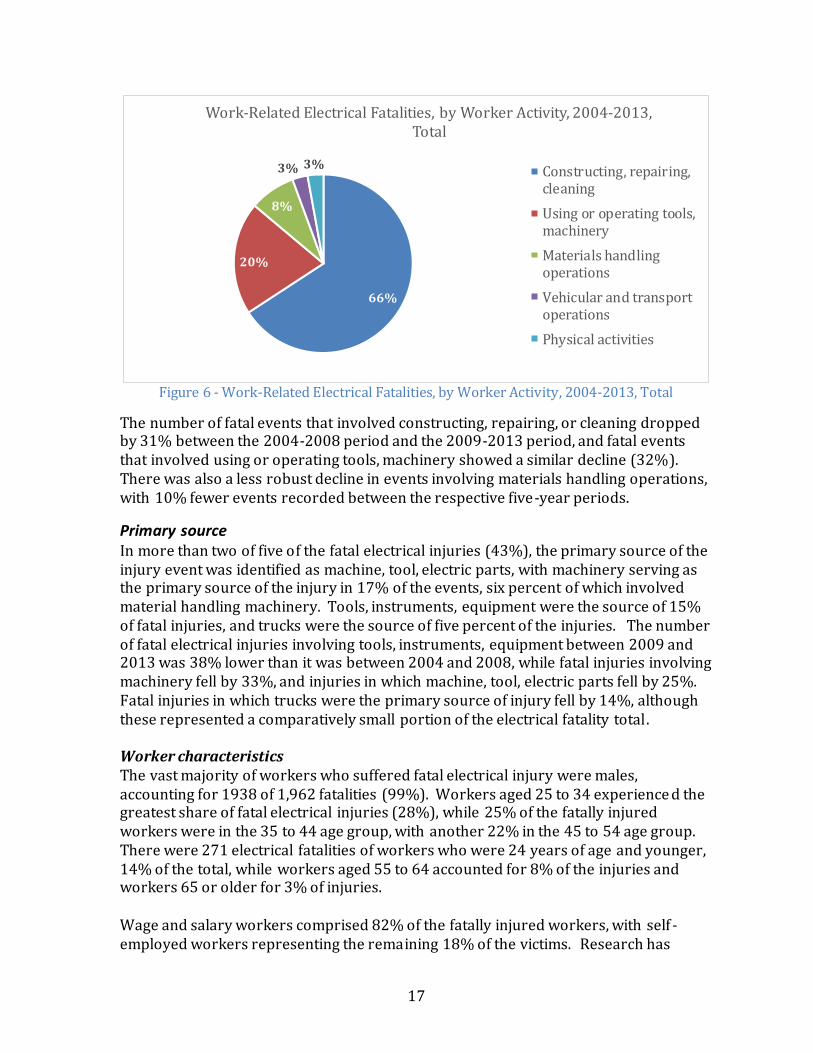
Work activity while injured More than three in five of the fatal electrical injuries (66%) occurred while the worker was engaged in a constructing, repairing, or cleaning activity, and o ne-fifth occurred while the worker was using or operating tools or machinery. Workers were engaged in materials handling operations in 8% of the injury events. Other worker activities included vehicular and transport operations (3%) and physical activities (3%). This breakdown of total fatalities by worker activity for the years 2004-2013 is presented in Figure 6 below.
60
80
100
120
140
2003 2013
Fat
alit
ies
Year
Construction & Extraction
25
35
45
55
65
2003 2013
Fat
alit
ies
Year
Installation, Maintenance & Repair
12
17
22
27
2003 2013
Fat
alit
ies
Year
Building & Grounds Cleaning &
Maintenance
0
5
10
15
20
25
30
2003 2008 2013
Fat
alit
ies
Year
Transportation & Material Moving
0
5
10
15
20
2003 2008 2013
Fat
alit
ies
Year
Production
0
2
4
6
8
10
12
14
16
2003 2013
Fat
alit
ies
Year
Management
17
Figure 6 - Work-Related Electrical Fatalities, by Worker Activity, 2004-2013, Total
The number of fatal events that involved constructing, repairing, or cleaning dropped by 31% between the 2004-2008 period and the 2009-2013 period, and fatal events that involved using or operating tools, machinery showed a similar decline (32%). There was also a less robust decline in events involving materials handling operations, with 10% fewer events recorded between the respective five-year periods.
Primary source In more than two of five of the fatal electrical injuries (43%), the primary source of the injury event was identified as machine, tool, electric parts, with machinery serving as the primary source of the injury in 17% of the events, six percent of which involved material handling machinery. Tools, instruments, equipment were the source of 15% of fatal injuries, and trucks were the source of five percent of the injuries. The number of fatal electrical injuries involving tools, instruments, equipment between 2009 and 2013 was 38% lower than it was between 2004 and 2008, while fatal injuries involving machinery fell by 33%, and injuries in which machine, tool, electric parts fell by 25%. Fatal injuries in which trucks were the primary source of injury fell by 14%, although these represented a comparatively small portion of the electrical fatality total. Worker characteristics The vast majority of workers who suffered fatal electrical injury were males, accounting for 1938 of 1,962 fatalities (99%). Workers aged 25 to 34 experience d the greatest share of fatal electrical injuries (28%), while 25% of the fatally injured workers were in the 35 to 44 age group, with another 22% in the 45 to 54 age group. There were 271 electrical fatalities of workers who were 24 years of age and younger, 14% of the total, while workers aged 55 to 64 accounted for 8% of the injuries and workers 65 or older for 3% of injuries. Wage and salary workers comprised 82% of the fatally injured workers, with self -employed workers representing the remaining 18% of the victims. Research has
66%
20%
8%
3% 3%
Work-Related Electrical Fatalities, by Worker Activity, 2004-2013, Total
Constructing, repairing,cleaning
Using or operating tools,machinery
Materials handlingoperations
Vehicular and transportoperations
Physical activities
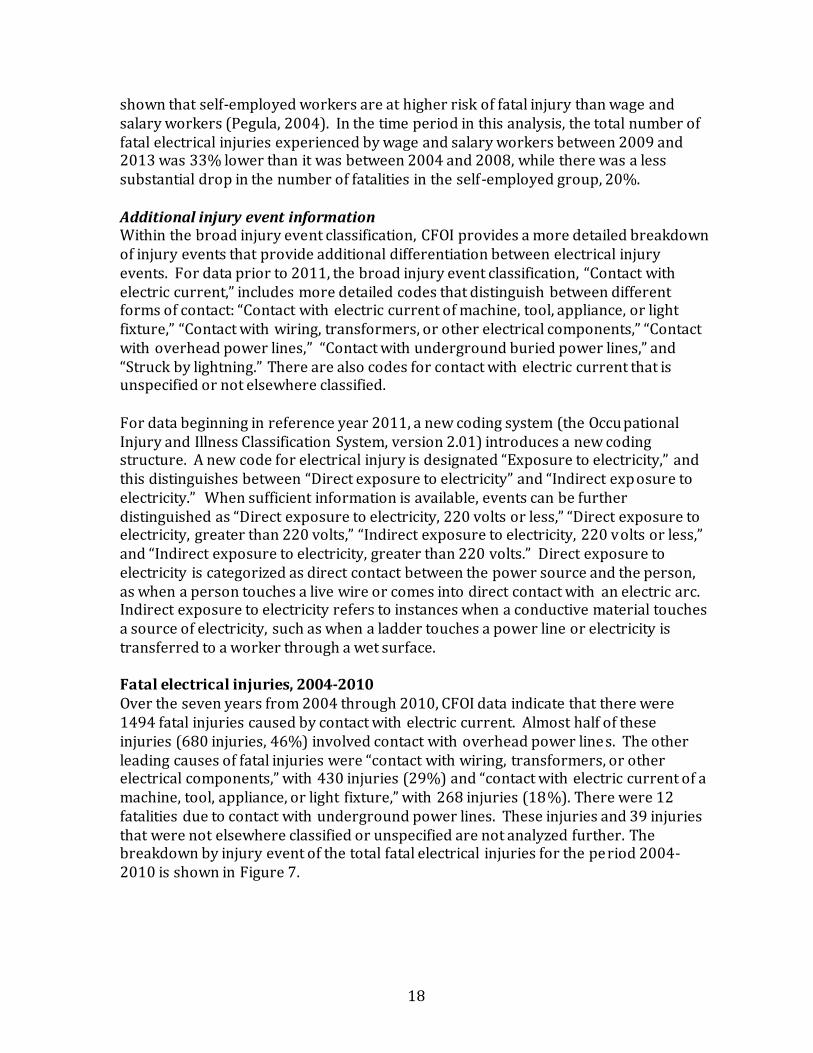
18
shown that self-employed workers are at higher risk of fatal injury than wage and salary workers (Pegula, 2004). In the time period in this analysis, the total number of fatal electrical injuries experienced by wage and salary workers between 2009 and 2013 was 33% lower than it was between 2004 and 2008, while there was a less substantial drop in the number of fatalities in the self-employed group, 20%. Additional injury event information Within the broad injury event classification, CFOI provides a more detailed breakdown of injury events that provide additional differentiation between electrical injury events. For data prior to 2011, the broad injury event classification, “Contact with electric current,” includes more detailed codes that distinguish between different forms of contact: “Contact with electric current of machine, tool, appliance, or light fixture,” “Contact with wiring, transformers, or other electrical components,” “Contact with overhead power lines,” “Contact with underground buried power lines,” and “Struck by lightning.” There are also codes for contact with electric current that is unspecified or not elsewhere classified. For data beginning in reference year 2011, a new coding system (the Occu pational Injury and Illness Classification System, version 2.01) introduces a new coding structure. A new code for electrical injury is designated “Exposure to electricity,” and this distinguishes between “Direct exposure to electricity” and “Indirect exposure to electricity.” When sufficient information is available, events can be further distinguished as “Direct exposure to electricity, 220 volts or less,” “Direct exposure to electricity, greater than 220 volts,” “Indirect exposure to electricity, 220 volts or less,” and “Indirect exposure to electricity, greater than 220 volts.” Direct exposure to electricity is categorized as direct contact between the power source and the person, as when a person touches a live wire or comes into direct contact with an electric arc. Indirect exposure to electricity refers to instances when a conductive material touches a source of electricity, such as when a ladder touches a power line or electricity is transferred to a worker through a wet surface. Fatal electrical injuries, 2004-2010 Over the seven years from 2004 through 2010, CFOI data indicate that there were 1494 fatal injuries caused by contact with electric current. Almost half of these injuries (680 injuries, 46%) involved contact with overhead power lines. The other leading causes of fatal injuries were “contact with wiring, transformers, or other electrical components,” with 430 injuries (29%) and “contact with electric current of a machine, tool, appliance, or light fixture,” with 268 injuries (18%). There were 12 fatalities due to contact with underground power lines. These injuries and 39 injuries that were not elsewhere classified or unspecified are not analyzed further. The breakdown by injury event of the total fatal electrical injuries for the period 2004-2010 is shown in Figure 7.
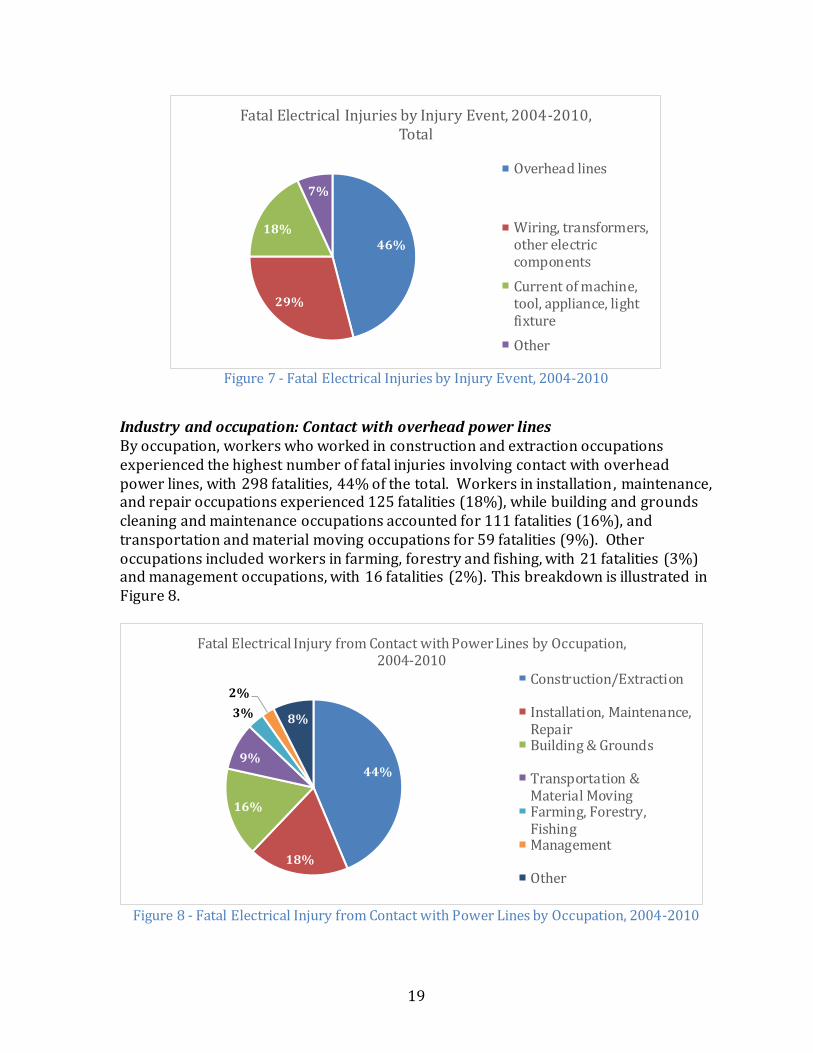
19
Figure 7 - Fatal Electrical Injuries by Injury Event, 2004-2010
Industry and occupation: Contact with overhead power lines By occupation, workers who worked in construction and extraction occupations experienced the highest number of fatal injuries involving contact with overhead power lines, with 298 fatalities, 44% of the total. Workers in installation, maintenance, and repair occupations experienced 125 fatalities (18%), while building and grounds cleaning and maintenance occupations accounted for 111 fatalities (16%), and transportation and material moving occupations for 59 fatalities (9%). Other occupations included workers in farming, forestry and fishing, with 21 fatalities (3%) and management occupations, with 16 fatalities (2%). This breakdown is illustrated in Figure 8.
Figure 8 - Fatal Electrical Injury from Contact with Power Lines by Occupation, 2004-2010
46%
29%
18%
7%
Fatal Electrical Injuries by Injury Event, 2004-2010, Total
Overhead lines
Wiring, transformers,other electriccomponents
Current of machine,tool, appliance, lightfixture
Other
44%
18%
16%
9%
3%
2%
8%
Fatal Electrical Injury from Contact with Power Lines by Occupation, 2004-2010
Construction/Extraction
Installation, Maintenance,RepairBuilding & Grounds
Transportation &Material MovingFarming, Forestry,FishingManagement
Other
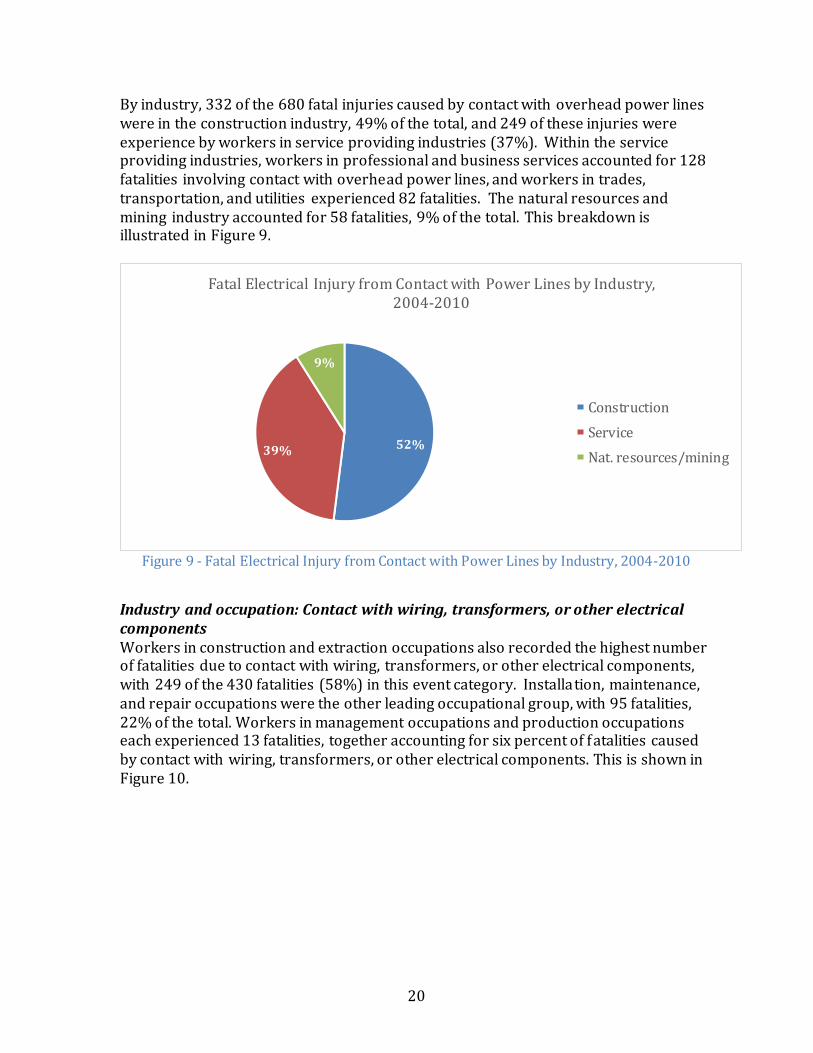
20
By industry, 332 of the 680 fatal injuries caused by contact with overhead power lines were in the construction industry, 49% of the total, and 249 of these injuries were experience by workers in service providing industries (37%). Within the service providing industries, workers in professional and business services accounted for 128 fatalities involving contact with overhead power lines, and workers in trades, transportation, and utilities experienced 82 fatalities. The natural resources and mining industry accounted for 58 fatalities, 9% of the total. This breakdown is illustrated in Figure 9.
Figure 9 - Fatal Electrical Injury from Contact with Power Lines by Industry, 2004-2010
Industry and occupation: Contact with wiring, transformers, or other electrical components Workers in construction and extraction occupations also recorded the highest number of fatalities due to contact with wiring, transformers, or other electrical components, with 249 of the 430 fatalities (58%) in this event category. Installation, maintenance, and repair occupations were the other leading occupational group, with 95 fatalities, 22% of the total. Workers in management occupations and production occupations each experienced 13 fatalities, together accounting for six percent of fatalities caused by contact with wiring, transformers, or other electrical components. This is shown in Figure 10.
52%39%
9%
Fatal Electrical Injury from Contact with Power Lines by Industry, 2004-2010
Construction
Service
Nat. resources/mining
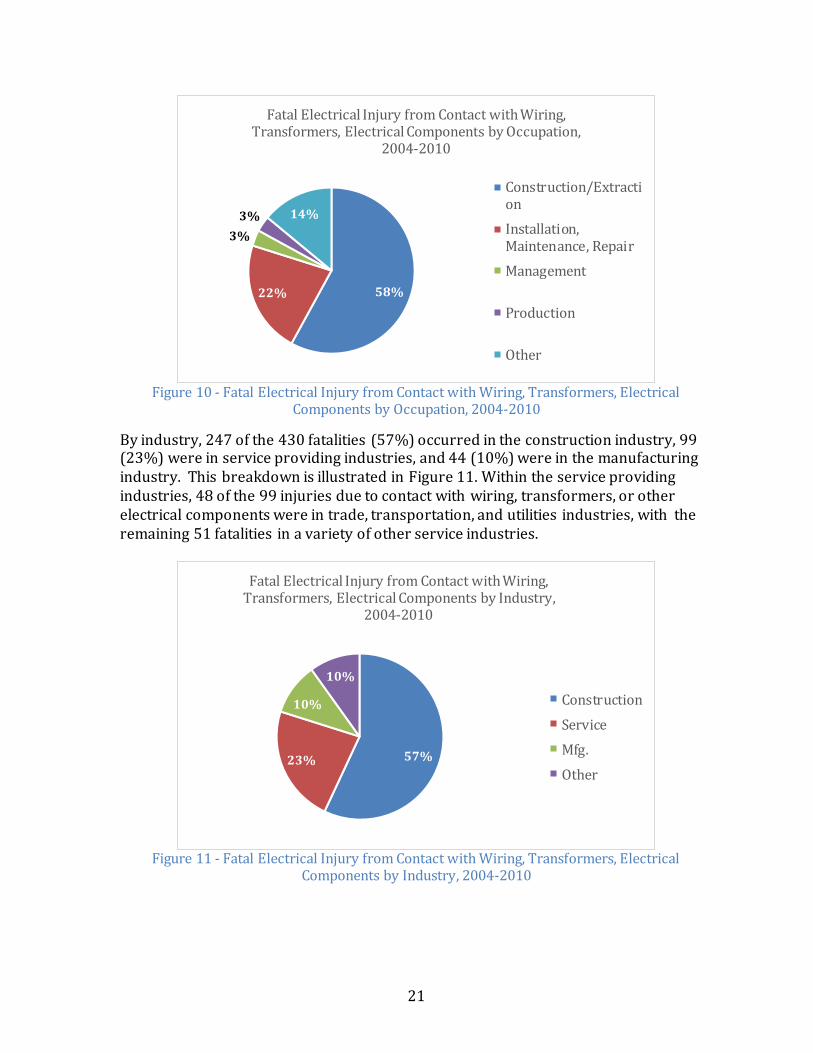
21
Figure 10 - Fatal Electrical Injury from Contact with Wiring, Transformers, Electrical
Components by Occupation, 2004-2010
By industry, 247 of the 430 fatalities (57%) occurred in the construction industry, 99 (23%) were in service providing industries, and 44 (10%) were in the manufacturing industry. This breakdown is illustrated in Figure 11. Within the service providing industries, 48 of the 99 injuries due to contact with wiring, transformers, or other electrical components were in trade, transportation, and utilities industries, with the remaining 51 fatalities in a variety of other service industries.
Figure 11 - Fatal Electrical Injury from Contact with Wiring, Transformers, Electrical
Components by Industry, 2004-2010
58%22%
3%
3% 14%
Fatal Electrical Injury from Contact with Wiring, Transformers, Electrical Components by Occupation,
2004-2010
Construction/Extraction
Installation,Maintenance, Repair
Management
Production
Other
57%23%
10%
10%
Fatal Electrical Injury from Contact with Wiring, Transformers, Electrical Components by Industry,
2004-2010
Construction
Service
Mfg.
Other
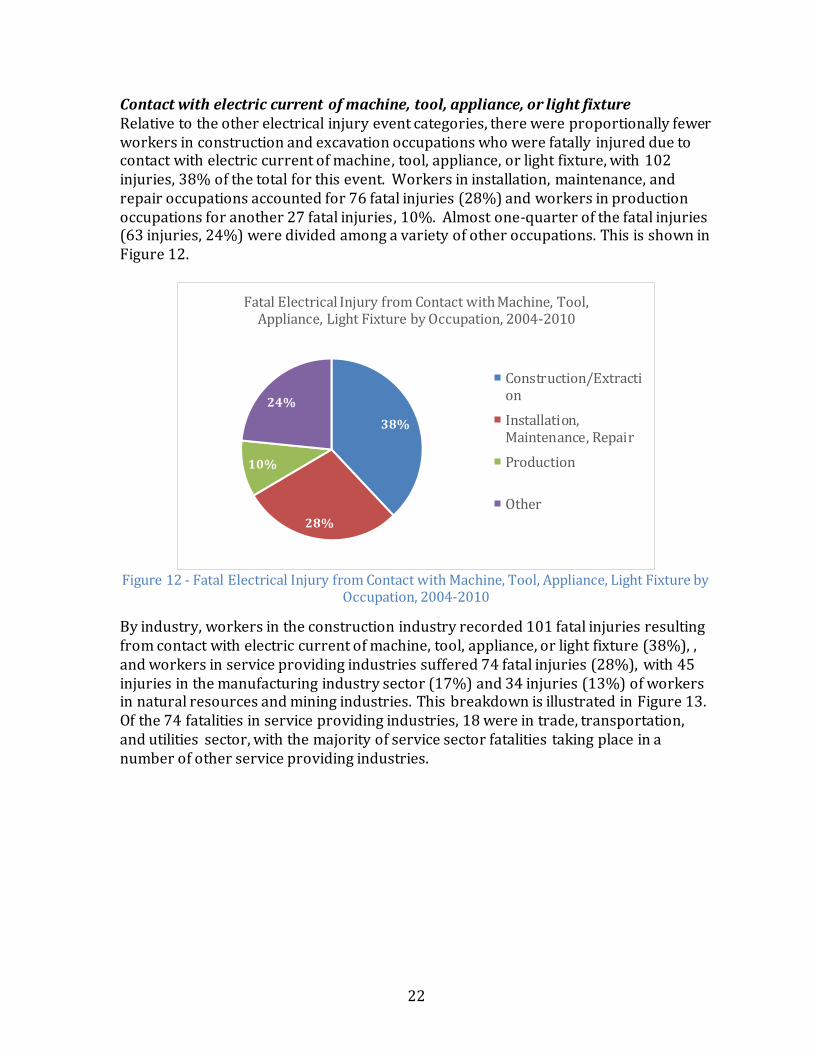
22
Contact with electric current of machine, tool, appliance, or light fixture Relative to the other electrical injury event categories, there were proportionally fewer workers in construction and excavation occupations who were fatally injured due to contact with electric current of machine, tool, appliance, or light fixture, with 102 injuries, 38% of the total for this event. Workers in installation, maintenance, and repair occupations accounted for 76 fatal injuries (28%) and workers in production occupations for another 27 fatal injuries, 10%. Almost one-quarter of the fatal injuries (63 injuries, 24%) were divided among a variety of other occupations. This is shown in Figure 12.
Figure 12 - Fatal Electrical Injury from Contact with Machine, Tool, Appliance, Light Fixture by
Occupation, 2004-2010
By industry, workers in the construction industry recorded 101 fatal injuries resulting from contact with electric current of machine, tool, appliance, or light fixture (38%), , and workers in service providing industries suffered 74 fatal injuries (28%), with 45 injuries in the manufacturing industry sector (17%) and 34 injuries (13%) of workers in natural resources and mining industries. This breakdown is illustrated in Figure 13. Of the 74 fatalities in service providing industries, 18 were in trade, transportation, and utilities sector, with the majority of service sector fatalities taking place in a number of other service providing industries.
38%
28%
10%
24%
Fatal Electrical Injury from Contact with Machine, Tool, Appliance, Light Fixture by Occupation, 2004-2010
Construction/Extraction
Installation,Maintenance, Repair
Production
Other

23
Figure 13 - Fatal Electrical Injury from Contact with Machine, Tool, Appliance, Light Fixture by
Industry, 2004-2010
Fatal electrical injuries, 2011-2013 CFOI data for the years from 2011 through 2013 show that there were 469 fatal injuries due to exposure to electricity over this three-year period. Of these, 255 of the injuries (54%) resulted from direct exposure to electricity, and 201 injuries (43%) resulted from indirect exposure to electricity. An additional 13 fatalities (3%) were not included in either category, shown in Figure 14.
Figure 14 - Fatal Electrical Injury Events, 2011-2013
Information on voltage was available for 422 electrical fatalities, 90% of the total. As would be expected, the majority of these fatalities involved exposure to electricity of greater than 220 volts – 331 fatalities, representing 78% of the fatalities with known
38%
28%
13%
17%
4%
Fatal Electrical Injury from Contact with Machine, Tool, Appliance, Light Fixture by Industry, 2004-2010
Construction
Service
Nat. resources/mining
Mfg.
Other
54%
43%
3%
Fatal Electrical Injury Events, 2011-2013
Direct
Indirect
Not reported

24
voltage (71% of all electrical fatalities in this period). However, the CFOI data indicate that exposure to electricity at voltages of 220 volts or less can also be fatal, with 91 fatalities at this level over the three years, 22% of fatalities with known voltage and 19% of all electrical fatalities over this period, shown in Figure 15. The majority of the fatal injuries at 220 volts or less involved direct exposure to electricity (70 of 91, 77%), and these represented more than one-quarter (27%) of the 255 fatalities due to direct exposure to electricity.
Figure 15 - Fatal Electrical Injury Events by Voltage, Known Voltage, 2011-2013
Work activity while injured The vast majority of workers who were fatally injured through direct exposure to electricity were engaged in a constructing, repairing or cleaning activity, accounting for 195 of the 255 injuries (76%). Another 15% of the fatal injuries resulting from direct exposure to electricity were using or operating tools or machinery (38 fatal injuries). Constructing, repairing, or cleaning was also the leading activity for workers who were fatally injured through indirect exposure to electricity, but with a considerably smaller share of injuries – 41% (82 of 201 fatal injuries). Workers were using or operating tools or machinery in another 31% of fatal injuries from indirect exposure to electricity (63 fatal injuries), while 40 workers were fatally injured through indirect exposure to electricity while engaged in materials handling (20%). This is illustrated in Figure 16.
78%
22%
Fatal Electrical Injury Events by Voltage, Known Voltage, 2011-2013
> 220v
≤ 220v

25
Figure 16 - Fatal Electrical Injury Events by Work Activity
Industry and occupation Nearly half (47%) of the workers whose fatal injuries resulted from direct exposure to electricity were in construction and extraction occupations (119 of 255 fatal injuries), with 28% from installation, maintenance, and repair occupations (72 fatal injuries), and 7% from building and grounds cleaning and maintenance occupations (17 fatal injuries). Workers in construction and extraction occupations accounted for 43% of the injuries that resulted from indirect exposure to electricity (86 of 201 fatal injuries), followed by workers in buildings and grounds cleaning and maintenance, with 39 injuries (19%), farming, fishing, and forestry occupations, with 21 fatal injuries (10%), and installation, maintenance, and repair occupations, with 20 fatal injuries (10%). This is shown in Figure 17.
Figure 17 - Direct and Indirect Fatal Exposure to Electricity, by Occupation, 2011-2013
195
82
38
63
40
22
16
0
50
100
150
200
250
300
Direct Indirect
Fat
alit
ies
Exposure Type
Fatal Electrical Injury Events by Work Activity
Other
Materials Handling
Using or Operating Toolsor Machinery
Constructing, Repairing,or Cleaning
0
50
100
150
200
250
300
Direct Indirect
Fat
alit
ies
Exposure Type
Direct and Indirect Fatal Exposure to Electricity, by Occupation, 2011-2013
Other
Farming, Fishing, &Forestry
Building & Ground Cleaning& Maintenance
Installation, Maintenance,& Repair
Construction & Extraction

26
By industry, 45% of the workers fatally injured from direct exposure to electricity were in the construction industry (116 of 255 fatal injuries), with 28% of workers in service providing industries (72 fatal injuries), workers in the natural resources and mining industry with 11% (28 fatal injuries), and manufacturing industry workers, also with 11% and 28 fatal injuries. Of the fatal injuries in the service providing industries, 27 workers were in professional and business services and 26 workers were in trade, transportation, and utilities. The construction industry also accounted for the highest number of fatal injuries through indirect exposure to electricity, with 41% (82 of 201 fatal injuries), followed by service providing industries (36%, 72 fatal injuries), and natural resources and mining with 15% (31 fatal injuries). Workers in professional and business services accounted for the vast majority of fatalities in the service providing industries (46 of 72 fatalities). Workers in trade, transportation, and utilities accounted for another 16 of the service sector fatalities from indirect exposure to electricity. This is illustrated in Figure 18.
Figure 18 - Direct and Indirect Fatal Exposure to Electricity, by Industry, 2011-2013
Non-fatal Workplace Electrical Injuries, 2003-2012 In addition to maintaining data on fatal work injuries through the Census of Fatal Occupational Injuries, the U.S. Bureau of Labor Statistics also maintains data on non -fatal occupational injuries. This section will focus on the most recent 10-year period for which injury data is available, which for non-fatal injuries is the period from 2003 through 2012. We will note that, as with the fatal injury data, a new coding system was introduced beginning in reference year 2011, the Occupational Injury Illness and Injury Classification System (OIICS) version 2.01. Among the changes, the primary event code for electrical injury events changed from “contact with electric current” to “exposure to electricity,” with additional code changes for classifying electrical injury events at greater levels of detail, as already indicated in the analysis of electrical
0
50
100
150
200
250
300
Direct Indirect
Fat
alit
ies
Exposure Type
Direct and Indirect Fatal Exposure to Electricity, by Industry, 2011-2013
Other
Service providing
Manufacturing
Construction
Natural resources andmining
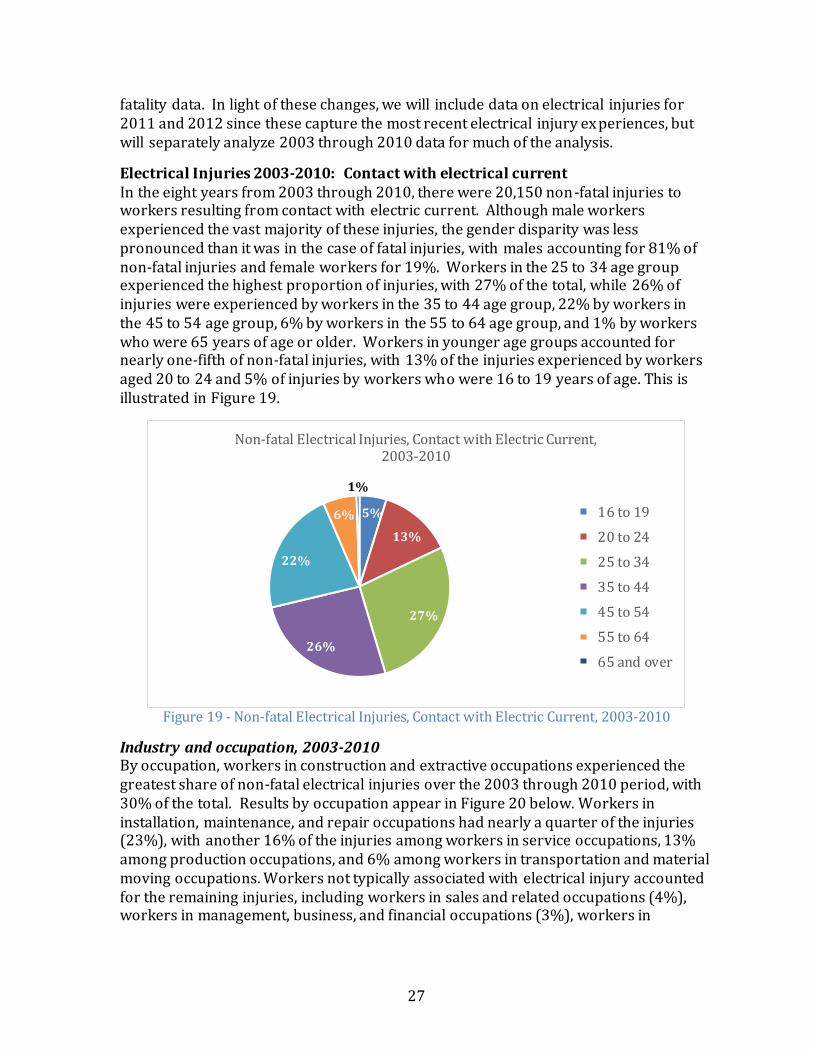
27
fatality data. In light of these changes, we will include data on electrical injuries for 2011 and 2012 since these capture the most recent electrical injury ex periences, but will separately analyze 2003 through 2010 data for much of the analysis.
Electrical Injuries 2003-2010: Contact with electrical current In the eight years from 2003 through 2010, there were 20,150 non-fatal injuries to workers resulting from contact with electric current. Although male workers experienced the vast majority of these injuries, the gender disparity was less pronounced than it was in the case of fatal injuries, with males accounting for 81% of non-fatal injuries and female workers for 19%. Workers in the 25 to 34 age group experienced the highest proportion of injuries, with 27% of the total, while 26% of injuries were experienced by workers in the 35 to 44 age group, 22% by workers in the 45 to 54 age group, 6% by workers in the 55 to 64 age group, and 1% by workers who were 65 years of age or older. Workers in younger age groups accounted for nearly one-fifth of non-fatal injuries, with 13% of the injuries experienced by workers aged 20 to 24 and 5% of injuries by workers who were 16 to 19 years of age. This is illustrated in Figure 19.
Figure 19 - Non-fatal Electrical Injuries, Contact with Electric Current, 2003-2010
Industry and occupation, 2003-2010 By occupation, workers in construction and extractive occupations experienced the greatest share of non-fatal electrical injuries over the 2003 through 2010 period, with 30% of the total. Results by occupation appear in Figure 20 below. Workers in installation, maintenance, and repair occupations had nearly a quarter of the injuries (23%), with another 16% of the injuries among workers in service occupations, 13% among production occupations, and 6% among workers in transportation and material moving occupations. Workers not typically associated with electrical injury accounted for the remaining injuries, including workers in sales and related occupations (4%), workers in management, business, and financial occupations (3%), workers in
5%
13%
27%
26%
22%
6%
1%
Non-fatal Electrical Injuries, Contact with Electric Current, 2003-2010
16 to 19
20 to 24
25 to 34
35 to 44
45 to 54
55 to 64
65 and over
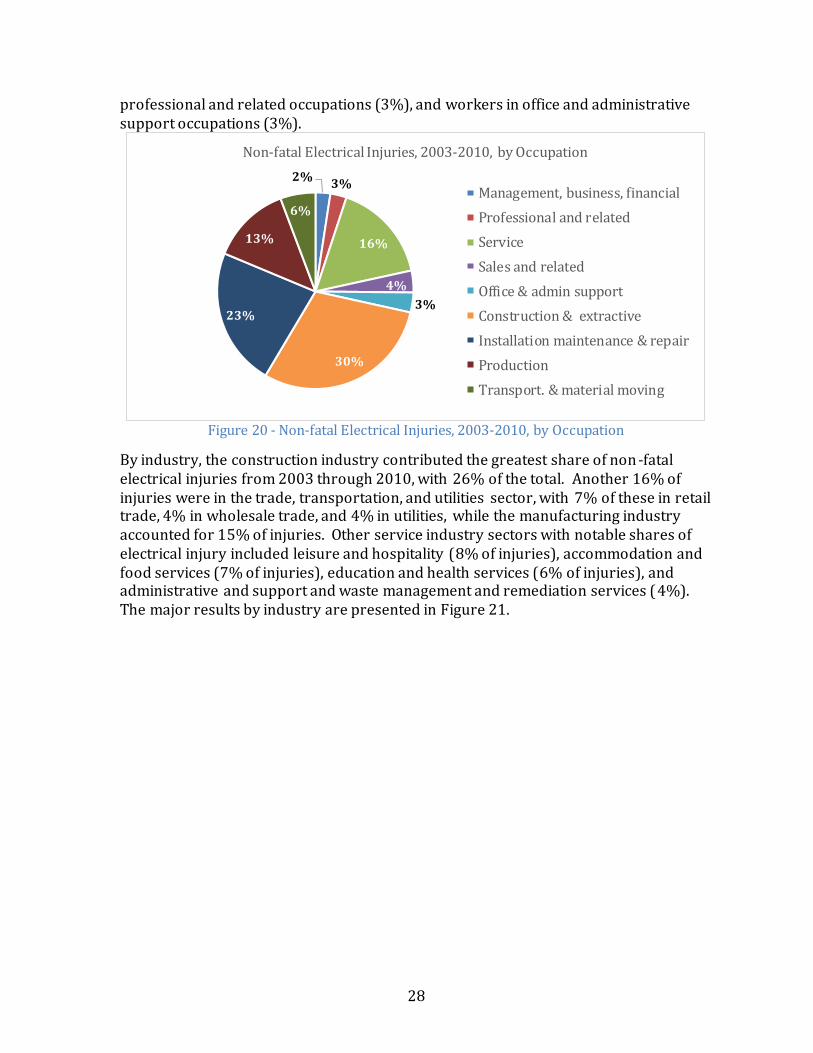
28
professional and related occupations (3%), and workers in office and administrative support occupations (3%).
Figure 20 - Non-fatal Electrical Injuries, 2003-2010, by Occupation
By industry, the construction industry contributed the greatest share of non-fatal electrical injuries from 2003 through 2010, with 26% of the total. Another 16% of injuries were in the trade, transportation, and utilities sector, with 7% of these in retail trade, 4% in wholesale trade, and 4% in utilities, while the manufacturing industry accounted for 15% of injuries. Other service industry sectors with notable shares of electrical injury included leisure and hospitality (8% of injuries), accommodation and food services (7% of injuries), education and health services (6% of injuries), and administrative and support and waste management and remediation services (4%). The major results by industry are presented in Figure 21.
2%3%
16%
4%
3%
30%
23%
13%
6%
Non-fatal Electrical Injuries, 2003-2010, by Occupation
Management, business, financial
Professional and related
Service
Sales and related
Office & admin support
Construction & extractive
Installation maintenance & repair
Production
Transport. & material moving
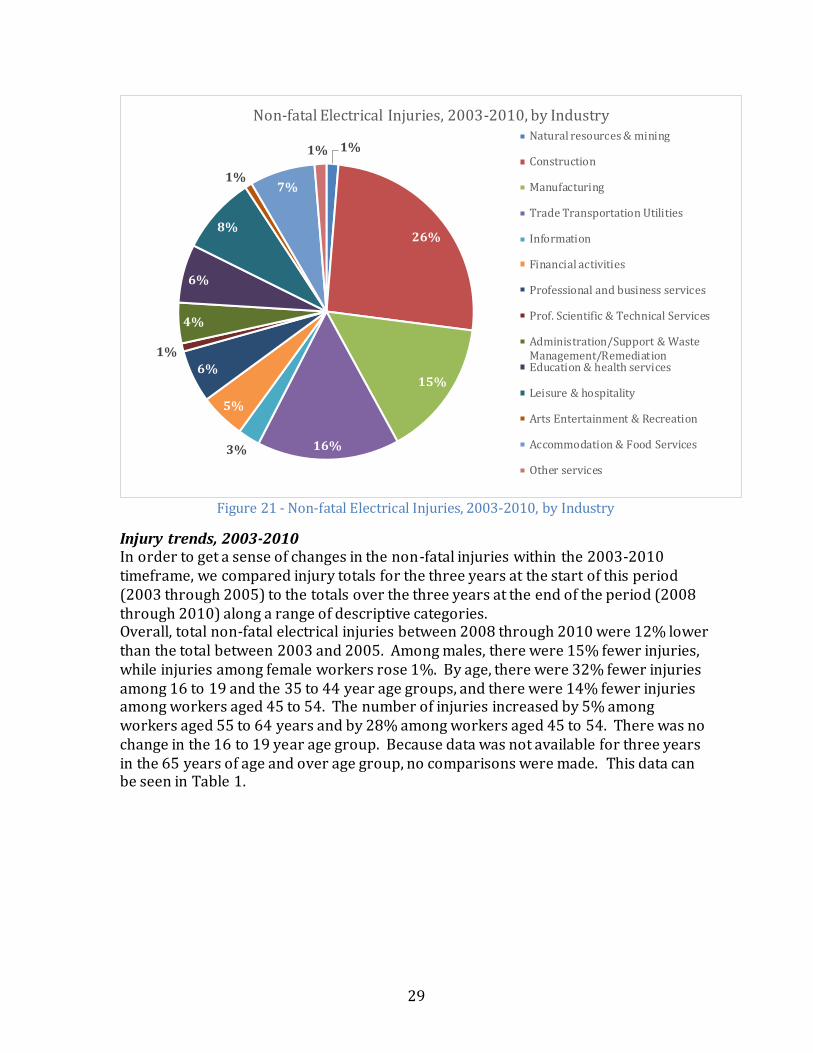
29
Figure 21 - Non-fatal Electrical Injuries, 2003-2010, by Industry
Injury trends, 2003-2010 In order to get a sense of changes in the non-fatal injuries within the 2003-2010 timeframe, we compared injury totals for the three years at the start of this period (2003 through 2005) to the totals over the three years at the end of the period (2008 through 2010) along a range of descriptive categories. Overall, total non-fatal electrical injuries between 2008 through 2010 were 12% lower than the total between 2003 and 2005. Among males, there were 15% fewer injuries, while injuries among female workers rose 1%. By age, there were 32% fewer injuries among 16 to 19 and the 35 to 44 year age groups, and there were 14% fewer injuries among workers aged 45 to 54. The number of injuries increased by 5% among workers aged 55 to 64 years and by 28% among workers aged 45 to 54. There was no change in the 16 to 19 year age group. Because data was not available for three years in the 65 years of age and over age group, no comparisons were made. This data can be seen in Table 1.
1%
26%
15%
16%3%
5%
6%
1%
4%
6%
8%
1%7%
1%
Non-fatal Electrical Injuries, 2003-2010, by IndustryNatural resources & mining
Construction
Manufacturing
Trade Transportation Utilities
Information
Financial activities
Professional and business services
Prof. Scientific & Technical Services
Administration/Support & WasteManagement/RemediationEducation & health services
Leisure & hospitality
Arts Entertainment & Recreation
Accommodation & Food Services
Other services

30
Table 1 - Change in Non-fatal Electrical Injuries, 2003-2005 vs. 2008-2010
Change in Non-fatal Electrical Injuries, 2003-2005 vs. 2008-2010
2003-2005 2008-2010 Pct. Change
Total 7990 7000 -12%
Male 6510 5540 -15% Female 1410 1420 +1%
Age 16 to 19 320 320 --
20 to 24 950 650 -32%
25 to 34 2370 2030 -14%
35 to 44 2230 1510 -32%
45 to 54 1500 1920 +28%
55 to 64 420 440 +5%
The greatest decreases in occupational categories were among production occupations, with a 48% reduction in total injuries, transportation and material moving occupations, with a 44% decrease, sales and related occupations, with a 21% decrease, and construction and extraction occupations, with a 19% decrease. Total injuries were 4% higher for workers in installation, maintenance, and repair occupations, 5% higher for professional and related occupations, 12% for service occupations, and 42% higher for office and administrative support occupations.
Table 2 - Change in Non-fatal Electrical Injuries, 2003-2005 vs. 2008-2010, by Occupation
Change in Non-fatal Electrical Injuries, 2003-2005 vs. 2008-2010, by Occupation
2003-2005 2008-2010 Pct. Change
Professional and related 190 200 +5%
Service 1250 1400 +12%
Sales and related 290 230 -21%
Office and administrative support 190 270 +42%
Construction and extractive 2370 1920 -19%%
Installation maintenance and repair 1820 1890 +4%
Production 1220 640 -48%
Transportation and material moving 550 310 -44%
By industry sector, injuries were 65% lower in wholesale trade, 48% lower in administrative and support and waste management and remediation services, 45% lower in retail trade, 41% lower in trade transportation and utilities, 43% lower in natural resources and mining, 38 % lower in health care and social assistance, 37% lower in manufacturing, and 10% lower in utilities. There was a 153% increase in total injuries in the accommodation and food services sector between the three -year periods, as well as a 75% increase in injuries in the leisure and hospitality industry sector between the three-year periods.

31
Table 3 - Change in Non-fatal Electrical Injuries, 2003-2005 vs. 2008-2010, by Industry
Change in Non-fatal Electrical Injuries, 2003-2005 vs. 2008-2010, by Industry
2003-2005 2008-2010 Pct. Change
Goods producing industries 4100 3010 -27%
Construction 2380 1940 -18%
Manufacturing 1580 990 -37%
Natural resources and mining 140 80 -43%
Service providing industries 3890 4000 +3%
Trade Transportation and Util ities 1700 1010 -41%
Wholesale Trade 480 170 -65%
Retail Trade 710 390 -45%
Util ities 310 280 -10%
Professional and business services 690 420 -39%
Administrative and Support and Waste
Mgmt. and Remediation Services 580 300
-48%
Education and health services 690 460 -33%
Health Care and Social Assistance 610 380 -38%
Leisure and hospitality 480 840 +75%
Accommodation and Food Services 300 760 +153%
Leading electrical injury events, 2003-2010 Among the 20,150 non-fatal injuries due to contact with electric current from 2003 through 2010, shown in Figure 22, the leading injury event was “contact with electric current of machine, tool, appliance, or light fixture,” with 37% of the total (7450 injuries), followed by “contact with wiring, transformers, or other electrical components,” with 35% of the total (7130 injuries). The other injury events included “contact with electric current, unspecified,” “contact with electric current, not elsewhere classified,” “struck by lightning,” “contact with overhead power lines,” and “contact with underground, buried power lines.” It is worth noting that “contact with overhead powerlines,” which was the cause of over 40% of fatal electrical injuries, accounted for only 2% of the non-fatal injuries, indicating that this type of electrical event is overwhelmingly fatal (Brenner and Cawley, 2009).

32
Figure 22 - Non-fatal Electrical Injuries, 2003-2010 by Injury Event
The more detailed analysis which follows will focus on contact with electric current of machine, tool, appliance or light fixture and contact with wiring, transformers, or other electrical components because the other injury events either fall outside the purview of NFPA 70E or do not specify the injury event. Contact with machine, tool, appliance or light fixture The leading cause of non-fatal electrical injuries was “contact with electric current of machines, tools, appliances, or light fixtures” with 7450 injuries from 2003 through 2010. As Figure 23 indicates, these injuries have been trending downward, with the exception of a dramatic increase in 2009. The vast majority of these (70%, 5230 injuries) were experienced by males and 30% (2200 injuries) by females. The proportion of injuries experienced by female workers is higher than is the case in other electrical injury events.
37%
36%
11%
10%
3% 2% 1%
Non-fatal Electrical Injuries, 2003-2010 by Injury Event Contact with elec. current of
machine, tool, appliance, or lightfixtureContact with wiring, transformers,or other electrical components
Contact with electric current,unspecified
Contact with elec. current, n.e.c.
Struck by lightning
Contact with overhead powerlines
Contact with underground, buriedpower lines
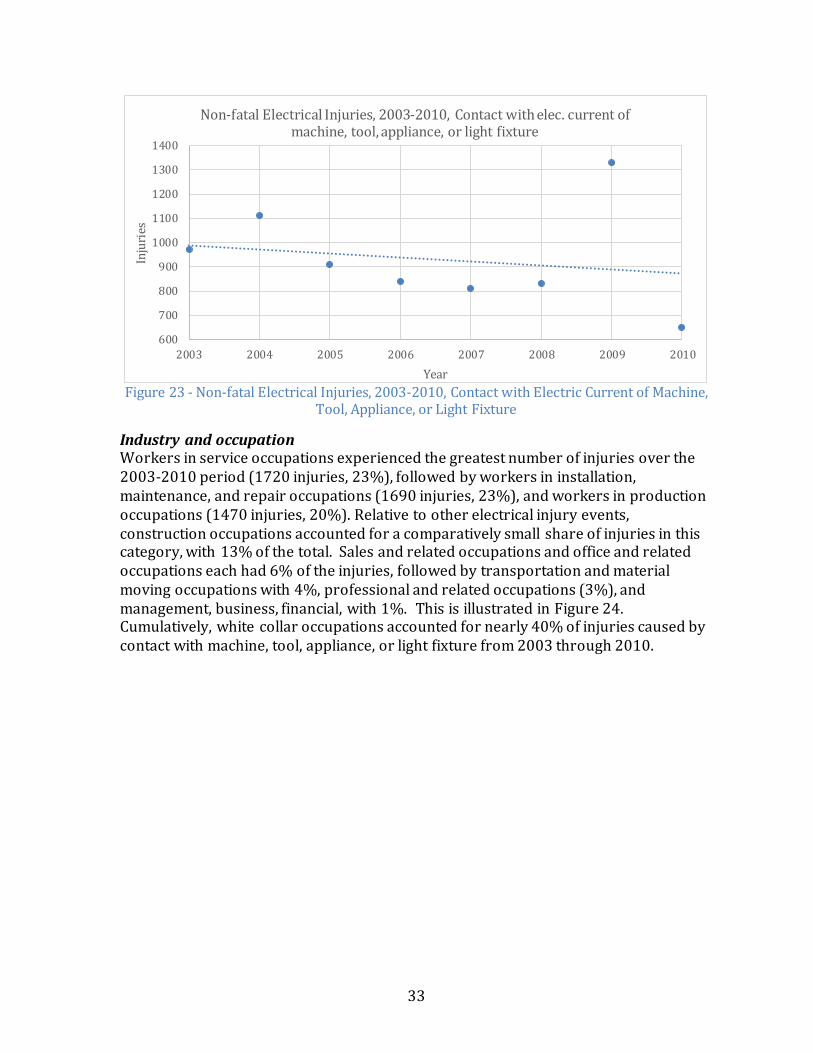
33
Figure 23 - Non-fatal Electrical Injuries, 2003-2010, Contact with Electric Current of Machine,
Tool, Appliance, or Light Fixture
Industry and occupation Workers in service occupations experienced the greatest number of injuries over the 2003-2010 period (1720 injuries, 23%), followed by workers in installation, maintenance, and repair occupations (1690 injuries, 23%), and workers in production occupations (1470 injuries, 20%). Relative to other electrical injury events, construction occupations accounted for a comparatively small share of injuries in this category, with 13% of the total. Sales and related occupations and office and related occupations each had 6% of the injuries, followed by transportation and material moving occupations with 4%, professional and related occupations (3%), and management, business, financial, with 1%. This is illustrated in Figure 24. Cumulatively, white collar occupations accounted for nearly 40% of injuries caused by contact with machine, tool, appliance, or light fixture from 2003 through 2010.
600
700
800
900
1000
1100
1200
1300
1400
2003 2004 2005 2006 2007 2008 2009 2010
Inju
ries
Year
Non-fatal Electrical Injuries, 2003-2010, Contact with elec. current of machine, tool, appliance, or light fixture
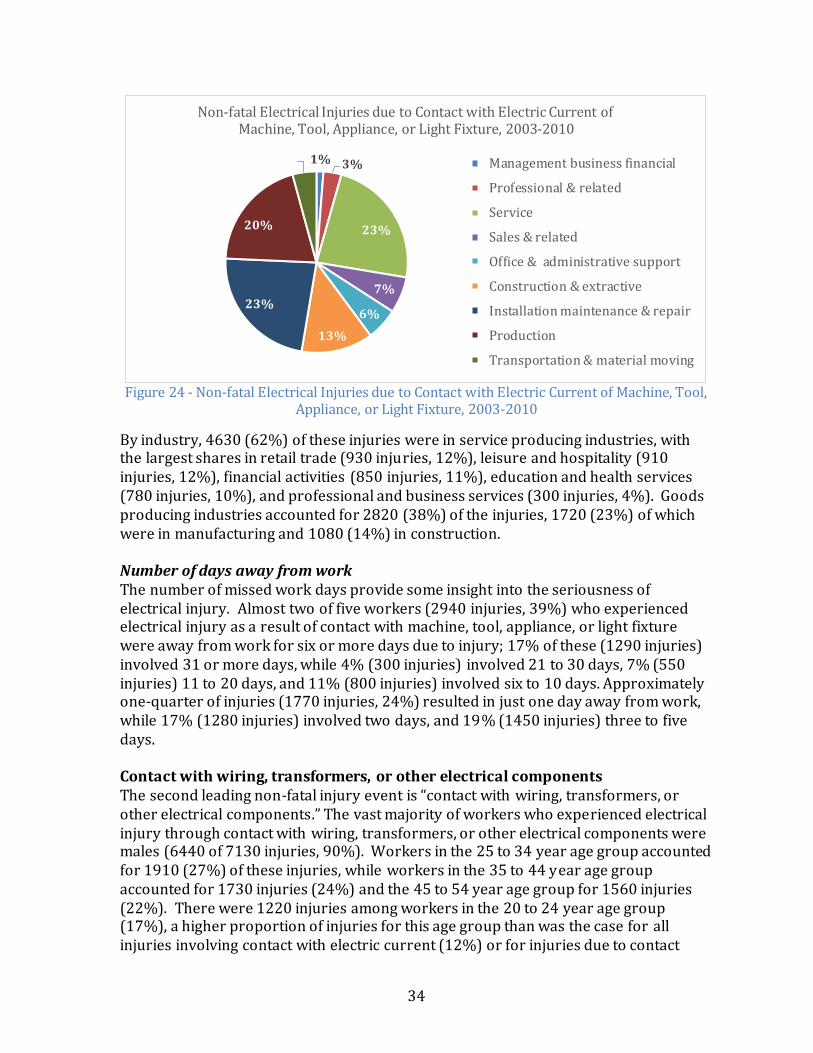
34
Figure 24 - Non-fatal Electrical Injuries due to Contact with Electric Current of Machine, Tool,
Appliance, or Light Fixture, 2003-2010
By industry, 4630 (62%) of these injuries were in service producing industries, with the largest shares in retail trade (930 injuries, 12%), leisure and hospitality (910 injuries, 12%), financial activities (850 injuries, 11%), education and health services (780 injuries, 10%), and professional and business services (300 injuries, 4%). Goods producing industries accounted for 2820 (38%) of the injuries, 1720 (23%) of which were in manufacturing and 1080 (14%) in construction. Number of days away from work The number of missed work days provide some insight into the seriousness of electrical injury. Almost two of five workers (2940 injuries, 39%) who experienced electrical injury as a result of contact with machine, tool, appliance, or light fixture were away from work for six or more days due to injury; 17% of these (1290 injuries) involved 31 or more days, while 4% (300 injuries) involved 21 to 30 days, 7% (550 injuries) 11 to 20 days, and 11% (800 injuries) involved six to 10 days. Approximately one-quarter of injuries (1770 injuries, 24%) resulted in just one day away from work, while 17% (1280 injuries) involved two days, and 19% (1450 injuries) three to five days. Contact with wiring, transformers, or other electrical components The second leading non-fatal injury event is “contact with wiring, transformers, or other electrical components.” The vast majority of workers who experienced electrical injury through contact with wiring, transformers, or other electrical components were males (6440 of 7130 injuries, 90%). Workers in the 25 to 34 year age group accounted for 1910 (27%) of these injuries, while workers in the 35 to 44 year age group accounted for 1730 injuries (24%) and the 45 to 54 year age group for 1560 injuries (22%). There were 1220 injuries among workers in the 20 to 24 year age group (17%), a higher proportion of injuries for this age group than was the case for all injuries involving contact with electric current (12%) or for injuries due to contact
1% 3%
23%
7%
6%
13%
23%
20%
4%
Non-fatal Electrical Injuries due to Contact with Electric Current of Machine, Tool, Appliance, or Light Fixture, 2003-2010
Management business financial
Professional & related
Service
Sales & related
Office & administrative support
Construction & extractive
Installation maintenance & repair
Production
Transportation & material moving
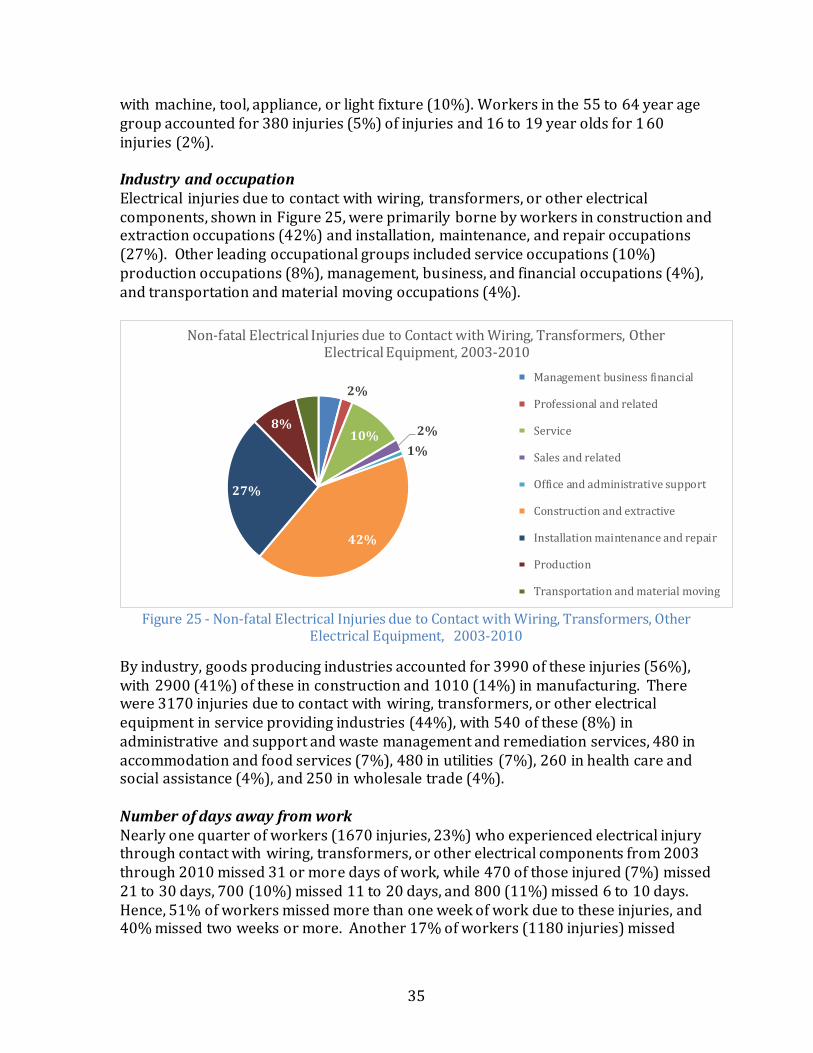
35
with machine, tool, appliance, or light fixture (10%). Workers in the 55 to 64 year age group accounted for 380 injuries (5%) of injuries and 16 to 19 year olds for 1 60 injuries (2%). Industry and occupation Electrical injuries due to contact with wiring, transformers, or other electrical components, shown in Figure 25, were primarily borne by workers in construction and extraction occupations (42%) and installation, maintenance, and repair occupations (27%). Other leading occupational groups included service occupations (10%) production occupations (8%), management, business, and financial occupations (4%), and transportation and material moving occupations (4%).
Figure 25 - Non-fatal Electrical Injuries due to Contact with Wiring, Transformers, Other
Electrical Equipment, 2003-2010
By industry, goods producing industries accounted for 3990 of these injuries (56%), with 2900 (41%) of these in construction and 1010 (14%) in manufacturing. There were 3170 injuries due to contact with wiring, transformers, or other electrical equipment in service providing industries (44%), with 540 of these (8%) in administrative and support and waste management and remediation services, 480 in accommodation and food services (7%), 480 in utilities (7%), 260 in health care and social assistance (4%), and 250 in wholesale trade (4%). Number of days away from work Nearly one quarter of workers (1670 injuries, 23%) who experienced electrical injury through contact with wiring, transformers, or other electrical components from 2003 through 2010 missed 31 or more days of work, while 470 of those injured (7%) missed 21 to 30 days, 700 (10%) missed 11 to 20 days, and 800 (11%) missed 6 to 10 days. Hence, 51% of workers missed more than one week of work due to these injuries, and 40% missed two weeks or more. Another 17% of workers (1180 injuries) missed
4% 2%
10% 2%
1%
42%
27%
8%
4%
Non-fatal Electrical Injuries due to Contact with Wiring, Transformers, Other Electrical Equipment, 2003-2010
Management business financial
Professional and related
Service
Sales and related
Office and administrative support
Construction and extractive
Installation maintenance and repair
Production
Transportation and material moving
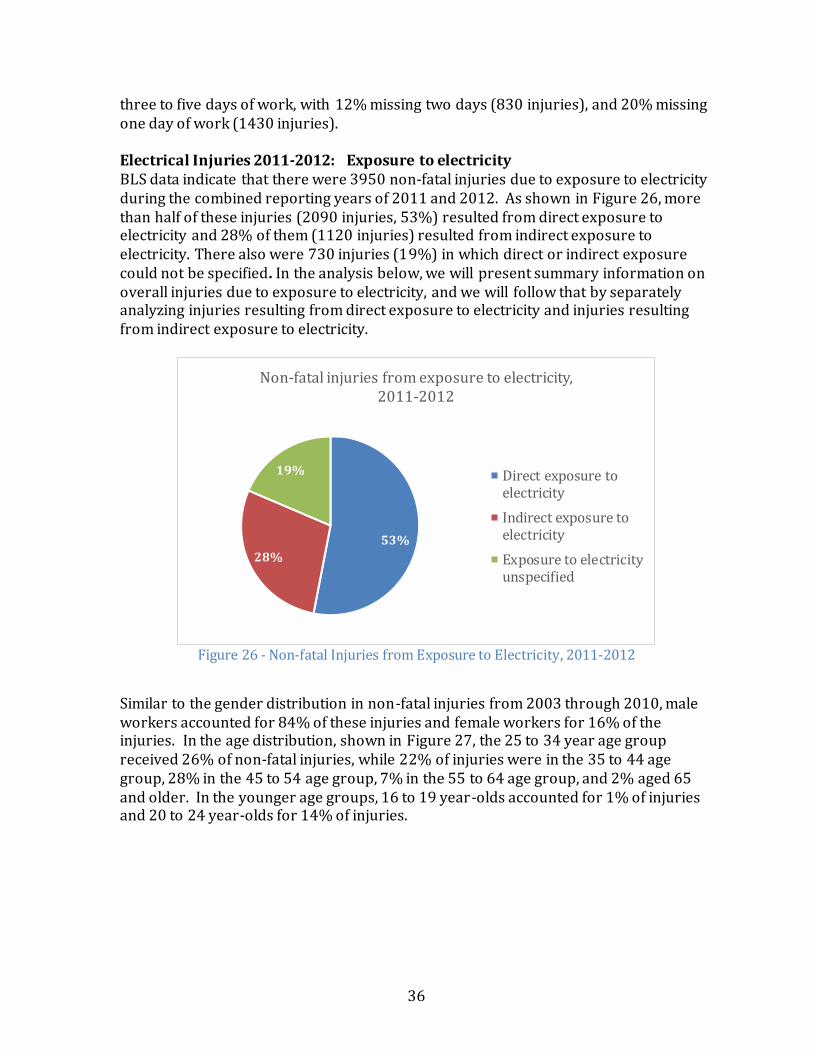
36
three to five days of work, with 12% missing two days (830 injuries), and 20% missing one day of work (1430 injuries). Electrical Injuries 2011-2012: Exposure to electricity BLS data indicate that there were 3950 non-fatal injuries due to exposure to electricity during the combined reporting years of 2011 and 2012. As shown in Figure 26, more than half of these injuries (2090 injuries, 53%) resulted from direct exposure to electricity and 28% of them (1120 injuries) resulted from indirect exposure to electricity. There also were 730 injuries (19%) in which direct or indirect exposure could not be specified. In the analysis below, we will present summary information on overall injuries due to exposure to electricity, and we will follow that by separately analyzing injuries resulting from direct exposure to electricity and injuries resulting from indirect exposure to electricity.
Figure 26 - Non-fatal Injuries from Exposure to Electricity, 2011-2012
Similar to the gender distribution in non-fatal injuries from 2003 through 2010, male workers accounted for 84% of these injuries and female workers for 16% of the injuries. In the age distribution, shown in Figure 27, the 25 to 34 year age group received 26% of non-fatal injuries, while 22% of injuries were in the 35 to 44 age group, 28% in the 45 to 54 age group, 7% in the 55 to 64 age group, and 2% aged 65 and older. In the younger age groups, 16 to 19 year-olds accounted for 1% of injuries and 20 to 24 year-olds for 14% of injuries.
53%
28%
19%
Non-fatal injuries from exposure to electricity, 2011-2012
Direct exposure toelectricity
Indirect exposure toelectricity
Exposure to electricityunspecified
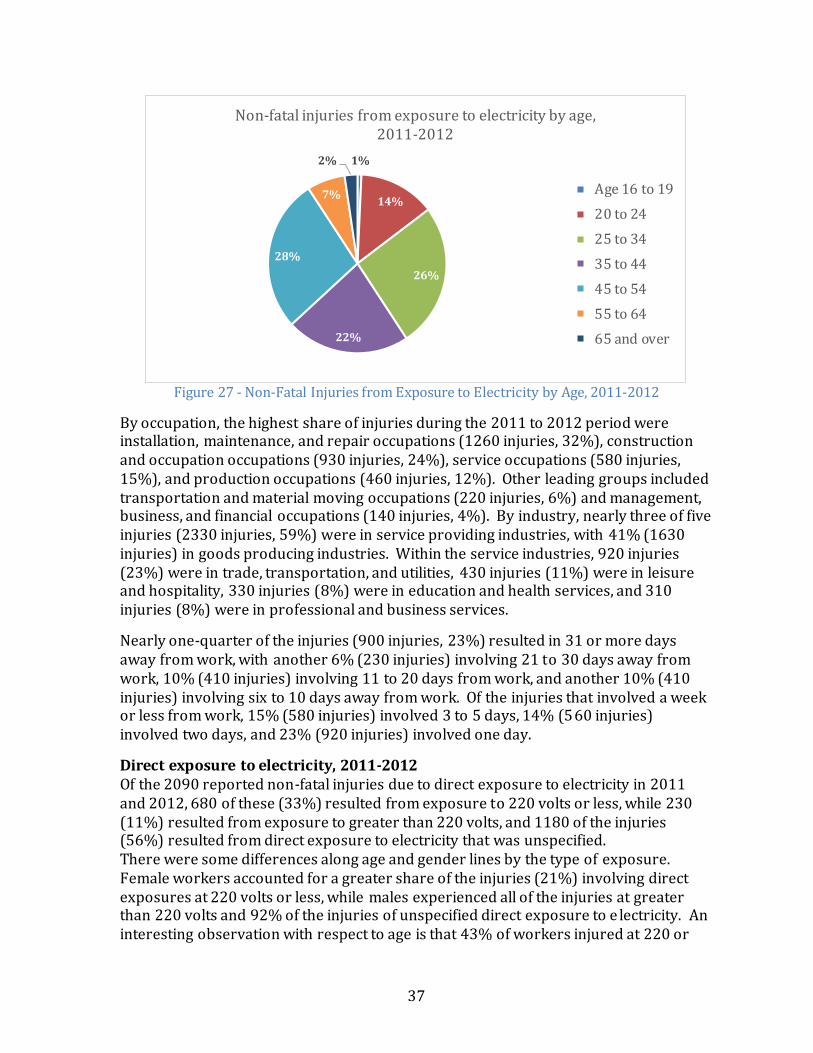
37
Figure 27 - Non-Fatal Injuries from Exposure to Electricity by Age, 2011-2012
By occupation, the highest share of injuries during the 2011 to 2012 period were installation, maintenance, and repair occupations (1260 injuries, 32%), construction and occupation occupations (930 injuries, 24%), service occupations (580 injuries, 15%), and production occupations (460 injuries, 12%). Other leading groups included transportation and material moving occupations (220 injuries, 6%) and management, business, and financial occupations (140 injuries, 4%). By industry, nearly three of five injuries (2330 injuries, 59%) were in service providing industries, with 41% (1630 injuries) in goods producing industries. Within the service industries, 920 injuries (23%) were in trade, transportation, and utilities, 430 injuries (11%) were in leisure and hospitality, 330 injuries (8%) were in education and health services, and 310 injuries (8%) were in professional and business services.
Nearly one-quarter of the injuries (900 injuries, 23%) resulted in 31 or more days away from work, with another 6% (230 injuries) involving 21 to 30 days away from work, 10% (410 injuries) involving 11 to 20 days from work, and another 10% (410 injuries) involving six to 10 days away from work. Of the injuries that involved a week or less from work, 15% (580 injuries) involved 3 to 5 days, 14% (560 injuries) involved two days, and 23% (920 injuries) involved one day.
Direct exposure to electricity, 2011-2012 Of the 2090 reported non-fatal injuries due to direct exposure to electricity in 2011 and 2012, 680 of these (33%) resulted from exposure to 220 volts or less, while 230 (11%) resulted from exposure to greater than 220 volts, and 1180 of the injuries (56%) resulted from direct exposure to electricity that was unspecified. There were some differences along age and gender lines by the type of exposure. Female workers accounted for a greater share of the injuries (21%) involving direct exposures at 220 volts or less, while males experienced all of the injuries at greater than 220 volts and 92% of the injuries of unspecified direct exposure to e lectricity. An interesting observation with respect to age is that 43% of workers injured at 220 or
1%
14%
26%
22%
28%
7%
2%
Non-fatal injuries from exposure to electricity by age, 2011-2012
Age 16 to 19
20 to 24
25 to 34
35 to 44
45 to 54
55 to 64
65 and over
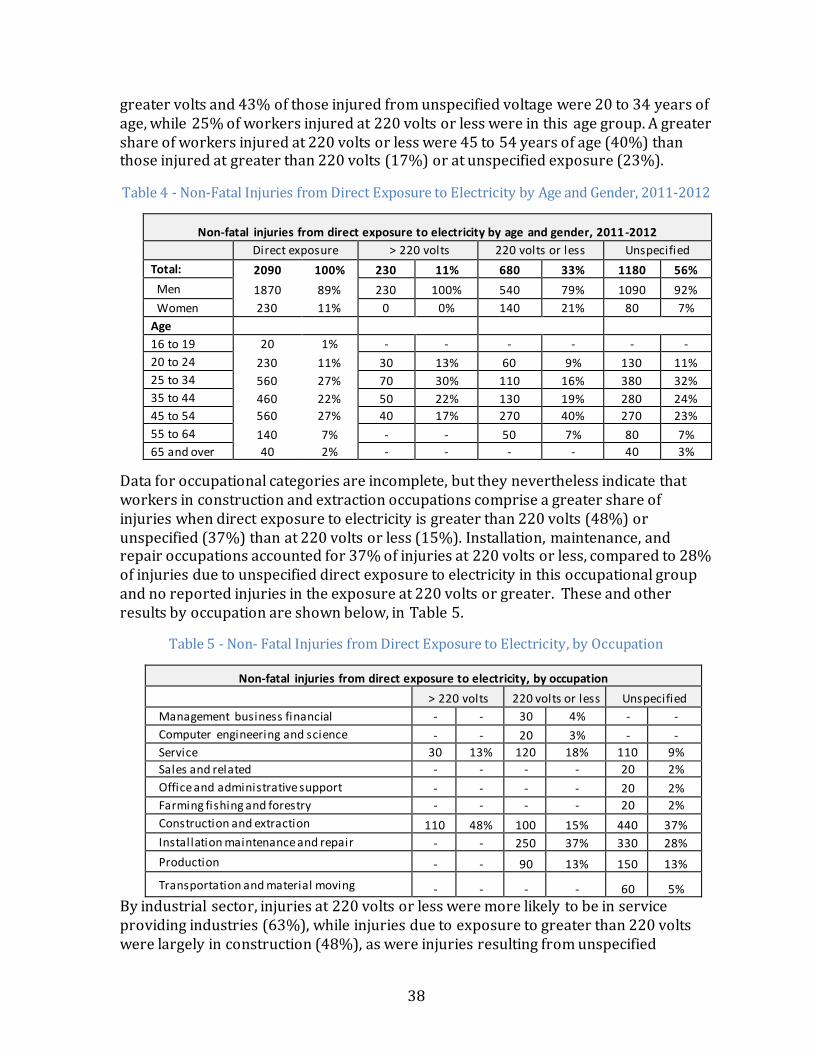
38
greater volts and 43% of those injured from unspecified voltage were 20 to 34 years of age, while 25% of workers injured at 220 volts or less were in this age group. A greater share of workers injured at 220 volts or less were 45 to 54 years of age (40%) than those injured at greater than 220 volts (17%) or at unspecified exposure (23%).
Table 4 - Non-Fatal Injuries from Direct Exposure to Electricity by Age and Gender, 2011-2012
Non-fatal injuries from direct exposure to electricity by age and gender, 2011-2012
Direct exposure > 220 volts 220 volts or less Unspecified
Total: 2090 100% 230 11% 680 33% 1180 56%
Men 1870 89% 230 100% 540 79% 1090 92%
Women 230 11% 0 0% 140 21% 80 7%
Age
16 to 19 20 1% - - - - - -
20 to 24 230 11% 30 13% 60 9% 130 11%
25 to 34 560 27% 70 30% 110 16% 380 32%
35 to 44 460 22% 50 22% 130 19% 280 24%
45 to 54 560 27% 40 17% 270 40% 270 23%
55 to 64 140 7% - - 50 7% 80 7%
65 and over 40 2% - - - - 40 3%
Data for occupational categories are incomplete, but they nevertheless indicate that workers in construction and extraction occupations comprise a greater share of injuries when direct exposure to electricity is greater than 220 volts (48%) or unspecified (37%) than at 220 volts or less (15%). Installation, maintenance, and repair occupations accounted for 37% of injuries at 220 volts or less, compared to 28% of injuries due to unspecified direct exposure to electricity in this occupational group and no reported injuries in the exposure at 220 volts or greater. These and other results by occupation are shown below, in Table 5.
Table 5 - Non- Fatal Injuries from Direct Exposure to Electricity, by Occupation
Non-fatal injuries from direct exposure to electricity, by occupation
> 220 volts 220 volts or less Unspecified
Management business financial - - 30 4% - -
Computer engineering and science - - 20 3% - -
Service 30 13% 120 18% 110 9%
Sales and related - - - - 20 2%
Office and administrative support - - - - 20 2%
Farming fishing and forestry - - - - 20 2%
Construction and extraction 110 48% 100 15% 440 37%
Installation maintenance and repair - - 250 37% 330 28%
Production - - 90 13% 150 13%
Transportation and material moving - - - - 60 5%
By industrial sector, injuries at 220 volts or less were more likely to be in service providing industries (63%), while injuries due to exposure to greater than 220 volts were largely in construction (48%), as were injuries resulting from unspecified
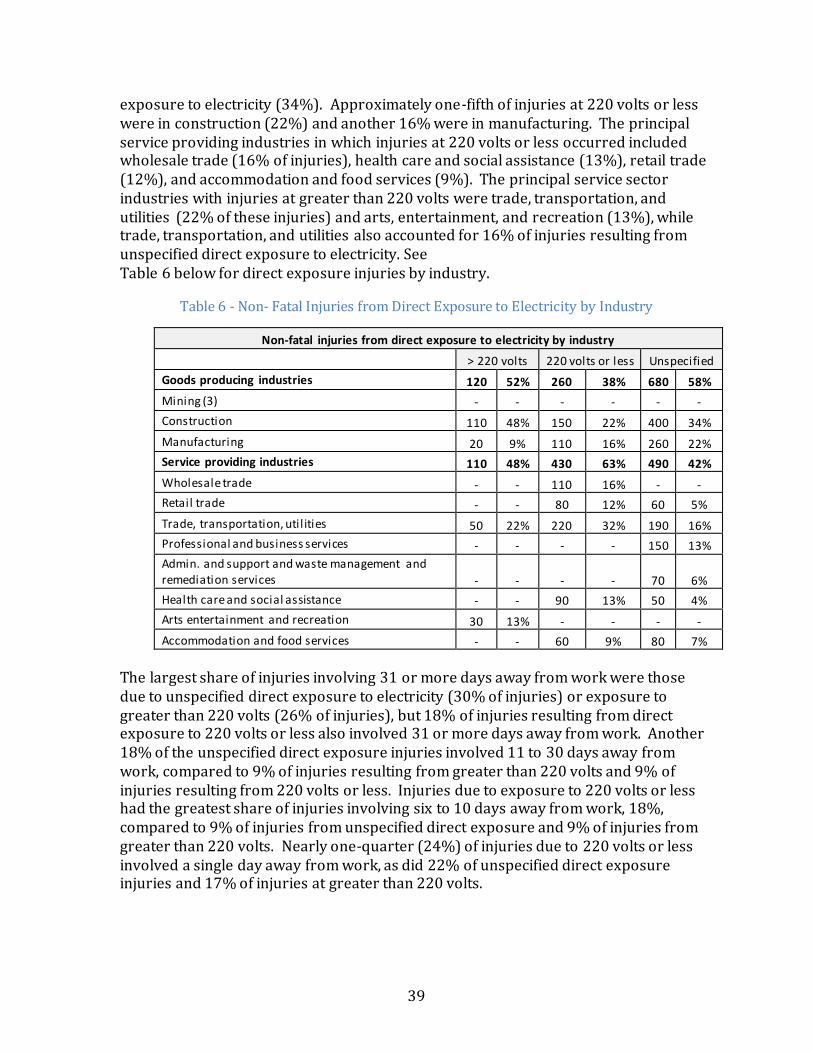
39
exposure to electricity (34%). Approximately one-fifth of injuries at 220 volts or less were in construction (22%) and another 16% were in manufacturing. The principal service providing industries in which injuries at 220 volts or less occurred included wholesale trade (16% of injuries), health care and social assistance (13%), retail trade (12%), and accommodation and food services (9%). The principal service sector industries with injuries at greater than 220 volts were trade, transportation, and utilities (22% of these injuries) and arts, entertainment, and recreation (13%), while trade, transportation, and utilities also accounted for 16% of injuries resulting from unspecified direct exposure to electricity. See
Table 6 below for direct exposure injuries by industry.
Table 6 - Non- Fatal Injuries from Direct Exposure to Electricity by Industry
Non-fatal injuries from direct exposure to electricity by industry
> 220 volts 220 volts or less Unspecified
Goods producing industries 120 52% 260 38% 680 58%
Mining (3) - - - - - -
Construction 110 48% 150 22% 400 34%
Manufacturing 20 9% 110 16% 260 22%
Service providing industries 110 48% 430 63% 490 42%
Wholesale trade - - 110 16% - -
Retail trade - - 80 12% 60 5%
Trade, transportation, util ities 50 22% 220 32% 190 16%
Professional and business services - - - - 150 13%
Admin. and support and waste management and remediation services - - - - 70 6%
Health care and social assistance - - 90 13% 50 4%
Arts entertainment and recreation 30 13% - - - -
Accommodation and food services - - 60 9% 80 7%
The largest share of injuries involving 31 or more days away from work were those due to unspecified direct exposure to electricity (30% of injuries) or exposure to greater than 220 volts (26% of injuries), but 18% of injuries resulting from direct exposure to 220 volts or less also involved 31 or more days away from work. Another 18% of the unspecified direct exposure injuries involved 11 to 30 days away from work, compared to 9% of injuries resulting from greater than 220 volts and 9% of injuries resulting from 220 volts or less. Injuries due to exposure to 220 volts or less had the greatest share of injuries involving six to 10 days away from work, 18%, compared to 9% of injuries from unspecified direct exposure and 9% of injuries from greater than 220 volts. Nearly one-quarter (24%) of injuries due to 220 volts or less involved a single day away from work, as did 22% of unspecified direct exposure injuries and 17% of injuries at greater than 220 volts.
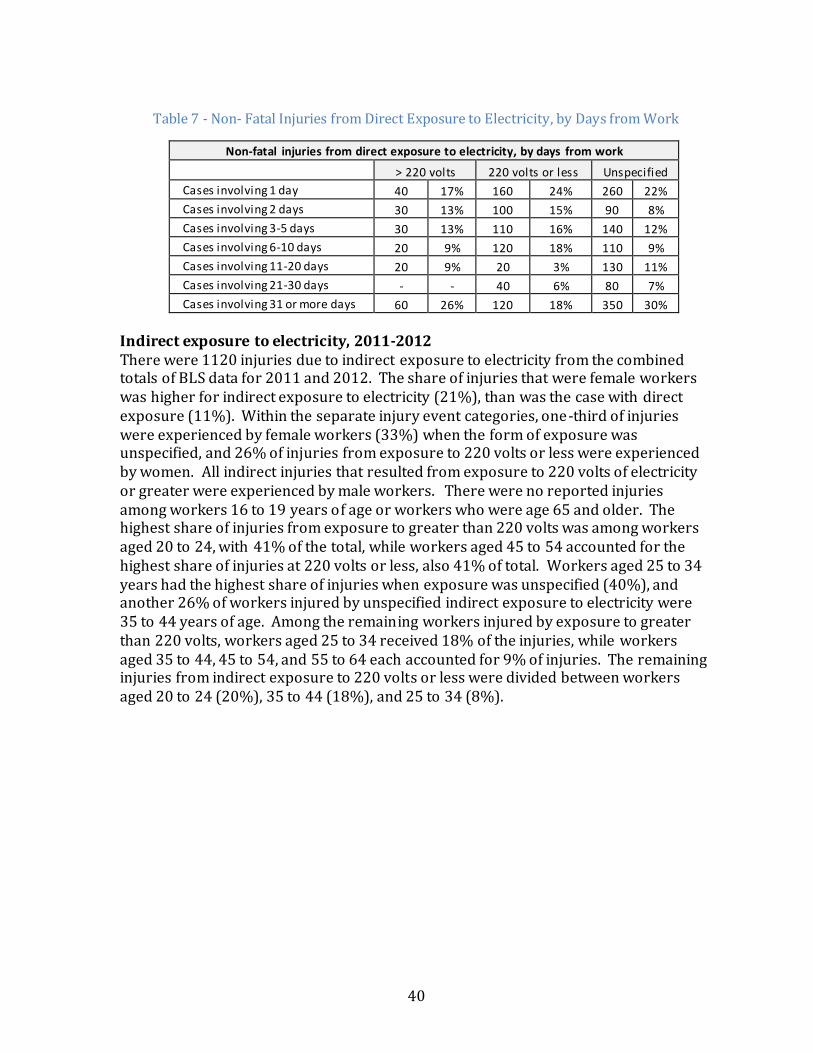
40
Table 7 - Non- Fatal Injuries from Direct Exposure to Electricity, by Days from Work
Non-fatal injuries from direct exposure to electricity, by days from work
> 220 volts 220 volts or less Unspecified
Cases involving 1 day 40 17% 160 24% 260 22%
Cases involving 2 days 30 13% 100 15% 90 8%
Cases involving 3-5 days 30 13% 110 16% 140 12%
Cases involving 6-10 days 20 9% 120 18% 110 9%
Cases involving 11-20 days 20 9% 20 3% 130 11%
Cases involving 21-30 days - - 40 6% 80 7%
Cases involving 31 or more days 60 26% 120 18% 350 30%
Indirect exposure to electricity, 2011-2012 There were 1120 injuries due to indirect exposure to electricity from the combined totals of BLS data for 2011 and 2012. The share of injuries that were female workers was higher for indirect exposure to electricity (21%), than was the case with direct exposure (11%). Within the separate injury event categories, one-third of injuries were experienced by female workers (33%) when the form of exposure was unspecified, and 26% of injuries from exposure to 220 volts or less were experienced by women. All indirect injuries that resulted from exposure to 220 volts of electricity or greater were experienced by male workers. There were no reported injuries among workers 16 to 19 years of age or workers who were age 65 and older. The highest share of injuries from exposure to greater than 220 volts was among workers aged 20 to 24, with 41% of the total, while workers aged 45 to 54 accounted for the highest share of injuries at 220 volts or less, also 41% of total. Workers aged 25 to 34 years had the highest share of injuries when exposure was unspecified (40%), and another 26% of workers injured by unspecified indirect exposure to electricity were 35 to 44 years of age. Among the remaining workers injured by exposure to greater than 220 volts, workers aged 25 to 34 received 18% of the injuries, while workers aged 35 to 44, 45 to 54, and 55 to 64 each accounted for 9% of injuries. The remaining injuries from indirect exposure to 220 volts or less were divided between workers aged 20 to 24 (20%), 35 to 44 (18%), and 25 to 34 (8%).
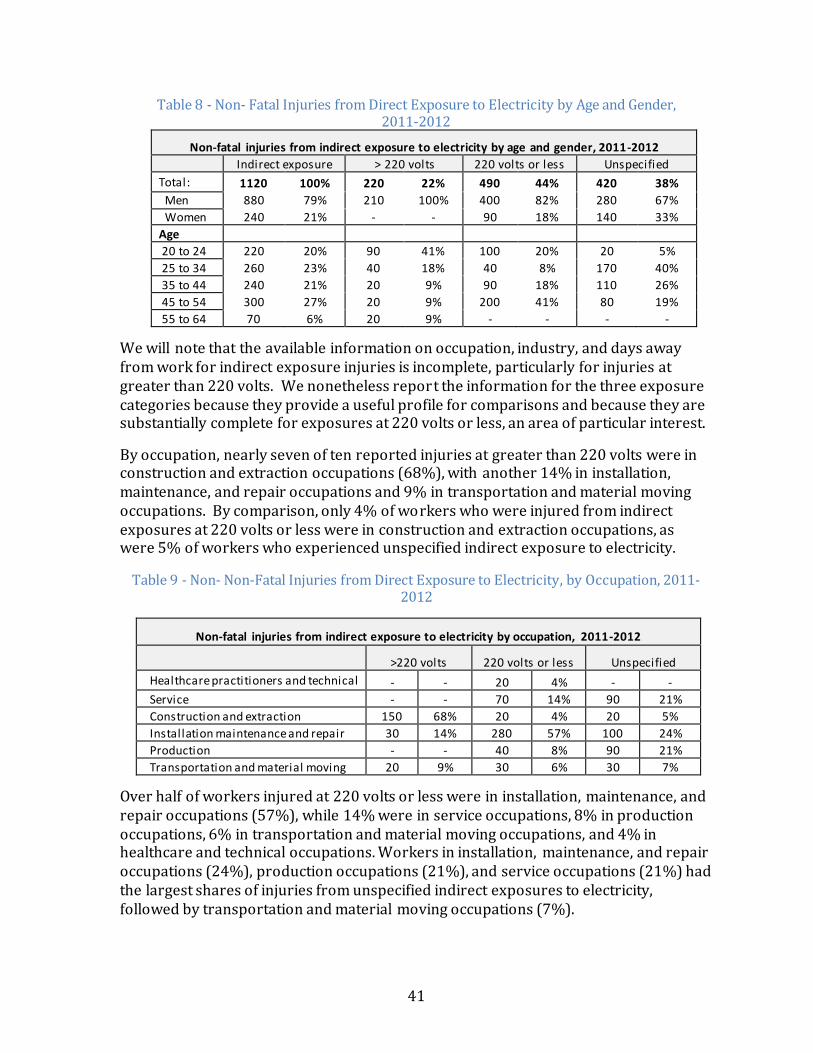
41
Table 8 - Non- Fatal Injuries from Direct Exposure to Electricity by Age and Gender, 2011-2012
Non-fatal injuries from indirect exposure to electricity by age and gender, 2011-2012
Indirect exposure > 220 volts 220 volts or less Unspecified
Total: 1120 100% 220 22% 490 44% 420 38%
Men 880 79% 210 100% 400 82% 280 67%
Women 240 21% - - 90 18% 140 33%
Age
20 to 24 220 20% 90 41% 100 20% 20 5%
25 to 34 260 23% 40 18% 40 8% 170 40%
35 to 44 240 21% 20 9% 90 18% 110 26%
45 to 54 300 27% 20 9% 200 41% 80 19%
55 to 64 70 6% 20 9% - - - -
We will note that the available information on occupation, industry, and days away from work for indirect exposure injuries is incomplete, particularly for injuries at greater than 220 volts. We nonetheless report the information for the three exposure categories because they provide a useful profile for comparisons and because they are substantially complete for exposures at 220 volts or less, an area of particular interest.
By occupation, nearly seven of ten reported injuries at greater than 220 volts were in construction and extraction occupations (68%), with another 14% in installation, maintenance, and repair occupations and 9% in transportation and material moving occupations. By comparison, only 4% of workers who were injured from indirect exposures at 220 volts or less were in construction and extraction occupations, as were 5% of workers who experienced unspecified indirect exposure to electricity.
Table 9 - Non- Non-Fatal Injuries from Direct Exposure to Electricity, by Occupation, 2011-2012
Non-fatal injuries from indirect exposure to electricity by occupation, 2011-2012
>220 volts 220 volts or less Unspecified
Healthcare practitioners and technical - - 20 4% - -
Service - - 70 14% 90 21%
Construction and extraction 150 68% 20 4% 20 5%
Installation maintenance and repair 30 14% 280 57% 100 24%
Production - - 40 8% 90 21%
Transportation and material moving 20 9% 30 6% 30 7%
Over half of workers injured at 220 volts or less were in installation, maintenance, and repair occupations (57%), while 14% were in service occupations, 8% in production occupations, 6% in transportation and material moving occupations, and 4% in healthcare and technical occupations. Workers in installation, maintenance, and repair occupations (24%), production occupations (21%), and service occupations (21%) had the largest shares of injuries from unspecified indirect exposures to electricity, followed by transportation and material moving occupations (7%).
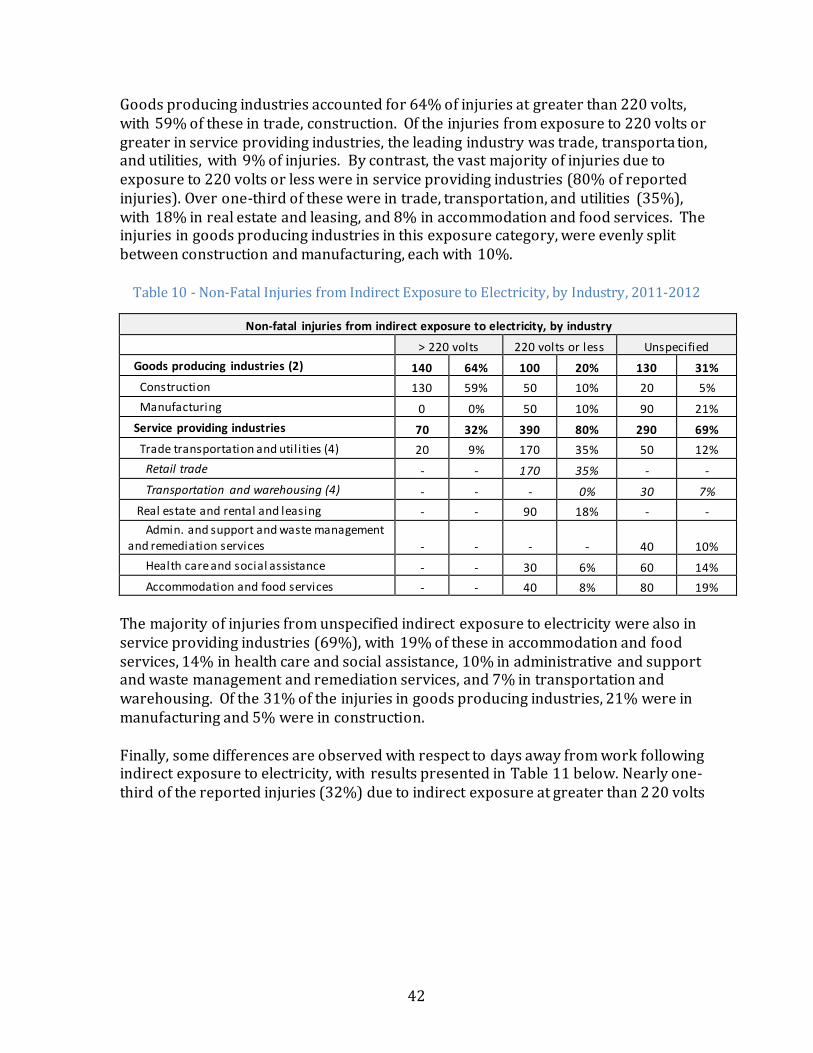
42
Goods producing industries accounted for 64% of injuries at greater than 220 volts, with 59% of these in trade, construction. Of the injuries from exposure to 220 volts or greater in service providing industries, the leading industry was trade, transporta tion, and utilities, with 9% of injuries. By contrast, the vast majority of injuries due to exposure to 220 volts or less were in service providing industries (80% of reported injuries). Over one-third of these were in trade, transportation, and utilities (35%), with 18% in real estate and leasing, and 8% in accommodation and food services. The injuries in goods producing industries in this exposure category, were evenly split between construction and manufacturing, each with 10%.
Table 10 - Non-Fatal Injuries from Indirect Exposure to Electricity, by Industry, 2011-2012
Non-fatal injuries from indirect exposure to electricity, by industry
> 220 volts 220 volts or less Unspecified
Goods producing industries (2) 140 64% 100 20% 130 31%
Construction 130 59% 50 10% 20 5%
Manufacturing 0 0% 50 10% 90 21%
Service providing industries 70 32% 390 80% 290 69%
Trade transportation and util ities (4) 20 9% 170 35% 50 12%
Retail trade - - 170 35% - -
Transportation and warehousing (4) - - - 0% 30 7%
Real estate and rental and leasing - - 90 18% - -
Admin. and support and waste management and remediation services - - - - 40 10%
Health care and social assistance - - 30 6% 60 14%
Accommodation and food services - - 40 8% 80 19%
The majority of injuries from unspecified indirect exposure to electricity were also in service providing industries (69%), with 19% of these in accommodation and food services, 14% in health care and social assistance, 10% in administrative and support and waste management and remediation services, and 7% in transportation and warehousing. Of the 31% of the injuries in goods producing industries, 21% were in manufacturing and 5% were in construction. Finally, some differences are observed with respect to days away from work following indirect exposure to electricity, with results presented in Table 11 below. Nearly one-third of the reported injuries (32%) due to indirect exposure at greater than 2 20 volts
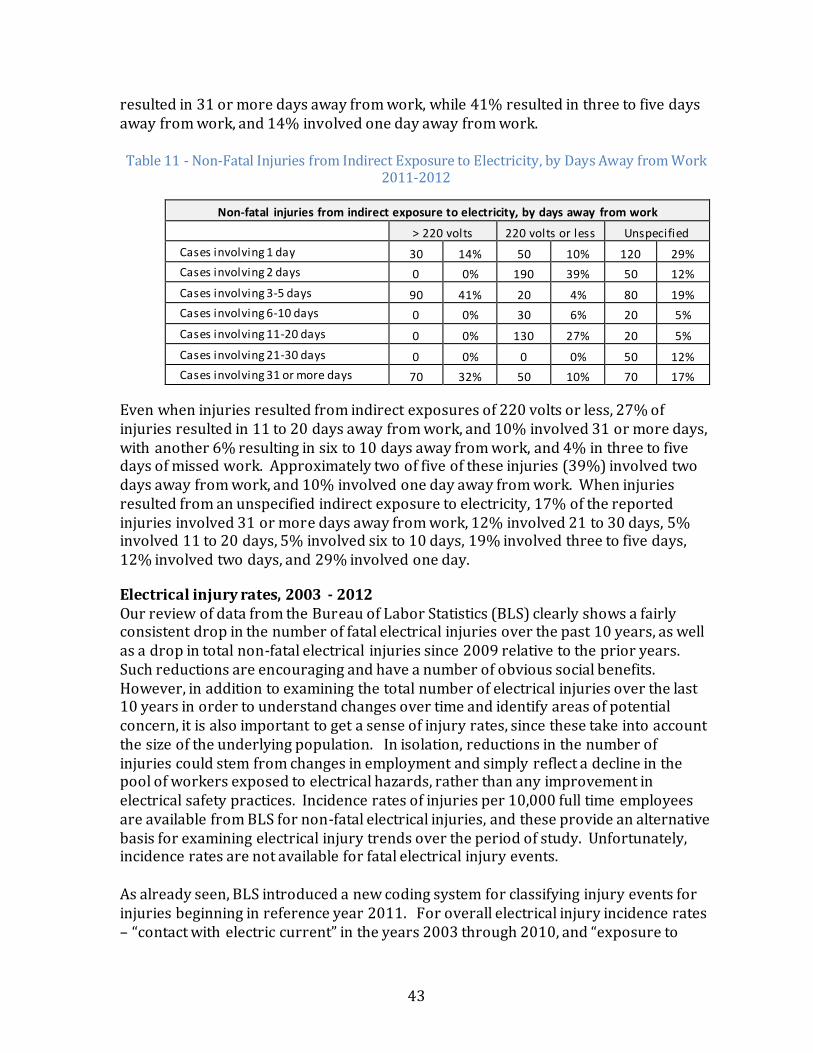
43
resulted in 31 or more days away from work, while 41% resulted in three to five days away from work, and 14% involved one day away from work. Table 11 - Non-Fatal Injuries from Indirect Exposure to Electricity, by Days Away from Work
2011-2012
Non-fatal injuries from indirect exposure to electricity, by days away from work
> 220 volts 220 volts or less Unspecified
Cases involving 1 day 30 14% 50 10% 120 29%
Cases involving 2 days 0 0% 190 39% 50 12%
Cases involving 3-5 days 90 41% 20 4% 80 19%
Cases involving 6-10 days 0 0% 30 6% 20 5%
Cases involving 11-20 days 0 0% 130 27% 20 5%
Cases involving 21-30 days 0 0% 0 0% 50 12%
Cases involving 31 or more days 70 32% 50 10% 70 17%
Even when injuries resulted from indirect exposures of 220 volts or less, 27% of injuries resulted in 11 to 20 days away from work, and 10% involved 31 or more days, with another 6% resulting in six to 10 days away from work, and 4% in three to five days of missed work. Approximately two of five of these injuries (39%) involved two days away from work, and 10% involved one day away from work. When injuries resulted from an unspecified indirect exposure to electricity, 17% of the reported injuries involved 31 or more days away from work, 12% involved 21 to 30 days, 5% involved 11 to 20 days, 5% involved six to 10 days, 19% involved three to five days, 12% involved two days, and 29% involved one day.
Electrical injury rates, 2003 - 2012 Our review of data from the Bureau of Labor Statistics (BLS) clearly shows a fairly consistent drop in the number of fatal electrical injuries over the past 10 years, as well as a drop in total non-fatal electrical injuries since 2009 relative to the prior years. Such reductions are encouraging and have a number of obvious social benefits. However, in addition to examining the total number of electrical injuries over the last 10 years in order to understand changes over time and identify areas of potential concern, it is also important to get a sense of injury rates, since these take into account the size of the underlying population. In isolation, reductions in the number of injuries could stem from changes in employment and simply reflect a decline in the pool of workers exposed to electrical hazards, rather than any improvement in electrical safety practices. Incidence rates of injuries per 10,000 full time employees are available from BLS for non-fatal electrical injuries, and these provide an alternative basis for examining electrical injury trends over the period of study. Unfortunately, incidence rates are not available for fatal electrical injury events. As already seen, BLS introduced a new coding system for classifying injury events for injuries beginning in reference year 2011. For overall electrical injury incidence rates – “contact with electric current” in the years 2003 through 2010, and “exposure to

44
electricity” in 2011 and 2012 – we will consider the separate codes to represent a common injury event. The distinct sub-codes for injury events between the respective coding periods do not allow such comparisons. Our review of electrical injury incidence rates will be limited here to rates at the industry level. Since 2011 also publishes incidence rates by age, gender, occupation, and other variables of potential interest, but since this information is not available for prior years, we will not include it in our analysis. BLS data indicate that overall incidence rates for non-fatal electrical injury across all industry did not change between 2003 through 2009, remaining at 0.3 injuries per 10,000 full-time workers for each of the seven years, so year to year changes in tota l injuries during this period are not reflected in rates of injury. However, the non -fatal injury incidence rate dropped to 0.2 in 2010 and 2012, so it will be important to see if this reflects a declining trend in the next few years. As indicated in Figure 28, although overall injury incidence rates were unchanged between 2003 and 2009, there were changes within specific industries and industry sectors, and these are worth noting. Not surprisingly, the construction industry and the utilities industry had the consistently highest electrical injury incidence rates over the course of the 10 years, with rates substantially higher than the all-industry rate every year. The utilities industry had the highest rate in nine of these years, with the construction having a slightly higher rate in 2011, and with real estate and rental and leasing sharing the highest rate in 2008. Real estate and rental and leasing had the highest injury rate (2.2) in 2009.
Figure 28 - Electrical Injury Incidence Rates, Construction & Utilities, 2003-2012
There were no clear trends in the injury rates in utilities and construction, with reductions in the rates in one year regularly followed by increases. In general, however, the rates in these industries were lower in recent years than they were at the beginning of the study period, particularly for utilities. The electrical injury rates in
0
0.5
1
1.5
2
2.5
3
2003 2005 2007 2009 2011
Inci
den
ce R
ate
Year
Electrical Injury Incidence Rates, Construction & Utilities, 2003-2012
All industry
Construction
Utilities

45
manufacturing over the last eight years have been lower than they were in 2003 and 2004 (0.4 in each year) and have been similar to the exceeded the all industry during this period. We have made prior mention of the somewhat surprising degree to which electrical injuries take place in service industries other than utilities, and the rates of electrical injury in real estate and rental and leasing are another indication that the service sector is an area for attention. In addition to real estate and rental and leasing -- which recorded injury rates well above the all-industry average in 2008, 2009, and 2011, after having none in the prior five years – the accommodation and food services industry and the information sector have recorded rates that exceeded the all-industry averages in individual years, but these higher rates are not sufficiently consistent to draw conclusions at this point. This is shown in Figure 29. While the injuries in the service sector include electricians and other tradespeople who are not in service occupations, it is also likely that greater numbers of workers with no electrical safety training are being exposed to electrical hazards as a result of the growth in service sector employment.
Figure 29 - Electrical Injury Incidence Rates, Real Estate & Food Services, 2003-2012
0
0.5
1
1.5
2
2.5
2003 2005 2007 2009 2011
Inci
den
ce R
ate
Year
Electrical Injury Incidence Rates, Real Estate & Food Services, 2003-2012
All industry
Real Estate & Rental andLeasing
Accommodation & FoodServices

46
Section III: Research into Causes of Electrical Injuries
Quantitative data on electrical injuries play an important role in identifying the scope of the electrical injury problem, trends in injury occurrence, major types of injury, and the working populations where prevention efforts are most needed. More detailed information on specific incidents is also valuable to improve our understanding of how and why electrical injuries occur. A number of research studies and injury surveillance reports provide some guidance in this area, and several of these are summarized below.
McCann M, Hunting KL, Murawski J, Chowdhury R, Welch L, 2003. “Causes of Electrical Deaths and Injuries among Construction Workers,” American Journal of Industrial Medicine, 43:398-406.
Research by Michael McCann from the Center to Protect Workers’ Rights and co-authors used BLS data and a hospital emergency department injury surveillance database to study the causes of electrical deaths and injuries among construction workers. The research found that one-third of construction workers who suffered fatal electrical injuries in the BLS CFOI database between 1992 and 1998 were electrical workers, and that the main cause of death in this group was direct contact with live electrical equipment, wiring, and light fixtures, most often involving electrical control panels, switching equipment, transformers, circuit breakers, and junction boxes. A large number of the non-electrical fatalities involved construction laborers, carpenters, and apprentices, with many of the deaths due to energized metal objects. In addition, the research found that at least one-third of electrical worker deaths and one-fifth of non-electrical worker deaths workers resulted from voltages under 600 volts, with substantial numbers of deaths involving voltages of 120/240 volts. It appears from an accompanying figure that presents the distribution of deaths by voltage that slightly less than 15% of the deaths among non-electrical workers were at 120/240 volts, while approximately 10% of the deaths among electrical workers were at this level.
In order to gain a better understanding of a broader array of electrical injuries, McCann and co-authors also examined electrical injuries among 61 construction workers who reported to an urban hospital emergency department. (The injuries are referred to as non-fatal injuries, but at least one appears to have been a fatal injury.) Two-thirds of these workers were electrical workers, and two-thirds of the injuries involved exposure to electric current, with one-third due to arc flash or arc blast. All of the injuries to non-electrical workers involved live wiring or power tools. Electrical exposure in one-quarter of the injuries led to falls from ladders. Telephone interviews were conducted with a select sample of the injured workers in order to learn more about injury causes and steps for prevention. Electrical workers, one of whom referred to an inappropriate work assignment by a foreman, primarily stressed the importance of shutting power down and properly testing circuits in order to avoid injuries. Non-electrical workers stressed the need for expert assistance in work around electrical wiring. An engineer injured in an event involving an electrical panel short circuit reported improper installation of wiring during building construction.
47
In discussing their findings, the researchers pointed out that working on or around energized equipment or wiring was a major cause of injury, and that in many instances, such as installing or repairing light fixtures, the injury events did not require working live. They suggested that possible reasons for the failure to de-energize might include such factors as scheduling pressures from supervisors, the preferences of building owners or managers not to keep power on during working hours, company desires to avoid overtime pay, or a “macho” attitude among electrical workers toward working live. They also indicated that the burns or eye injuries suffered by arc flash or blast events could have been prevented by de-energizing equipment or using specialized personal protective equipment. The research concluded that events involving power tools, portable lights, and extension cords and wires could be prevented through inspections, maintenance programs and the use of ground fault circuit interrupters. Both electrical and non-electrical workers were seen to require training on proper lockout/tagout procedures, while non-electrical workers were also seen to require training in electrical safety and de-energizing circuits in the work area.
National Institute of Occupational Safety and Health, 1998. Worker Deaths by Electrocution: A Summary of Surveillance Findings and Investigative Case Reports. DHHS Publication 98-131. Washington DC: US Government Printing Office.
In 1998, the National Institute of Occupational Safety and Health (NIOSH) released a report, Worker Deaths by Electrocution, which includes a review of investigations of workplace electrical fatalities that were carried out as part of the agency’s Fatality Assessment and Control Evaluation (FACE) program. From 1982, when the FACE program began, until 1994, when it was determined that the investigations of electrocutions were not generating any new information that could be used for prevention, NIOSH conducted in-depth investigations of 224 electrocution incidents, which collectively resulted in 244 worker fatalities. The 1998 research examined the entire portfolio of NIOSH electrocution investigations conducted through the FACE program and summarized key findings and recommendations.
Consistent with results already reported, the research found that the construction industry accounted for the greatest number of FACE electrocution fatalities (121 deaths), followed by manufacturing (40 deaths), transportation, communications, public utilities (30 deaths), public administration (19 deaths), agriculture, forestry, fishing (13 deaths), services (11 deaths), and wholesale and retail trade, each with five deaths. The leading occupations for victims were lineman (47 deaths), laborer (45 deaths), electrician (26 deaths), painter (19 deaths), truck driver (10 deaths), machine operator (10 deaths), construction worker (10 deaths), technician (9 deaths), farm worker (8 deaths), and maintenance worker (7 deaths). The mean age of victims was 34 years.
Alternating current (AC) accounted for 221 of the incidents, with just a single incident due to direct current and two due to AC arcs. One-third (33%) of the AC incidents were found to involve less than 600 volts (74 incidents), more than half of which involved household current of 120 to 240 volts (40 incidents). Higher voltage incidents
48
primarily involved distribution voltages of 7,200 to 13,800 volts (111 incidents), and 21 incidents involved transmission voltages of greater than 13,800 volts. The research found that in over one-third of the FACE investigations (79 incidents), no safety program or written safe work procedures existed to guide work activities. In addition, although 80 percent of victims had some type of safety training, 39 victims had no safety training of any kind. Supervisors were present at the work location in 120 of the incidents, and 42 of the victims were supervisors.
The research singled out five safety-related factors that were identified in the electrocution investigations as influencing the event outcome, at least one of which was present in each of the 224 incidents: 1) established safe work procedures were either not implemented or followed; 2) adequate or required personal protective equipment was not provided or worn; 3) lockout/tagout procedures were either not implemented or followed; 4) compliance with existing OSHA, NEC, or NESC regulations were not implemented; and, 5) worker and supervisor training in electrical safety was not adequate.
Based on the review of FACE incidents, the research concluded that even when companies had comprehensive workplace safety programs, implementation was often incomplete, underscoring the need for management and employees to better understand and recognize the hazards associated with working on or around electrical energy. The research further emphasized that developing and implementing comprehensive safety training was a management responsibility and that in some cases, this could require additional training or the evaluation and restructuring of existing training programs. It also stressed the importance of adequate training in electrical safety to all workers working with or around exposed electrical circuit components and of providing adequate personal protective equipment and ensuring it is worn by employees when required.
Kowalski-Trakofler K, Barrett E, 2007. “Reducing Non-Contact Electrical Arc Injuries: An Investigation of Behavioral and Organizational Issues,” Journal of Safety Research, 38(5):597-608.
This NIOSH study investigated behavioral and organizational aspects of arc flash incidents involving mining workers in order to draw lessons for safe electrical work practices across industry sectors. The research involved two phases, the f irst a review of 836 investigation reports by the Mine Safety and Health Administration (MSHA) of electrical arcing incidents that took place over an 11-year period, and the second consisting of in-depth personal interviews with 32 individuals who were victims of or witnesses to a non-contact electric arc event. The subjects in the first phase of the study were workers who experienced an arc flash incident between 1990 and 2001. Approximately 30% of the subjects were classified as laborers (laborers, equipment operators), 54% as technical (mechanics, engineers, electricians), and 14% as supervisors (foremen and other supervisors). The research team examined the investigation reports to identify whether the incidents were a mechanical or technical failure, whether the worker recognized the hazard, the work activity at the time of the incident, the amount of time into the shift when the incident occurred, the worker’s
49
total mining experience, and the worker’s experience on the job at the time of the incident. The analysis focused on 552 incidents that were determined to involve a behavioral or organizational component.
The researchers found that workers failed to recognize the hazard in 45% of the incidents and that workers recognized the hazard but nevertheless decided to engage in the specific behavior that led to injury in 55% of the cases. The authors indicated that this determination was based on an assumption that if, for instance, a qualified electrician was injured because equipment was not deenergized, working live was a choice made by the victim. The researchers also found that laborers who had been in their occupation less than two years were involved in a greater share of arc flash events than technical workers with comparable tenure on the jo b, but that technical workers experienced a larger share of incidents after 10 or more years of work. The more experienced technical workers, the majority of whom were qualified electricians, were therefore victims of a larger share of arc flash incidents than laborers.
Nearly three-quarters (74%) of injuries across all occupations occurred while victims were engaged in performing maintenance/repair/troubleshooting activities. Electricians were found to be performing “electrical repair/maintenance” tasks in 84% of their injury incidents, and mechanics were engaged in “electrical repair/maintenance” that was usually identified as troubleshooting in just over half (52%) of the arc flash incidents in which they were injured.
In the interview phase of the research, the majority of the participants (approximately 72%) were electricians, with 87% of these participants having more than six and a half years of experience in their positions at the time they were injured. Interview participants ranged in age from 25 to 55 years at the time of the incident, with an average of 37 years of age and 16 years of electrical experience. The vast majority of those interviewed (87.5%) were reported by the authors to be certified electricians. An even greater majority of those interviewed (94%) believed that the incident could have been prevented, and the prevention most often referenced was to “turn the power off.” Interview subjects also indicated that it was necessary for workers to avoid becoming complacent about electrical hazards, to be careful not to work in a hurry or take shortcuts, to follow accepted work procedures, and to use personal protective equipment.
Approximately 27% of subjects reported that their workplaces had a poor safety climate, while approximately 46% reported an average safety climate and another 27% a good safety climate. In workplaces with less positive safety climates, workers reported inconsistency in training and communication, and also indicated that production pressures and supervisor demands influenced their behaviors that contributed to the arc flash events. Even in workplaces seen to have more positive safety climates, the overall climate was not necessarily reflected in the expectations of front-line supervisors, who balanced safety with production goals. The authors concluded that deenergizing equipment provided the best protection against arc flash, but in situations where equipment could not be deenergized, training should encompass behavioral as well as technical factors in order to promote adherence to

50
safe work practices and ensure that work only be performed by appropriate qualified individuals.
Wellman, C, 2012. “OSHA Arc-Flash Injury Data Analysis,” IEEE Paper No. ESW2012 – 28.
This research examined summary reports of arc flash events resulting in injury that took place over a 23-year period (through June 2007) and were investigated by OSHA, utilizing the OSHA Integrated Management Information System (IMIS) to identify records and generate descriptions of the incidents. The research was particularly interested in information on voltage, work activity at the time of the event, the arc initiating device, as well as other descriptive information contained in the individual reports. The research focused on 532 arc flash incidents in which voltage was either reported or could be deduced, with 329 incidents determined to be low voltage incidents involving 700 or fewer volts. Of the low voltage incidents, 5 involved 120 to 277 volts, 68% involved 480 to 700 volts, and 26% involved unknown (but apparently low) voltage.
The injuries sustained in the low voltage incidents included 414 burns, 19 instances of smoke inhalation, and 13 shocks. There were 37 fatal injuries. (Note that a single incident can produce more than one type of injury.) The vast majority of injuries involved 480 volts: 68% of burns, 95% of the instances of smoke inhalation, 38% of shocks, and 86% of fatal injuries. The 18 events involving 120 to 277 volts produced 19 burns and three shock injuries. Of these, there were three burns at 277 volts, 11 burns and one shock at 240 volts, four burns and one shock at 208 volts, and one burn and one shock at 120 volts. The research found that the most common work task leading to arc flash injury was replacing fuses, with 40 of the low voltage incidents taking place while changing fuses without turning off power and verifying that fuses were deenergized, while the second most common work task (37 incidents) involved replacing circuit breakers in energized panelboards.
The paper also drew on narratives from select OSHA investigation records to offer additional insights into arc flash injury events at low voltages.
o A computer hardware technician required hospitalization for a shock and burns to her hands that she received when she was unplugging a power strip from a 120-volt receptacle outlet at the base of an office cubicle. The cubicle base was covered by metal trim, which came loose and fell onto the blades of the attachment plug as the employee was unplugging the power strip, producing the flash injuries. The OSHA report also noted that the employer was aware that the trim would sometimes come lose, but provided no electrical safety training.
The research underscored this incident as an indication that there is no lower limit in common power systems for voltage or current below which an injury from arc flash cannot occur since the available fault current in power strips is generally no more than a few hundred amperes. The research also pointed out that NFPA 70E-2009 215
51
called for wiring system components to be in place with no unprotected openings and for raceways to be maintained.
o In an excavation and shoring job, an employee was assigned the job of operating a 120/480 volt, 4800 watt electric generator that provided power to stud-welding tools. As he started his shift, he connected the supply conductors for a tool to the generator’s terminals while they were energized and the generator was running. There was an electrical fault at the terminals, producing an arc which burned the employee’s right hand. The employee also received a shock, and he was hospitalized with second-degree burns.
The research found that the type of generator producing the injury had an available fault current 11 times the full load current, and calculated a bolted fault current of approximately 220 amperes. At that voltage, the research indicated, arc flash current would be at a low level, less than half of available fault current.
o Contractors at a construction site were installing new underground chilled water lines. The lines, situated in an excavation, were to pass through a concrete wall, and a subcontractor was brought in to bore holes through the concrete. The excavation for the water lines was adjacent to the wall, and a concrete slab was in the trench. A transformer was located nearby. An employee for the subcontractor used a jackhammer to break off part of the concrete slab, and the jackhammer penetrated a 208 volt, three-phase underground cable that was embedded in the concrete, causing an electric fault. The subsequent electric arc burned a co-worker involved in the subcontracted work, and he was hospitalized with first-, second-, and possibly third-degree burns on both arms up to his armpits, on his left knee and thigh, and on his left waist. The OSHA inspector noted that the employer had not conducted a prejob survey.
The research made several observations based on the OSHA summary, noting that the proximity to the transformer suggested that available fault current was likely to be high and that the extensiveness of the burns suffered by the co -worker were an indication of high energy release. The failure to check for underground cables was also observed to be a violation of required practice.
o Three workers were on a job to replace a 480 volt, 800-ampere circuit, scheduled for a Sunday when all equipment was shut down. The OSHA summary noted that because no one had called the electric utility to have power shut off, the service drop from the utility pole was still energized, but the workers proceeded with the work even though they were aware that the circuit was energized. Two employees performing the work were standing on a wooden pallet to provide insulation from the ground, but neither was wearing rubber boots or eye protection. After they disconnected the load-side conductors, they pulled the circuit breaker
52
out of the panelboard while it was still attached to supply-side conductors, then began removing screws for the supply-side conductors, causing an electrical fault. All three workers were seriously burned, one fatally, by the resulting electric arc.
The research noted this incident involved multiple violations of NFPA 70E requirements. Beyond following electrical safety requirements, the research pointed out that incident energy in such situations could be substantially reduced through the use of current limiters. Overall, the research concluded that all injuries identified from OSHA records could have been prevented if equipment had been deenergized. It observed that workers in some incidents assumed that equipment was deenergized but failed to follow NFPA 70E requirements to verify deenergization, while in other, efforts were made to verify deenergization, but the test instruments were not rated for voltage. NIOSH Case Reports of Electrical Injury Incidents Although the National Institute for Occupational Safety and Health stopped targeting electrocutions for investigation through its Fatality Assessment and Control Evaluation (FACE) program in 1994, as indicated earlier, several states with their own FACE initiatives have continued to investigate fatal workplace electrical events, not all of which involve electrocution. These investigations are conducted by state FACE investigators who make visits to workplace fatal injury sites and typically conduct interviews with key personnel, examine machinery and survey other relevant aspects of the worksite, and review available records, including company records, police reports, medical examiner reports, and other materials. FACE investigators do not have regulatory authority, and company participation in investigations is voluntary. However, FACE reports frequently provide rich descriptive information about how incidents occurred, identify key contributing factors, and make recommendations for prevention. Four electrical events which took place between 2003 and 2006 are summarized from state FACE reports below. The full original reports are available on the NIOSH FACE website: http://www.cdc.gov/niosh/face/stateface.html.
California Department of Health Services, 2006. A Hotel Maintenance Worker Died from Injuries Received From an Arc Flash. Fatality Assessment and Control Evaluation (FACE) Report: 06CA008.
In September 2006, a 39-year-old Hispanic hotel maintenance worker died as a result of burn and inhalation injuries caused by an arc flash that occurred when he tried to change a fuse in an electrical panel. The employer was a large national hotel chain that had been in business for over 30 years. The hotel where the victim worked had approximately 70 employees, and he had been on the job for less than half a year. The victim’s maintenance responsibilities included janitorial duties, minor repairs, and preventive maintenance. He had prior job experience as a welder and computer programmer. The hotel manager reported to the FACE investigator that the victim’s

53
prior work experience qualified him for the duties he was assigned at the hotel, but the job description did not include changing fuses at an electrical panel. The incident occurred on a Sunday, when the hotel was not fully staffed. After power to the lights in the garage went out, the hotel’s assistant manager asked the victim to investigate the problem. The victim then went to the enclosed electrical room at the top floor of the garage where the electrical panel was situated and opened a cover on an electrical switch to expose a burned out fuse. The victim called the maintenance supervisor at home, who told the victim not to touch the fuse. The victim nevertheless removed the burned out fuse (a 30 amp barrel-type fuse) from the panel and began to replace it with a blade-type fuse of different amperage, sparking an electrical flash, which burned his arms and face. The victim was able to exit the room and call for help, and he was conscious when paramedics arrived, who transported him to a local hospital for examination and treatment. He was transferred to a burn unit, where he complained of shortness of breath and was intubated. A bronchoscopy was performed and confirmed an inhalation injury when the victim’s respiratory status remained unstable. The victim’s condition continued to worsen and he succumbed to his injuries five days after the incident. The death certificate listed a cause of death as sequelae of electrical burns. The FACE investigation recommended that employers ensure that workers only perform tasks that are part of their well-defined duties in order to prevent such incidents. This recommendation emphasized that well-defined duty lists can promote the safety of workers by identifying the hazards workers might encounter and implement hazard mitigation programs. The report noted that the victim was guided by mixed signals in attempting to change the fuse. He was performing a task that was not part of his job description and had been instructed by the maintenance supervisor not to perform the task, but had also received implicit permission from the assistant hotel manager to enter the electrical panel room when given keys to access the room and told to check out the problem, which was potentially interpreted as a duty to try and change the fuse. The investigation report also noted that standardized programs and procedures for assigning tasks can assist managers in making job assignments.
New Jersey Department of Health and Senior Services. Hispanic Factory Workers Dies of Burns After Improperly Testing a 480-Volt Electrical Bus Bar. Fatality Assessment and Control Evaluation (FACE) Report 04NJ059.
In 2004, a 19-year-old factory worker suffered fatal burns and a co-worker suffered non-fatal burn injuries after an electrical test meter exploded as the victim tried to test a 480 volt overhead electrical bus bar. The incident took place at a plant that used thermoforming machines to make plastic inserts for cosmetic packaging. Because the machines created substantial residual heat, management decided to have fans installed in order to exhaust heat from the room. The two workers were on a scissor lift to do non-live installation of wiring for the fans, which was to later be inspected, connected, and energized by a licensed electrician. While running conduit along the ceiling, they
54
neared a partially exposed, 480 volt, three-phase electrical bus bar that provided power to the thermoforming machines. The victim used a voltmeter to test the exposed electrical conductors at the uncovered end of the bus bar and apparently connected the voltmeter across two of the phases, overloading the meter and causing the explosion. The explosion ignited the victim’s clothing and tripped an electrical breaker, extinguishing the lights. The co-worker was able to lower the lift, but his own clothing was ignited as he attempted to extinguish the flames on the victim’s clothes. Another worker used a fire extinguisher to douse the flames. Both workers were transported to the hospital, and the victim was transferred to a burn unit, where he died 14 days after the incident from complications of his injuries. Approximately 170 permanent employees worked at the plant where the incident occurred. The plant also used 200 to 300 temporary employees, generally during a busy season lasting up to four months. The wiring project for the fan installation entailed installing metal conduit from four breaker boxes that were mounted on the wall beneath the fans, with the conduit running up the wall to the fans and then extending up to ceiling joists, where it would terminate near the bus bar that supplied power to the plant’s thermoforming machines. The bus bar was attached to the bottom of roof joists that were approximately 20 feet above the floor and five feet below the ceiling. Electrical junction boxes mounted on the side of the bus transferred power to the machines. The task of installing the wiring was assigned to a 21-year-old mechanic, with the victim assigned to assist him. The mechanic’s normal responsibilities involved performing maintenance and minor repairs on the plant’s thermoforming machines, while the victim was a laborer being trained as a mechanic’s assistant. Both workers were of Hispanic descent and had worked at the plant for approximately a year and a half at the time of the incident. They began the wiring work on a Wednesday morning and were expected to work on the project for two to three days. They used the scissor lift to raise them along the wall to the ceiling joists. They had been instructed not to make any of the electrical connections. Their work progressed uneventfully through the morning and early afternoon. At approximately 3:00 p.m., the workers were on the lift installing conduit near the end of the electrical bus bar, which was missing an end -cap, exposing four electrical conducting plates. The victim picked up a voltmeter kept in the lift for electrical contractors while the mechanic had his back to him, then connected the two testing probes across the copper plates, despite not being trained to test circuits. The mechanic was reported to shout, “No!,” but the connection caused an electrical arc and overloaded the voltmeter, which then exploded. The arc caused the power and lights to go out and set off the fire alarm, while burning a deep V shape into four metal bus bars. The victim’s clothing was set on fire by sparks from the arc and/or the exploding voltmeter, and the mechanic’s clothing was set on fire as he tried to assist the victim. The mechanic lowered the lift to ground level as a co-workers used a fire extinguisher to douse the flames. The plant was evacuated and police responded to a 911 call, finding the work area filled with smoke and the two workers unconscious on the scissors lift platform. The fire department and medics
55
removed the victims after the area was declared safe and transported them to the emergency department of a local hospital. The mechanic, who had body burns to his hands and chest, was treated and released. The victim was transferred to the burn unit with burns over 35% of his body and smoke inhalation injuries, where he died two weeks after the incident. A crisis counselor was brought in to assist employees dealing with the psychological impact of the incident. It was determined following investigations by OSHA and company management found that electrical contractor who had installed the electrical bus bar had apparently failed to place an end-cap on the bus enclosure, leaving the electrical conductors exposed. The New Jersey FACE investigation report made several recommendations to prevent similar incidents:
o That employers permit only properly trained and qualified persons to carry out electrical work. The investigation noted that the two workers had little or no training in electrical hazards and were not qualified to do electrical work, but were injured while working near an exposed bus bar. The investigation pointed out that the victim’s inexperience and lack of training were apparent in his failure to recognize the exposed bus bar as a hazard, and it suggested that close supervision might be required to keep unauthorized employees a safe distance from electrical hazards.
o That the company develop, implement, and enforce an electrical safety program. Although the company relied on licensed electrical contractors for electrical work, the investigation noted that personnel could come in close proximity to electrical hazards. The New Jersey FACE program recommended that electrical safety program include training in electrical safety practices, lockout/tagout procedures, circuit testing to verify deenergization, and other training commensurate with employee duties.
o That a qualified person inspect work areas prior to permitting employees to work near electrical or other hazardous equipment . The investigation noted that plant management was apparently not aware that the end-cap of the electrical bus bar had been left off during the installation of the electrical system. The New Jersey FACE program recommended that work areas be inspected by qualified persons as part of a formalized job-hazard analysis to identify hazards that may be encountered by workers.
The investigation report also noted that the identification and load limit plate for the scissor lift were missing and that the instruction manual was not with the lift and included a fourth recommendation ensuring the proper maintenance and inspection of personnel lifts.
Kentucky Injury Prevention and Research Center. Licensed Electrician Dies When Electrocuted by 480 volts. Fatality Assessment and Control Evaluation (FACE) Report 03KY115.
56
A 36-year old lead electrician was electrocuted on July 4, 2003 while working as part of a five-person crew that was connecting service for two air conditioning units at an automotive supply manufacturing facility. All the workers were licensed electricians who worked for an electrical contracting company that had been in business for more than a decade. The electrical contractor had a safety program that included safety awards, monthly safety meetings, weekly toolbox talks, and periodic training sessions. The electrical work was being performed while the facility was closed for the July 4th holiday. Other than a facilities office worker in the main office, the electrical crew members were the only workers at the site and had complete control over the facility utilities. Wiring for a newly constructed addition to the facility had already been installed and the crew was running wires to connect service for the two air conditioning units (three-phase; 480 volts; 30 amp and 35 amp), as well as service for a lighting panel (three-phase; 277/480 volts; 200 amp). A breaker for each of the services was located on the wall near the ground, approximately 130 feet away. The junction of wiring for the new addition and the main building were housed in a junction box, which rested on two metal tracks suspended from the ceiling approximately 20 feet above the floor. On the day of the incident, the electrical crew began work at 7:00 a.m. The owner of the electrical company arrived to check on the work at approximately 9 a.m., about an hour before the crew planned to leave to celebrate the holiday. The conditions were hot and humid outside, and the area where the men were working was not air-conditioned. The job foreman and another worker were gathering tools and awaiting instructions from the lead electrician and another worker, who were in the junction box (4’ x 4’ x 12”), assisted by the fifth employee in a scissor lift. The lead electrician and co-worker were pulling three sets of wiring service from the breaker box in the main plant and connecting it to the new electrical service in the addition. Each set of wiring had its own breaker on a breaker panel, which the foreman had locked out. Normal procedure called for the lead electrician and co-worker to also lock and tag out the breakers and then remove the equipment after the work was finished and power could be turned back on, but they had not done so in order to save time. The lead electrician and co-worker pulled wires and completed connections from the main building breaker to the new addition, then began to pull the wires for the two air conditioning units. After pulling the remaining wires and preparing to connect them to the new wiring in the addition, the lead electrician guided the wires under his legs and tapped the ends with his right hand to make them even. He was sweating and not wearing a shirt due to the hot conditions, and he also was not wearing gloves as he handled the wires. After the lead electrician completed the connections for the lighting service, he called to the foreman to throw the breaker on. Believing he had been instructed to turn all three breakers on, the foreman went to the breaker panel, removed his lockout/tagout equipment from all three breakers, and threw them into the on position, sending electricity through the wires and into the lead electrician ’s hand. The worker on the lift and co-worker called for the foreman to contact emergency services, then placed the lead electrician in the scissor lift and performed
57
CPR until paramedics arrived. The victim was transported to a local hospital but was declared dead at 10:25 a.m. Following the incident, the company met with employees to discuss how to prevent a recurrence in the future. The focus of the discussion underscored the importance of always following the lockout/tagout procedure and more precise communication, but it was also decided that breakers would not be turned on if anyone was in the junction box. The Kentucky FACE investigation made two recommendations to prevent similar incidents:
o Employees should always follow company lockout/tagout procedures. All members of the work crew had lockout/tagout equipment, but only the foreman used his in the interests of saving time. Had all members of the crew locked and tagged out the breaker, the victim and his co-worker in the junction box would have had to lower themselves to the ground, walk to the breakers, and removed their lockout/tagout equipment with the foreman so that the correct circuit could be reenergized.
o Communication between employees should be clear and precise. The investigation pointed out that the instruction to “throw the breakers” was ambiguous, and that the workers involved in the incident had worked together for several years, but still miscommunicated. It recommended clear and precise communication when requesting actions by others.
58
Section IV: Review of Select OSHA Investigations of Workplace Electrical Incidents
A final component of this study identified in the Fire Protection Research Foundation project description is to provide in-depth analysis of selected electrical incidents that are available and obtainable. Information about workplace electrical events resulting in injury is available through the federal Occupational Safety and Health Administration (OSHA), which conducts investigations of incidents that cause fatalities or result in three or more hospitalized injuries. Summaries of these investigations are available on-line through the Integrated Management Information System (IMIS), a searchable database that compiles information from federal or state offices in the geographical area where the incident occurred. In addition to investigations undertaken by the federal OSHA, IMIS also includes incident summaries from the 25 states that operate their own federally approved OSHA plans. Because state plans may set more stringent criteria for investigations than federal OSHA (such as any serious injury), information may be available for incidents in which there were fewer than three injuries. Investigation summaries typically include a description of the incidents, identification of causal factors, and such additional information as when and where the incidents occurred, numbers of workers involved, and types of injuries. Information may also be available on any workplace safety violations identified in the course of investigation, although the availability and finality of this information is time sensitive, since information is entered as events occur and is subject to change. Summaries vary considerably in the level of detail they provide. The IMIS database can be searched by pre-defined keywords, user-defined keywords for text appearing in summary descriptions or abstracts, event dates, and industry. We utilized IMIS to search for electric shock and arc flash events to examine in more detail the circumstances around electrical injury, including whether safety requirements spelled out by NFPA 70E were being followed and whether workers involved in the events were wearing the proper personal protective equipment. To do this, we first used a variety of search terms to identify incidents of possible interest, as well as determine how useful the OSHA IMIS database could be in identifying whether workers were wearing personal protective equipment when the injury events took place or other factors of interest. We restricted the searches to the last 10 years for which records were available, which at the time of the searches was August 20, 2003 through August 20, 2013. Using pre-defined keywords, IMIS produced 1,228 records using the keyword “electrocuted,” 953 records using “electric shock,” 282 records using “electric arc,” and 110 records using “electric cabinet.” It should be noted that the records prod uced by these searches are not mutually exclusive, and they also cannot be used to estimate the number of events or injuries in the respective categories that occurred during the time period in question. The searches were used in this research solely as a tool for

59
identifying records for which additional detail would be sought, in the form of fuller OSHA investigation records through Freedom of Information Act (FOIA) requests. Subsequent searches used these keywords along with the search terms “ppe,” “g loves,” and “personal protective equipment” in the abstract field, and were then used to identify records that might be of particular interest to our study purposes. In general, these searches revealed that only a minority of the investigation summaries men tioned use of personal protective equipment, as indicated below, and summaries more often mentioned the use of gloves than personal protective equipment.
Results from OSHA Accident Investigation Searches (For incident dates 8/20/2003 – 8/20/2013)
“Electrocuted” keyword: 1,228 records --10 records for “electrocuted” and “PPE” --61 records for “electrocuted” and “gloves” --1 record for “electrocuted” and “personal protective equipment” “Electric shock” keyword: 953 records --9 records for “electric shock” plus “PPE” --60 records for “electric shock” plus “gloves” --3 records for “electric shock” plus “personal protective equipment” “Electric arc” keyword: 282 records --7 records for “electric arc” plus “PPE” --32 records for “electric arc” plus “gloves” --4 records for “electric arc” plus “personal protective equipment” “Electric cabinet” keyword: 110 records --4 records for “electric cabinet” plus “PPE” --14 records for “electric cabinet” plus “gloves” --1 record for “electric cabinet” plus “personal protective equipment”
We next used the IMIS website to obtain investigation summaries for the events produced by all four keywords which included mention of personal protective equipment and gloves, then reviewed the summaries to identify incidents for wh ich fuller OSHA investigation records would be sought through Freedom of Information Act requests. We were selective in identifying incidents for review due to the limited resources available for review, ultimately making FOIA requests for seven incidents . These included:
An electric shock and burn incident due to an electric fault in a cabinet. The OSHA summary indicated that the work involved infrared inspection and that the victim was using unspecified personal protective equipment. Because the Hazard/Risk Category Classifications Table from NFPA 70E-2012 would require a long sleeve cotton or similar non-melting shirt and pants if there were
60
exposures of 240 volts or less, and 4cal/cm2 minimum arc rated clothing for exposures of 241 to 600 volts, additional information was sought on the type of personal protective equipment in use.
An arc flash event that resulted in hospitalized injuries to three electrical workers. The OSHA summary reported that the arc occurred when a Fluke meter rated for a maximum of 1,000 volts was applied to a live circuit at 4,160 volts and that personal protective equipment worn included safety glasses, a 100% polyester high visibility safety vest, denim blue jeans, hard hat with chin strap, steel-toed work boots, and long sleeve arc resistant (ATPV 7.7 cal/cm2
rated) shirt. Among the questions raised by the summary were why a voltmeter rated for up to 1,000 volts was used to measure 4,160 volts, how many of the injured employees were wearing 7.7 cal/cm2 shirts and why were similar rated pants were not worn, whether the shirts protected the upper body or were also on fire, and whether the incident energy exposure may have been more than 7.7 cal/cm2.
A utility company employee was burned by an electrical fault while installing meters at an industrial complex. According to the OSHA report, the employee was wearing full personal protective equipment, including rubber insulated gloves, leather gloves, a long sleeve shirt, face shield, and utility glasses, but suffered burns to the right side of his face and ear. As described in the summary, no violations were found, but NFPA 70E would appear to require 8 cal/cm2 minimum arc rated clothing and an arc rated balaclava for the work performed. Additional information from the investigation was sought to clarify the level of protection provided by personal protective equipment and details of the event.
An electrical contracting employee received first- and second-degree burns to multiple parts of his body as he was installing circuit breakers in a distribution panel and an arc flash occurred. According to the OSHA summary, the employee was wearing unspecified personal protective equipment at the time of the incident. Because the work involved exposure to 480 volts, NFPA 70E would generally require use of 8 cal/cm2 minimum arc rated shirt and pants, as well as a balaclava, and the OSHA investigation was sought in order to see if it provided any information in this area.
In addition, information was sought from OSHA investigations to see if it shed light on three incidents that involved electrocutions at 120 volts. NFPA 70E does not designate a restricted approach boundary for exposure to 120 volts, so neither rubber gloves nor insulated tools are required for work at this voltage. Although the most recent edition of NFPA 70E (2015) lowered the restricted approach boundary from 301 volts to 151 volts, there remains no boundary (only “avoid contact” recommendations) at 120 volts, making information from these incidents particularly important. We did not receive investigation materials from OSHA for one of the FOIA requests at the time this report was finalized.
61
Review of the Cases We filed Freedom of Information Act requests with six OSHA regional offices for the seven investigations of interest. Several of these requests were forwarded by OSHA to state OSHA offices when the injury events that took place in state OSHA plans had jurisdiction. We reviewed the records in order to answer questions prompted by the investigation summaries and to gain a better understanding of a diverse set of electrical injury events. Results from this review are summarized below. Incident 1: Electric Shock and Burn – Electrical Fault in Cabinet
This event took place in California 2011 when an infrared servicing technician was preparing to inspect an electrical panel in the main electrical room at an unspecified industrial facility in order to identify any defective or marginal equipment. The victim removed the electrical panel’s cover to begin the inspection when he saw an exposed bus bar at the bottom of the panel within two feet of him. The victim apparently did not anticipate the exposed bus bar and reported that he began to put the cover back on upon seeing the hazard. As he moved the cover, it made contact with the main bus feed, causing an arc flash. The victim was transferred to a local hospital where he received treatment for a first-degree burn on his neck and was kept under observation for three hours. The state OSHA records also report that the victim received an electric shock. Implications for NFPA 70E The victim reported that he was wearing an 11 cal jump suit and “all safety gear,” including gloves and shield glasses at the time of the incident. The victim did not specifically report wearing a balaclava, and the description of the event appears to qualify as an NFPA 70E Hazard/Risk (PPE) category 2 task, which did not require balaclava protection until the 2012 edition. However, it seems likely that use of a balaclava in this situation would have prevented the minor neck burn and provides support for the addition of the balaclava requirement to NFPA 70E in 2012. Incident 2: Burn – Electrical Fault in Meter
This event took place in California in 2011 at an industrial building, where an electrical contracting employee was installing new meters to replace legacy meters on an electrical panel. He had installed the first meter on a bank of meter switchgear in a three-phase 480-volt system, with two remaining meters to install. He used a MBLink mobile handheld instrument to scan the first meter and confirm that it was operable, then began work on the meter directly below, unlocking the barrel lock ring and removing the screws of the lower panel cover. He saw a white light as he pulled the cover, turning his head and receiving burns to his right ear and cheek. He ran to safe ground but the panel caught fire and continued to explode following the initial flash. He then retrieved his fire extinguisher and used it to extinguish the fire until the local fire department and paramedics arrived to provide assistance.
62
The employee was transported to the emergency room and treated for burns on the left side of the face and to the top of his ear at a burn and wound clinic. He was released later that day and returned for a follow up examination three days later, where he was taken off work until his next scheduled examination two weeks hence. He was initially scheduled to return to work approximately five weeks after the incident, but his return to work at the time was later pushed back to a year after the incident date. The OSHA report noted that the employee was a journeyman electrician with 10 years of experience as an electrician, but with approximately two months of experience in his current position replacing meters. He was reported to have installed 35 to 40 meters per day in this position, and had completed 38 installations on the day of the incident, with two meters remaining before completing work for the day. The employee reported that it took an average of 15 minutes to replace and install a meter. The company was reported to pay an incentive goal for installing the meters. Employees worked from 6:30 a.m. until they finished the assigned number of installations. The employee was working alone at the time of the incident. The employer believed that the employee installed the meter with busses energized and not bypassed for the meter change out. The employee reported to Cal/OSHA that he “killed power” as he proceeded to the second meter, put the meter in and restored the electric power, but had not put the locking ring on when the meter exploded. He reported to Cal/OSHA that he was aware of meters blowing up in the past, but didn’t know if the incidents resulted in injuries. Implications for NFPA 70E The state OSHA investigation was unable to determine the precise cause of the electrical fault, but surmised that it may have been due to either a defective meter, a surge due to a demand placed upon the load side during installation, improper seating of the meter into the meter socket, or employee contact with energized components via a tool or meter locking ring. The employee was described as wearing full personal protective equipment for electrical work, including rubber insulated gloves, leather gloves, a flame retardant long sleeve shirt, face shield, and safety glasses. No violations of Cal/OSHA regulations were found. However, the description of personal protective equipment that was utilized in this incident does not mention use of a balaclava. Because the work activity likely involved a 277 volt meter, it would appear to be a Hazard/Risk (PPE) Category 2 task under NFPA 70E, and it seems likely that use of the balaclava would have prevented the ear burn. Incident 3: Employee Electrocuted While Installing Lighting Unit
This fatal injury event occurred in 2006 when the victim and a co -worker were performing electrical installations late at night in a newly-renovated office space in an office building. The victim was a partner in the electrical contracting company that was doing the electrical work. According to a newspaper report, the victim normally

63
worked as a project manager and did not do work in the field, but was pitching in due to the company’s high volume of work. The workers began work between 3:00 p.m. and 3:30 p.m. and were working from a list of tasks that needed to be completed in preparation for an inspection scheduled for the following day, which included installing 120 volt slide dimmers, exit lights, motion sensors, and monorail track lighting. The victim was installing a light switch in the storage room of newly renovated office space at approximately 10:00 p.m. while the co-worker was in the lobby looking for a 120-volt circuit in the ceiling. The workers had not turned off the circuit at the breaker panels, and the victim was not wearing gloves. Power was coming from 277/488-volt panels to a 277 volt junction box in the ceiling. The co-worker reported that he heard the victim make a moaning sound and went to the storage room, where he found the victim on the floor. After unsuccessfully trying to call 911 from a cell phone, the co -worker took an elevator to the first floor and instructed a security guard to call 911, then returned to the victim to perform CPR. Paramedics arrived to transport the victim to a local hospital. The co-worker reported in an interview that it was common practice to work on live circuits, though employees were instructed not to perform live work, or to use gloves if they did. He also reported that workers purchased their own insulated tools and tha t gloves were provided by the company. He indicated that he had one pair of leather gloves that he inspected himself. According to the employer, the victim had taken a journeyman’s electrical class and a master electrician preparation class from local community colleges, and otherwise received training on the job. OSHA issued penalties to the employer for a number of safety violations that the agency identified in investigating the electrocution. OSHA found that workers were not trained in recognition of hazards associated with electrical equipment installations and in hazards associated with PPE, that workers wore improper gloves for electrical protection (leather gloves with a mesh design that had holes in the palms and fingers) while working with exposed live circuits, and that workers were permitted to work in proximity to electric power circuits without protection by deenergizing and grounding circuits or by guarding through insulation or other means, and that the company lacked inspection procedures for equipment and materials used by employees. Following meetings with OSHA in order to address its violations of state OSHA standards, the company took a series of steps in order to address its safety training and practices. The managing member/partner of the company assumed responsibility for developing a health and safety program for employees, and the company committed to ensuring proper electrical safety training and procedures and the provision, regular inspection, and proper use of personal protection equipment. Although a safety and health program manual that was developed by the company identified lockout/tagout procedures and PPE use, it made no mention of NFPA 70E. Notes from a foremen’s meeting six weeks after the electrocution indicated th at company leadership stressed the importance of making safety a priority, while also

64
emphasizing the need to stay on schedule and not let the death get the company behind, indicating that holiday bonuses could be affected by how well the company maintained its schedule. Implications for NFPA 70E Under NFPA 70E, the work in this fatal injury event should have been conducted deenergized. In addition, NFPA 70E requires the use of rubber insulating gloves, tested and verified before each use, for shock protection. The victim apparently wore no rubber insulating gloves, but the leather gloves that were utilized by the company would have provided no protection from electrical shock in any event. In 2006, when this event took place, the restricted approach boundary established by NFPA 70E began at 301 volts, and for 300 volts and less, “avoid contact” was recommended. The restricted approach boundary in the 2015 version of NFPA 70E is lowered from 301 to 151 volts, so the work that was performed at 277 volts in this event would now be subject to the restricted approach boundary requirements. Incident 4: Worker Electrocuted While Repairing Air Conditioner
This incident was of interest because it involved an electrocution fatality due to contact with 120-volt nominal electrical current. The victim was an air conditioner repair technician who worked for a mechanical repair company. On the day of the incident, he was working alone at a business location where he was servicing an air conditioning unit. The victim was working outside at the rear of the facility when he apparently touched an energized, 110-volt terminal with his left index finger while he knelt on the ground. The owner of the business stated that she looked out the window and saw the victim laying on the ground and that he didn’t respond when she asked if he was okay, at which point she called 911. The first emergency responders on the scene stated that it was obvious that the victim was deceased upon their arrival. The victim was transported to the county coroner for an autopsy. The coroner’s report indicated that the victim was kneeling on wet ground and touched a hot wire while his right hand was resting on the air conditioner case, which was grounded. The coroner determined that electrical current went through the victim’s left arm and heart and out his right arm, causing cardiac arrhythmia and instant death. The employer in this incident was a small company. The owner indicated to OSHA that the only way for the victim to have conducted a diagnostic test of the air conditioner in this incident would be to have done so with the power on. In an interview with OSHA, the owner provided no indication that the employer provided electrical safety training to employees or that the victim was otherwise trained in electrical safety. A newspaper report indicated that the victim was pursuing refrigeration certification at a local community college. OSHA issued citations to the company for permitting employees to work on live electrical equipment without approved personal protection equipment for energized

65
work and for not requiring or providing approved insulated tools to employees working on or near energized conductors or equipment. Implications for NFPA 70E This incident was of interest because it involves a fatal injury at low voltage (110 volts). NFPA 70E calls for electrical equipment to be deenergized except in instances where it would be infeasible or would create additional hazards. Incident 5: Three Employees Injured When Arc Flash Causes Fire This incident occurred in 2012 and involved an electrical engineer employed by the host company and two electricians, who worked for an electrical contractor that had a maintenance contract to service electrical equipment for the host company.
The electricians were on site to provide electrical maintenance in the shredder area of the host facility, a steel mill. When two extra cables were found in the shredder’s junction box, the electrical engineer asked the electricians to trace them, and they noted a connection to a capacitor as they studied single line prints. The host company electrical engineer circled the area where the work was to be done. The electrical engineer was said to later report that he failed to notice that the drawing included two different capacitors. A capacitor to the south of the shredder building provided voltage stabilization and was not labeled. A second capacitor was located in an electrical substation north of the building and provided power factor correction. It was marked, “capacitor bank.” The shredder was locked out at the substation, and the breaker in the substation panel designated as “capacitor bank” was open, with the panel door locked out to prepare for testing. When an initial continuity test didn’t work, one of the electricians called to the electrical engineer to ask if the capacitor bank breaker could be closed. The electrical engineer entered the substation enclosure to review the work with the two electricians and, believing that the breaker was locked out, agreed that it would be safe to close the breaker. The interlock on the cabinet door of the substation (marked “capacitor bank”) was defeated so that the door could stay open while the breaker was closed. At this point, the circuit was not tested to verify that it was deenergized after the breaker was closed. One of the electricians then attempted to test for continuity with a Fluke meter rated for a maximum of 1000 volts. However, because the upstream lockout only applied to the capacitor bank providing voltage stabilization and not the capacitor bank providing power factor correction, the meter was applied to a live circuit that was powered at 4160 volts nominal, creating a fault and an arc flash. The host company’s electrical engineer indicated that he was 8 to 10 feet from the origin of the arc flash as it occurred. He reported hearing a buzz and then feeling the flash, then saw that the electrician doing the testing was on fire. The engineer called for help while trying to extinguish the flames by rolling the electrician on the ground to the edge of the substation and back. A fourth employee, who heard a pop from the flash and saw smoke rising from the substation, called the plant’s emergency response team
66
by phone. The employees in the emergency response team responded with an automatic external defibrillator, fire extinguishers, and a medical equipment bag. They extinguished the electrician’s burning clothes with a fire extinguisher, then covered him with a polyester blanket to prevent shock. However, the blanket had to be pulled away and a fire extinguisher used a second time on the victim’s clothing after the blanket caught fire. The responders rolled the victim and patted down fire that was coming from underneath him, then provided first aid. While a request went out for a medical helicopter, water was poured on the electrician, and his arms, legs, and torso were wrapped in saran wrap. He was transported to a hospital burn unit, where he was admitted with burns that were reported to cover 55% of his body. The other two employees also suffered burn injuries. The second electrician, who estimated that he was 8 and a half feet from the flash origin, had run and then drove to the main security gate to summon help. He was treated at the first aid room of the main plant for burns to his arms and face, then was transported to the hospital by ambulance, where he was released the next day. The electrical engineer, also said to be 8 to ten feet from the point of flash origin, suffered serious burns to his hands as a result of trying to extinguish the electrician’s flaming clothing, while also receiving flash burns to his face. He also was transported by ambulance to the hospital and kept overnight. The OSHA investigation report noted that all of the injured workers were wearing safety glasses, 100% polyester high visibility safety vests, denim blue jeans, hard hats with chin strap, and work boots. The host company engineer, who wore a long sleeve Flame Resistant ATPV 7.7 cal/cm2 rated shirt, was the only worker who was wearing arc (and flame) resistant personal protective equipment. The electrician with the meter was also wearing rubber-coated nylon knit general-purpose gloves. The OSHA report noted that most of his high visibility vest melted, with portions of the melted vest stuck to the partially burnt cotton shirt on front and back. Because the dead front of the equipment was closed on the top, but open on the bottom, the lower portion of the electrician’s body was more seriously burned than the top, with fire consuming his pants except for part of the waist band and the bottom of the pant legs. The second electrician was wearing two cotton shirts and it was reported that the flash caused the outside bottom of his shirt to burn and his safety vest to melt. Following its investigation, the state OSHA authority issued a number of citations to the host employer for violations of the Occupational Safety and Health Act. Among these, the company was cited for failing to ensure that all personal protective equipment be of safe design and construction for the work to be performed, inasmuch as the high visibility vests that were required for use were made of polyester rather than flame resistant materials. In addition, OSHA observed that employees working in areas with potential electrical hazards were not provided with, or did not use, electrical protective equipment appropriate for the specific parts of the body to be protected for the work performed. This included failure to wear voltage r ated rubber gloves and leather covers, face protection, and flame resistant clothing.

67
Another citation concerned the failure to ensure that energy control procedures clearly and specifically outlined the scope, purpose, authorization, rules, and techniq ues to be utilized for controlling hazardous energy. This citation stemmed from the failure to prepare a specific statement on the intended use of the lockout procedures for the substation yard power and the shredder substation, identify the means to enfo rce compliance, and identify specific steps for shutting equipment down. The citation noted that the lockout procedure for the substation yard power only isolated the capacitor bank for power correction, not the power in the substation yard, and did not require a physical test to verify energy isolation. Similarly, the lockout procedure for the shredder substation did not identify that, although the breaker that needed to be locked out did not isolate the shredder substation, it did provide power to the shredder motor. The procedure failed to lock out the second capacitor bank that was downstream of the switch. The employer was additionally cited for failing to require that circuits be treated as energized until deenergization was verified through the use of appropriate test equipment by a qualified person. Another citation was issued because the electrical equipment used for power stabilization for a 3000 HP motor -- but with the potential to be energized at 4160 volts -- was inadequately marked to provide practical safeguarding of persons coming in contact with it. OSHA found that the pre -job briefing was not adequate to communicate safe procedures for deenergizing a capacitor bank, failing to identify the need for all circuits to be treated as ener gized until verified as deenergized by appropriate test equipment, to include a discussion of personal protective equipment, or adequately test a circuit for continuity. Implications for NFPA 70E This event involved a failure to comply with a number of NFPA 70E requirements. The use of a meter rated for a maximum of 1000 volts to test a circuit energized at 4160 volts was a violation of NFPA 70E-2015 Sec. 110.4(A)(2), which requires test instruments, equipment, and accessories to be rated for the circuits and equipment where they are utilized. In addition, the decision to close the breaker based on the assumption that the circuit was locked out upstream was a violation of Sec. 120.1 requirements for verifying an electrically safe work condition, which is achieved after the performance of specific lockout/tagout procedures and is verified by determining “all possible sources of electrical supply to the specific equipment” and checking “applicable up-to-date drawings, diagrams, and identification tags.” The OSHA investigation report indicated that the host company performed an arc flash assessment for the shredder equipment after the incident and that it was a hazard/risk category (HRC) 2 under NFPA 70E. In fact, however, because the incident involved equipment energized 4160 volts, it should have been classified as an HRC 4 exposure. The personal protective equipment required under NFPA 70E-2015, based on Table 130.7(C)(16), would have to meet a required minimum arc rating of 40 cal/cm2, including arc-rated long-sleeve shirt and pants or an arc-rated flash suit, arc-rated flash suit hood, hard hat, safety glasses, hearing protection, arc-rated gloves, and leather footwear. Other than wearing hard hats, safety glasses, and work boots, none
68
of the injured employees were equipped with adequate arc-rated clothing (or hearing protection) that complied with these requirements. It is also worth noting that the electricians were required by the employer to wear high visibility safety vests (which were made out of polyester) in the work area due to vehicle hazards. However, heat from the arc flash appears to have caused polyester to melt to the body of at least one of the injured workers and is likely to have complicated the injury. NFPA 70E-2015 Sec. 130.7 (C)(12) prohibits the use of clothing or other apparel made from materials that do not meet melting or flammability requirements for melting or flammability or clothing made from flammable synthetic materials that melt at temperatures below 315° (600°F). The OSHA investigation noted that the pre-job briefing failed to communicate safe procedures for deenergizing the capacitor bank or a discussion of PPE. NFPA 70E-2015 (in Section 110.1(H)) also requires a job briefing before each job in which the employee in charge briefs employees on hazards associated with the job, work procedures involved, special precautions, energy source controls, PPE requirements, and the information on the energized electrical work permit, if required. The failure to deenergize the capacitor bank prior to the commencement of work violated NFPA 70E-2015 requirements for stored energy (Section 120.2(F)(2)(b)), which outline requirements for released stored electrical or mechanical energy that might endanger personnel, including the requirement that “all capacitors shall be discharged, and high capacitance elements shall be short-circuited and grounded before the associated equipment is touched or worked on.” As described by the OSHA investigation, the interlock on the cabinet door of the substation was defeated so that the door could stay open while the breaker was closed. This violated NFPA 70E-2015 requirements for safety interlocks (Section 130.6(N)), which state that “only qualified persons following the requirements for working in side the restricted approach boundary as covered 130.4(C) shall be permitted to defeat or bypass an electrical safety interlock over which the person has sole control, and then only temporarily while the qualified person is working on the equipment.” The safety interlock is then to be returned to its operable conditions when the work is completed. Finally, OSHA noted that labels on equipment were added after the incident. NFPA 70E-2015 in Section 130.6(D) calls for electrical equipment likely to require examination, adjustment, servicing, or maintenance while energized to be field-marked with a label containing information on nominal system voltage, arc flash boundary and either the available incident energy and corresponding working distance or the minimum arc rating of clothing or the level of PPE. Incident 6: Employee Injured by Arc Flash While Installing Breakers in
Distribution Panel
This incident occurred in 2010 when an employee of an electrical contracting company suffered arc flash burns while installing breakers in the main distribution at a commercial construction site. The victim’s employer was an electrical subcontractor

69
at the site, and the arc flash was reported to have occurred when the victim either dropped a screw or made contact with two phases of energized circuitry with a screwdriver at the three-phase distribution panel (800 amp, 480 volts). The victim suffered first- and second-degree burns on his left arm, left upper back, left flank, right thigh, and right knee. After being treated at the work location by emergency medical services, he was transported to a hospital, then transferred to a medical center burn unit later in the day, where he was hospitalized for two weeks. Electrical power from the local power company was connected to the commercial building’s main distribution panel via feeder lines. The victim was a foreman and reportedly discussed whether to install the circuit breakers without having the power shut down with a second foreman before beginning the work. Because shutting power down required two to three days advance notice to the electrical utility, and because incoming tenants were already setting up equipment and didn’t want to shut down computer servers, the two foremen decided that the job could be done without shutting off the power. Both foremen regarded installing the circuit breakers to be a relatively simple process. The job would normally take approximately three hours, and the foremen determined that the work could be done by relying on personal protective equipment for protection. The victim reportedly wore leather gloves over rubber insulating gloves, arc flash head gear with face shield, and arc flash jacket. The second foreman, who was not wearing personal protective equipment, reported that he was standing about 10 feet from the panel while the work was being done when another electrician walked by and told him to move further away. He reported that the flash occurred seconds later and he apparently suffered no injuries from the flash. A report by responding firefighters included in the OSHA file indicated that upon their arrival, the victim was alert and responsive to questions and had burns on his arms and other areas prior to being transported to the hospital by EMS personnel. Firefighters reported that the flash fire had already been extinguished and that the electrical panel was extensively burned. The OSHA investigator concluded that the arc flash and injury could have been prevented if the main distribution panel had been placed in an electrically safe condition prior to the work. In the investigation report, the OSHA investigator noted that although the electrical contractor espoused a “no live work” policy, with no employee permitted to work on an energized electrical system without consent of senior management, its written safety and health policy also indicated that personal protective equipment was to be used in work involving energized electrical exposure to the body, and that only a crew leader or project manager could designate a competent person to perform energized electrical work. The investigator determined that the company’s written safety rules were contradictory and had not been effectively communicated to employees. The investigation also pointed out that the two foremen – both of whom were designated by the contractor as competent persons and whose duties included responsibility for hazardous awareness and accident prevention and for proper personal protective equipment usage and training at each
70
jobsite -- believed they could install circuit breaker boxes on the main distribution panel without deenergizing it. The contractor was cited for violation of electrical safety-related work practice in which equipment was not placed in an electrically safe work condition prior to the installation of circuit breakers. Implications for NFPA 70E It is apparent that the justification for failing to deenergize electrical equipment in this incident – which focused solely on the inconvenience of shutting power off – would not meet the necessary conditions for working energized under NFPA 70E. Turning off the power would have prevented the arc flash and the subsequent injuries. Nevertheless, it is worth noting that injuries occurred even with the use of arc resistant PPE, which raises the possibility that the PPE would not be adequately protective irrespective of whether working on energized equipment could be justified under NFPA 70E. Specifically, the OSHA report indicates that the worker wore an arc flash jacket and still suffered burns to his left arm and left upper back. These burns should have been prevented by the arc flash jacket if they were greater than 2nd degree burns. The worker was not wearing arc rated pants. The burns to the flank, thigh, and knee may have been prevented if arc rated pants had been worn.
71
Section V: Discussion This research indicates that there are encouraging results to be found in the workplace electrical injury experience in the United States, with a general decline in the number of electrical injuries recorded annually over the past 20 years. The steady and dramatic decrease in fatal electrical injuries over this period is particularly encouraging. However, the data also clearly indicate that exposure to electricity continues to be a substantial cause of injury and death among workers in the U.S, with nearly 2,000 fatalities and over 24,000 non-fatal injuries in the ten years from 2003 through 2012. Continuing efforts are therefore needed in order to strengthen electrical safety practices in the workplace and increase the awareness of electrical safety hazards among workers, supervisors, and management.
Electrical injuries carry special significance in part because they can be so devastating. Medical literature clearly indicates that electrical injuries represent an unusually severe form of injury and are oftentimes accompanied by tremendous physical, emotional, and psychological complications. An obvious function of electrical injury severity, as underscored in the literature, is that they result in prolonged absences from work, as well as a range of potential difficulties if and when the return to work is made. Our own analysis of injury data from the Bureau of Labor Statistics also provides some indication that victims of electrical injury frequently experience delays in their return to work. These factors – the severity of injury and attendant time away from work – further contribute to what we have seen is the unusually high economic cost of electrical injury.
Of course, electrical injuries do not take place in a vacuum. Violations of basic electrical safety requirements figure prominently in the federal OSHA annual top ten list of the most frequently cited workplace health and safety violations. Similar to prior years, violations related to electrical safety in the 2014 list included “lockout/tagout” at the number six slot, “electrical, wiring methods” at number eight, and “electrical systems design, general requirements” at number nine (Morrison, 2014). The electrical injury problem is quite evidently related to the more fundamental problem of inadequate electrical safety work practices, and reductions in the former will hinge on continued improvements in the latter.
The classical approach to workplace safety applies a hierarchy of controls approach to workplace hazards, prioritizing control methods from most to least effective. The preferable approach, when feasible, is to eliminate the hazard, such as redesigning a work process to avoid the use of a toxic chemical. If the hazard cannot be eliminated, the next preferred option is substitution, replacing the toxic chemical in this example with a safer alternative. When neither elimination nor substitution is possible , the hierarchy calls for engineering controls, which entail a physical change to a work process, such as a barrier or a ventilation control. Failing these, the less preferred options are administrative controls, which include such measures as training or setting limits on time of exposure to a hazard, and, as the least preferred control, the use of personal protective equipment. Administrative controls and personal protective equipment are not unimportant, and are critical for electrical safety, but are
72
considered less optimal because they focus on the worker, rather than the hazard. NFPA 70E essentially follows the hierarchy of controls model in establishing the deenergization of energy sources as the preferred approach to working on or around electrical hazards, while generally emphasizing personal protective equipment as a last resort or additional level of protection, rather than the first line of defense.
However, it is clear from our reviews of OSHA incidents and prior research that a substantial amount of work is inappropriately taking place on or around electrical sources that are energized, that stringent guidelines for personal protective equipment are frequently flouted, and that administrative controls, such as training and pre -job planning, are implemented or practiced haphazardly. The OSHA incidents and research show that a variety of factors contribute to the failure to comply with NFPA 70E requirements – inadequate training, sense of time pressure, desire to meet customer needs, and desire to get scheduled work done. In some cases, injuries result when workers encounter unmarked power sources or unsafe or unanticipated electrical conditions that are left behind by prior work. The research indicates that many workers who experience electrical injury have inadequate safety training to recognize safety hazards and follow proper procedures. This may frequently be the case in some service occupations, as well as with immigrant workers or workers in temporary positions, but it is also evident that managers and supervisors – even those who work in the electrical field – may not themselves be knowledgeable about electrical hazards, even as they direct activities of employees who may be exposed to energy sources in the course of their work.
In just the limited number of OSHA incidents that we reviewed, we identified incidents in which:
Workers were either not provided with PPE or were provided with inappropriate or inadequate PPE.
Workers were assigned tasks involving working with electrical energy for which they had inadequate training.
Pre-job planning and discussions failed to recognize all energy sources that needed to be deenergized in order to achieve electrically safe work conditions.
Pre-job discussions introduced extraneous considerations that compromised rather than promoted safety, such as deciding to leave equipment energized in order to avoid inconveniencing or to complete work by a specified time.
Mixed signals from management about safety by holding safety meetings that emphasize working safely but also underscore completing scheduled work on time and link holiday bonuses to production schedules.
When workers are injured at work, there is often a tendency to attribute responsibility to individual behaviors, and this may be especially true with electrical injuries when workers fail to wear proper PPE, undertake only minimal pre-job planning, or perform work on equipment in an energized state. Certainly, safety is undermined when workers become complacent about risk or the performance of job tasks, particularly when the hazards and tasks are part of an everyday routine. Beyond mere

73
complacency, however, a “normalization of deviance” has been identified as a process in which deviation from a safety standard gradually becomes accepted practice, and effectively begins to operate as a new norm, without there ever being any change in the more stringent formal standard. (Peeples, 2013) It is not difficult to envision this pattern at work in electrical safety work practices, with shortcuts taken because of time pressure or for convenience evolving into routine practices, with the wisdom of stringent requirements only revealed when the shortcuts lead to injuries or other adverse results. It is nevertheless important to recognize that these individual behaviors take place within larger organizational contexts, and the issue of whether the critical requirements of NFPA 70E are followed in practice will be influenced not just by individual workers, but more fundamentally by workplace systems that determine the weight attached to safety as an organizational priority.
Organizational safety culture is gaining recognition as a crucial factor in determining the extent to which safety considerations are incorporated into the performance of day-to-day work tasks (Smith, 2013). Safety culture is broadly defined as the “deeply held but often unspoken safety-related beliefs, attitudes, and values that interact with an organization’s systems, practices, people, and leadership to establish norms about how things are done in the organization.” (Gillen et al., 2013) Without a visible organizational commitment to safety, workers are likely to be guided by organizational recognition and reward systems that emphasize tangible contributions to productivity, just as production pressures (as well as inadequate training) contribute to workers taking shortcuts with electrical safety work practices. Strong workplace safety cultures can counteract deviations from electrical safety norms by promoting safety processes as an organizational value, with attendant recognition systems.
A 2013 symposium on workplace safety culture and climate that was organized by NIOSH and the Center to Protect Workers’ Rights identified several components that were seen to be particularly instrumental in establishing a positive organizational safety culture. (Gillen et al., 2013) These include:
Management commitment. The demonstration of management commitment to safety includes such actions as allocating adequate resources to safety, integrating safety into every meeting, being visible to workers with safety messages, striving for zero hazard and zero injury worksites, and establishing formal processes for corrective action.
Aligning and integrating safety as an organizational value. Strong safety cultures promote safety as a value equal to other core business goals through such actions as integrating safety concepts into policies and procedures, bring personnel from different departments or jobs to discuss project safety strategies, regularly communicating expectations about safety practices, ensuring that safety isn’t sacrificed for productivity, and reinforcing safety through training initiatives.
Ensuring accountability at all levels. In order to avoid sending mixed messages about safety, strong safety cultures seek to ensure that all employees are held accountable for safety. Recognizing employees who identify and report hazards,
74
conducting incident investigations that contribute to organizational learning rather than assign blame, incorporating safety into hiring supervisors and evaluating supervisor performance are potential ways enhance organization-wide accountability.
Improve supervisory leadership. Supervisors play a vital role in safety cultures because of their ability to direct work and intervene in work processes when hazards arise. Supervisors require both proper training and safety-related attitudes to provide safety leadership, and should be able to communicate with workers and encourage participation in instilling good safety practices.
Employee involvement. Employee participation is seen to be a key element in creating and maintaining positive safety cultures. By involving workers in identifying hazards, implementing safety measures, and planning for safety, they will be more likely to speak up when they feel safety is compromised. Such participation could provide some protection against pre-job planning as a rote exercise in discussions about how to deal with electrical hazards.
Improving communication. Active two-way communication processes about safety are instrumental in establish safety culture. Mechanisms of safety communication could include systems for sharing information on incidents and close calls, transparent processes for identifying safety issues, daily safety briefings and joint walk-arounds, and inclusion of safety discussions at meetings.
Training at all levels. Regular and effective safety training at all levels of the organization is seen to facilitate the ability of employees to understand wher e they fit in relation to project safety and to affirm safety as an organizational priority.
Encouraging owner and client involvement. A demonstrated commitment by owners to safety is strategically invaluable in symbolically and operationally setting the foundation for organizational safety culture. Top-level commitment to safety is demonstrated through such indicators as ensuring adequate resources for safety, using safety measures as criteria for prequalifying and evaluating bids, supporting safety performance audits, keeping up to date with and utilizing best safety practices, and making visits to worksites to meet with and learn from work crews.
Understandably, the organizational dimensions of good workplace health and safety practice fall outside the scope of NFPA 70E, which has a technical mandate for identifying the requisite practices and procedures to protect workers from electrical hazards. The influence of organizational and other situational conditions on how electrical safety requirements are implemented in practice are nonetheless worth noting in attempting to evaluate the effectiveness of NFPA 70E specifications. Decisions by employees to leave equipment in an energized state, for instance, may on first review appear to be egregiously reckless, but in practice reflect a rational effort to meet production goals or comply with supervisor instruction rather than risk disciplinary action or poor performance reviews. Not only do workers need to be aware of NFPA 70E requirements in order to follow them in practice, but they need to be confident of organizational support in doing so.
75
Beyond shortfalls in following electrical safety procedures, research indicates that many workers and supervisors have insufficient training in recognizing and working with or around electrical hazards, and this may be particularly true for service workers, many of whom aren’t typically seen to be at risk for electrical injury. It is clear that workers in non-electrical occupations who should be subject to certain of the NFPA 70E protections experience a number of electrical injuries. These findings offer strong support to the decision to include additional information in the 2015 edition of NFPA 70E and ensure the standard’s protective measures to all workers who may be exposed to electrical hazards, and not just qualified electrical workers. Continuing efforts will be needed in this area to improve the training and safety of workers who aren’t normally recognized as at risk for electrical injury.
Available evidence indicates that better compliance with existing NFPA 70E requirements would reduce a substantial share of electrical injuries in U.S. workplaces. It is difficult with current information resources to systematically identify electrical injury events in which NFPA 70E requirements were insufficiently stringent to prevent injury – that is, where NFPA requirements were followed, but an injury occurred anyway. OSHA’s searchable IMIS database does provide a means to identify some unknown portion of arc flash and other electrical injury events, and this is a resource that could be used to identify a larger sample of arc flash or other incidents, which could then be used in seeking fuller incident information by means of FOIA re quests. As indicated earlier, however, incidents in the IMIS system are not entirely representative of workplace electrical injuries, since incidents investigated by the federal OSHA are limited to those resulting in fatalities or injuries to three or more workers (although states with their own OSHA plans may conduct investigations of incidents with fewer than three injuries). The OSHA database also does not include any incidents that are not reported to OSHA.
Preventing electrical injury to workers represent an ongoing challenge, and there are several areas suggested by this research where additional study could prove useful to prevention efforts. In light of the critical importance of wearing PPE in work with energized electrical sources, certainly one area of further inquiry would be to undertake systematic research into barriers to the use of proper PPE among electrical workers, with suggested solutions to improve PPE use. In addition, more detailed examination of the types of injury events associated with specific occupations and places of employment could help identify areas of particular need, whether through education, training, or other form of prevention initiative. Here, injury incidents involving workers who do not regularly work with electrical sources and who lack electrical safety training may be particularly instructive. Another area for additional research and safety training efforts is the practice of placing machinery and equipment in a deenergized state for troubleshooting. We learned of developments in this area only at the close of research and believe they merit further investigation as a promising safety intervention. Of course, efforts to promote prevention at the top of the hierarchy of controls, particularly through designing out hazards in the first instance, must remain a priority focus.
76
References Akbar-Khanzadeh F (1998). Factors Contributing to Discomfort or Dissatisfaction as a Result of Wearing Personal Protective Equipment. Journal of Human Ergology 27:70-75. American Burn Association (2014). National Burn Repository Report 2004-2013. Available at: http://www.ameriburn.org/2014NBRAnnualReport.pdf. Accessed October 12, 2014. American Society of Safety Engineers (2002). Summary Addressing the Return on Investment (ROI) for Safety, Health, and Environmental (SH&E) Management Programs. Available at: http://www.asse.org/bosc-article-6/. Accessed December 12, 2014. Arnoldo BD, Purdue GF, Kowalske K, Helm PA, Burris A, Hunt JL (2004). Electrical Injuries: A 20-Year Review. Journal of Burn Care Rehabilitation 25:479-484. Bailey B, Forget S, Gaudreault P (2001). Prevalence of Potential Risk Factors in Victims of Electrocution. Forensic Science International 123:58-62. Bernius M, Lubin J (2009). Electrocution and Electrical Injuries. In: DC Cone, RE O’Connor, RI Fowler (eds.) Emergency Medical Service Clinical Practice and Systems Oversight, Vol. 1. Kendall Hunt Publishing, Dubuque, IA; 2009:44-50. Bikson M (2004). A review of hazards associated with exposure to low voltages. Department of Biomedical Engineering. The Graduate School and University Center of the City University of New York. New York, NY. Available at: http://bme.ccny.cuny.edu/faculty/mbikson/BiksonMSafeVoltageReview.pdf. Accessed August 17, 2014. Brandt M, McReynolds MC, Ahrns KS, Wahl WL (2002). Burn Centers Should Be Involved in Prevention of Occupational Electrical Injuries. Journal of Burn Care and Rehabilitation 23:132-134. Brenner B, Cawley JC (2009). Occupational Electrical Injury and Fatality Trends: 1992-2007. EHS Today. Available at: http://ehstoday.com/construction/news/occupational-electrical-injury-3991. Accessed December 29, 2014. California Department of Health Services (2006). A Hotel Maintenance Worker Died from Injuries Received from an Arc Flash. Richmond, CA: Fatality Assessment and Control Evaluation (FACE) Report No. 06CA008. Capelli-Schellpfeffer M, Landis FH, Eastwood K, Liggett DP (2000). Electrical Accidents. IEEE Industry Applications Magazine, May/June: 16-23.

77
Cawley JC (2011). Occupational Electrical Accidents in the U.S., 2003-2009. ESFI White Paper. Available at:http://www.esfi.org/index.cfm?pid=11406&view=list&sb=date&st=desc&m=0&y=0&type1=0&type2=20&change=View. Accessed November 8, 2014. Cawley JC, Homce GT (2007). Protecting Miners from Electrical Arcing Injury. NIOSHTIC-2 No. 20032718, National Institute for Occupational Safety and Health. Available at: www.cdc.gov/niosh/mining/userfiles/works/pdfs/pmfea.pdf. Accessed October 1, 2014. Cawley JC, Homce GT (2006). Trends in Electrical Injury in the U.S., 1992-2002. In Proceedings of the IEEE Petroleum and Chemical Industry Committee Annual Conference, Philadelphia, PA, September 11-1, 2006, IEEE, 325-328. Chudasama S, Goverman J, Donaldson JH, van Aalst J, Cairns BA, Hultman CS (2010). Does Voltage Predict Return to Work and Neuropsychiatric Sequelae Following Electrical Burn Injury? Annals of Plastic Surgery 64:522-525. Cooper MA (1995). Emergent Care in Lightning and Electrical Injuries. Seminars in Neurology 15:268-278. Cooper MA, Price TG (2002). Electrical and Lightning Injuries. In: Marx JA (ed). Rosen’s Emergency Medicine: Concepts and Clinical Practice, 5 th ed. St Louis, MO, p.2010-2020. DiMaio VJ, Dimasio D (2001). Forensic Pathology, 2nd ed. CRC Press, Boca Raton, FL. Doan DR, Hoagland H, Neal T (2010). Update of Field Analysis of Arc Flash Incidents, PPE Protective Performance and Related Worker Injuries. IEEE Paper No. ESW2010-15. Farooqui R, Ahmed SM, Panthi K, Azhar S (2009). Addressing the Issue of Compliance with Personal Protective Equipment on Construction Workers: A Worker’s Perspective. Proceedings of the 45th ASC Annual Conference, Gainesville, FL, April 2-4, 2009. Gillen M, Goldenhar LM, Hecker S, Schneider S (2013). Safety Culture and Climate in Construction: Bridging the Gap Between Research and Practice. Proceedings from CPWR sponsored Safety Culture/Climate Workshop, Washington, D.C., June 11-12, 2013. Available at: http://www.cpwr.com/sites/default/files/CPWR_Safety_Culture_Final_Report%20with%20links.pdf. Accessed October 21, 2014. Homce GT, Cawley JC (2007). Understanding and Quantifying Arc Flash Hazards in the Mining Industry. Proceedings of the IEEE Industry Applications Society Conference, New Orleans, LA. Available at:
78
www.cdc.gov/niosh/mining/userfiles/works/pdfs/uaqafh.pdf. Accessed October 9, 2014. Janicak CA (2008). Occupational Fatalities Due to Electrocution in the Construction Industry. Journal of Safety Research 39:617-21. Kentucky Injury Prevention and Research Center (2004). Licensed Electrician Dies When Electrocuted by 480 Volts. Lexington, KY: Fatality Assessment and Control Evaluation (FACE) Report No. 03KY115. Koumbourlis AC (2002). Electrical Injuries. Critical Care Medicine 30(Suppl):S424-S430. Kowalski-Trakofler K, Barrett E (2007). Reducing Non-Contact Electric Arc Injuries: An Investigation of Behavioral and Organizational Issues. Journal of Safety Research 38:597-608. Kroll MW, Panescu D (2011). Physics of Electrical Injury. In: Ho J, Dawes D, Kroll M (eds.) Forensic Medicine of Conducted Electrical Weapons. Springer, New York City. Lee RH (1982). The Other Electrical Hazard: Electric Arc Flash Burns. IEEE Paper IPSD 81-55. Lee RC, Zhang D, Hannig J (2000). Biophysical Injury Mechanisms in Electrical Shock Trauma. Annual Review of Biomedical Engineering 02:477-509. Leibovici D, Shemer J, Shapra SC (1995). Electrical Injuries: Current Concepts. Injury 26:623-627. Lombardi DA, Matz S, Brennan MJ, Smith GS, Courtney TK (2009). Etiology of Work-Related Electrical Injuries: A Narrative Analysis of Workers’ Compensation Claims. Journal of Occupational and Environmental Hygiene 6:612-623. Lutton CE (1994). Economic Impact of Injuries Associated with Electrical Events. Annals of the New York Academy of Sciences 720:272-276. Luz DP, Millan LS, Alessi MS, Uguetto WF, Paggiaro A, Gomez DS, Ferreira MC (2009). Electrical Burns: A Retrospective Analysis Across a 5-Year Period. Burns 35: 1015-1019. Manuele FA (2011). Accident Costs: Rethinking Ratios of Indirect to Direct Costs. Professional Safety, Journal of the American Society of Safety Engineers 56:39-47. McMann M, Hunting KL, Murawski J, Chowdhury R, Welch L (2003). Causes of Electrical Deaths and Injuries Among Construction Workers. American Journal of Industrial Medicine 43:398-406.
79
Morrison K (2014). OSHA’s Top 10: The More Things Change… Safety and Health, November 28, 2014. Available at: http://www.safetyandhealthmagazine.com/articles/11414-osha-top-10-2014-the-more-things-change. Accessed December 29, 2014. National Fire Protection Association (2014). NFPA 70E: Standard for Electrical Safety in the Workplace, 2015 Edition. Quincy, MA: National Fire Protection Association. National Institute for Occupational Safety and Health (1998). Worker Deaths by Electrocution: A Summary of NIOSH Surveillance and Investigative Findings. Cincinnati, OH: NIOSH Report No. 98-131. National Safety Council (2014). Injury Facts, 2014 Edition. Itasca, IL. New Jersey Department of Health and Senior Services (2005) Hispanic Factory Worker Dies of Burns After Improperly Testing a 480-Volt Electrical Bus Bar. Trenton, NJ: Fatality Assessment and Control Evaluation (FACE) Report No. 04NJ059. Noble J, Gomez M, Fish JS (2006). Quality of Life and Return to Work Following Electrical Burns. Burns 32:159-64. Ore T, Casini V (1996). Electrical Fatalities Among U.S. Construction Workers. Journal of Occupational and Environmental Medicine 38:587-592. Peeples LC (2013). Firefighter Safety: The Normalization of Deviance. Fire Engineering. Available at: http://www.fireengineering.com/articles/2013/05/firefighter-safety--the-normalization-of-deviance.html. Accessed October 12, 2014. Pegula SM (2004). Occupational Fatalities: Self Employed Workers and Wage and Salary Workers. Monthly Labor Review 2004 (March):30-40. Personick ME (1990). Heat Burns Sustained in the Workplace. Monthly Labor Review July 1990:37-38. Pransky G, Moshenberg D, Benjamin K, Portillo S, Thackrey JL, Hill-Fotouhi C (2002). Occupational Risks and Injuries in Non-Agricultural Immigrant Latino Workers. American Journal of Industrial Medicine 42:117-123. Salehi SF, Fatemi MJ, Asadi K, Shoar S, Ghazarian AD, Samimi R (2014). Electrical Injury in Construction Workers: A Special Focus on Injury with Electrical Power. Burns 40:300-4. Sances Jr. A, Larson SJ, Myklebust J, Cusick JF (1979). Electrical Injuries. Surgery, Gynecology and Obstetrics 149:97-108.
80
Singerman J, Gomez M, Fish JS (2008). Long-Term Sequelae of Low-Voltage Electrical Injury. Journal of Burn Care Research 29:773-777. Smith MM (2013). Eight Cultural Imperatives for Workplace Safety. Occupational Health and Safety. Available at: http://ohsonline.com/Articles/2013/09/01/Eight-Cultural-Imperatives-for-Workplace-Safety.aspx. Accessed January 8, 2015. Stergiou-Kita M, Mansfield E, Bayley M, Cassidy JD, Colantonio A, Gomez M, Jeschke M, Kirsh B, Kristman V, Moody J, Vartanian O. (2014) Return to Work After Electrical Injuries: Workers’ Perspectives and Advice to Others. Journal of Burn Care Research 35:498-507. Taylor AJ, McGwin Jr. G, Valent F, Rue III LW (2002). Fatal Occupational Electrocutions in the United States. Injury Prevention 8:306-312. Theman K, Singerman J, Gomez M, Fish JS (2008). Return to Work After Low-Voltage Electrical Injury. Journal of Burn Care Research 6:959-64. U.S. Bureau of Labor Statistics (2009). Chapter 9. Occupational Safety and Health Statistics. In: BLS Handbook of Methods. Available at: http://www.bls.gov/opub/hom/pdf/homch9.pdf. Accessed February 25, 2015. U.S. Bureau of Labor Statistics (2013). Labor Force Characteristics by Race and Ethnicity, 2012. Washington D.C.:U.S. Bureau of Labor Statistics Report 1044. U.S. Bureau of Labor Statistics (2014). Foreign-Born Workers: Labor Force Characteristics – 2013. Washington D.C.: USDL-14-0873. Available at: http://www.bls.gov/news.release/forbrn.nr0.htm. Accessed January 20, 2015. U.S. Department of Labor, Occupational Safety and Health Administration Office of Communications (2010). U.S. Department of Labor Files Worker Safety Complaint Against USPS. Washington D.C., Release Number:10-945-NAT. Available at: http://www.dol.gov/opa/media/press/osha/OSHA20100945.htm. Accessed January 20, 2015. U.S. Department of Labor, Occupational Safety and Health Administration (2014). Final Rule: Electric Power Generation, Transmission, and Distribution; Electrical Protective Equipment. Federal Register, vol.79, no. 70:20315-20743. Varol E, Ozaydin M, Altinbas A, Dogan A (2004). Low-Tension Electrical Injury as a Cause of Atrial Fibrillation. Texas Heart Institute Journal 31:186-187. Washington State Department of Labor and Industries (2006). Arc Flash/Blast. Burn Injury Facts. Olympia, WA: Report # 86-1-2006. Wellman CM (2012). OSHA Arc-Flash Injury Data Material. IEEE Paper ESW2012-28.
81
Wesner ML, Hickie J (2013). Long-Term Sequelae of Electrical Injury. Canadian Family Physician 59:935-939. White MK, Vercruyssen M, Hodous TK (1989). Work Tolerance and Subjective Responses to Wearing Protective Clothing and Respirators During Physical Work. Ergonomics 32:1111-1123. Workplace Safety Awareness Council (Undated). Train-the-Trainers Guide to Electrical Safety for General Industry. Available at: https://www.osha.gov/dte/grant_materials/fy07/sh-16615-07/train-the-trainer_manual2.pdf. Accessed: February 26, 2015. Wyzga RE, Lindroos W (1999). Health Implications of Global Electrification. Annals of the New York Academy of Science 888:1-7.