Embed Size (px)
Citation preview
1
Prepared for Baidu, September 2015 | GfK Indonesia
Mobile Apps Market Study – Initial Results
2
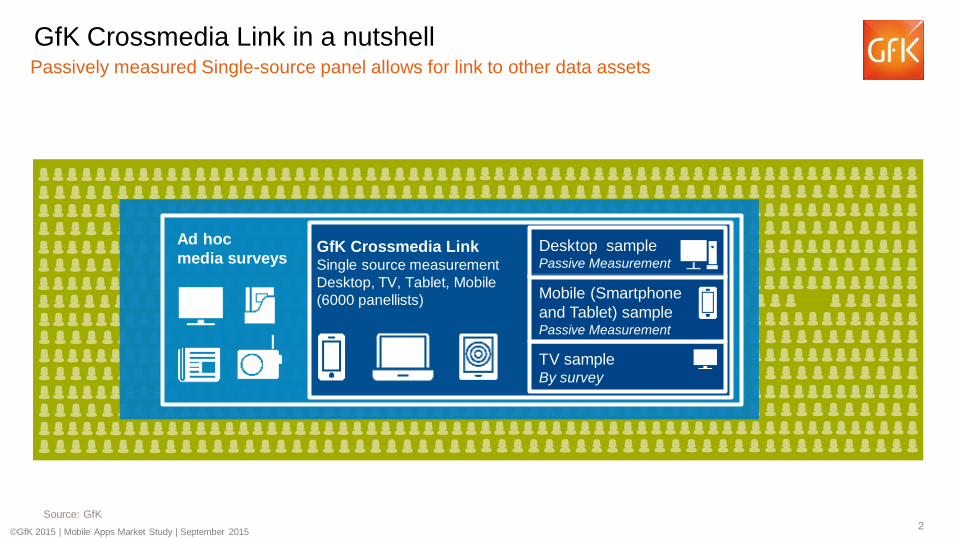
Passively measured Single-source panel allows for link to other data assets
GfK Crossmedia Link in a nutshell
Ad hoc
media surveys GfK Crossmedia LinkSingle source measurement
Desktop, TV, Tablet, Mobile
(6000 panellists)
TV sampleBy survey
Mobile (Smartphone
and Tablet) sample Passive Measurement
Desktop samplePassive Measurement
Source: GfK
©GfK 2015 | Mobile Apps Market Study | September 2015
3
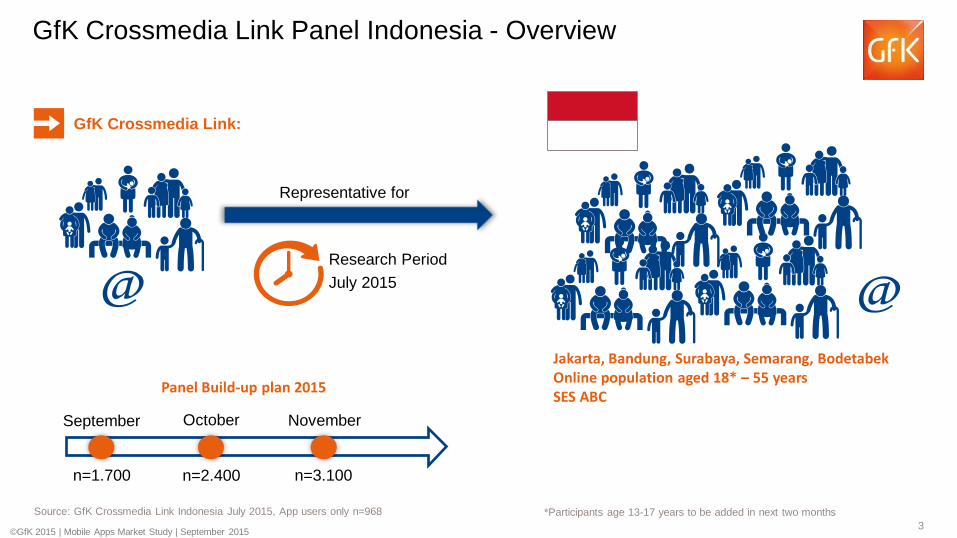
Source: GfK Crossmedia Link Indonesia July 2015, App users only n=968 *Participants age 13-17 years to be added in next two months
GfK Crossmedia Link Panel Indonesia - Overview
GfK Crossmedia Link:
Jakarta, Bandung, Surabaya, Semarang, BodetabekOnline population aged 18* – 55 yearsSES ABC
Representative for
Research Period
July 2015
September October November
n=1.700 n=2.400 n=3.100
Panel Build-up plan 2015
©GfK 2015 | Mobile Apps Market Study | September 2015

4
Total market for smartphones including 2015 estimation by GfK Trends and Forecasting
Market Size of Smartphone and Featurephone 2015Smartphone sales growth will allow more Indonesians to access the internet and fuel usage of
online apps
+5%
compare
to PY
33 Mio
Total Smartphones
Sold in units
Total Featurephone
Sold in Units
20 Mio
-29%
compare to
PY
©GfK 2015 | Mobile Apps Market Study | September 2015

5
Indonesians predominantly access the internet on smartphones
Source: GfK Enumeration study Indonesia, Badan Pusat Statistik 2015
Online population Indonesia – split by devices
Online population
% of total population
Smartphone user
% of online pop.
Tablet user
% of online pop.
Desktop user% of
online pop.
64.1* 93.0* 5.0* 11.0*
*5 cities: Jakarta, Bandung, Surabaya, Semarang, Bodetabek
18**+ yrs
©GfK 2015 | Mobile Apps Market Study | September 2015
**Participants age 13-17 years to be added in next two months
6
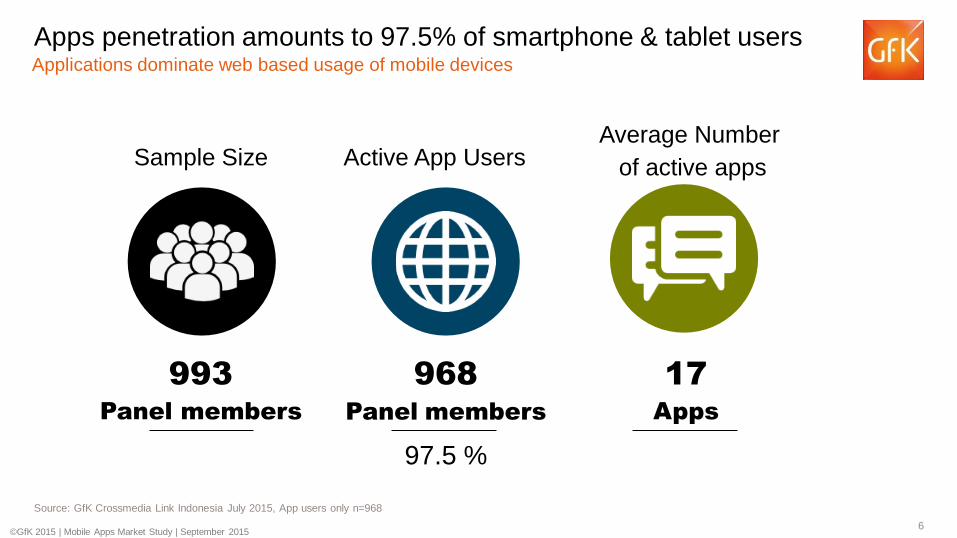
Apps penetration amounts to 97.5% of smartphone & tablet users
Source: GfK Crossmedia Link Indonesia July 2015, App users only n=968
993
Panel members
Sample Size Active App Users
968
Panel members
97.5 %
Average Number
of active apps
17
Apps
Applications dominate web based usage of mobile devices
©GfK 2015 | Mobile Apps Market Study | September 2015
7
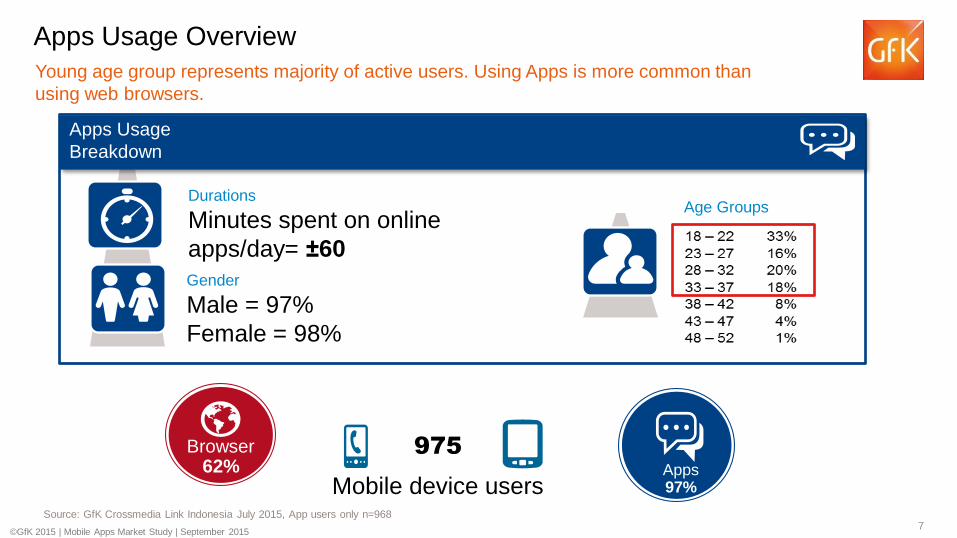
Young age group represents majority of active users. Using Apps is more common than
using web browsers.
Apps Usage Overview
Apps97%
Age GroupsDurations
Minutes spent on online
apps/day= ±60
Gender
Male = 97%
Female = 98%
Apps Usage
Breakdown
Source: GfK Crossmedia Link Indonesia July 2015, App users only n=968
©GfK 2015 | Mobile Apps Market Study | September 2015
Mobile device users
975Browser62%
8
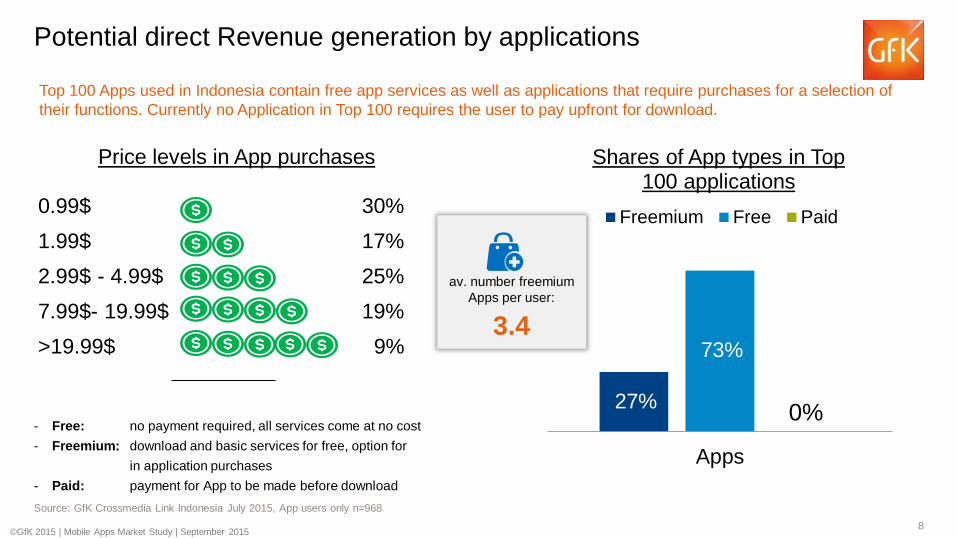
Potential direct Revenue generation by applications
Price levels in App purchases
Top 100 Apps used in Indonesia contain free app services as well as applications that require purchases for a selection of
their functions. Currently no Application in Top 100 requires the user to pay upfront for download.
- Free: no payment required, all services come at no cost
- Freemium: download and basic services for free, option for
in application purchases
- Paid: payment for App to be made before download
0.99$ 30%
1.99$ 17%
2.99$ - 4.99$ 25%
7.99$- 19.99$ 19%
>19.99$ 9%
27%
73%
0%
Apps
Shares of App types in Top 100 applications
Freemium Free Paid
av. number freemium
Apps per user:
3.4
©GfK 2015 | Mobile Apps Market Study | September 2015
Source: GfK Crossmedia Link Indonesia July 2015, App users only n=968
9
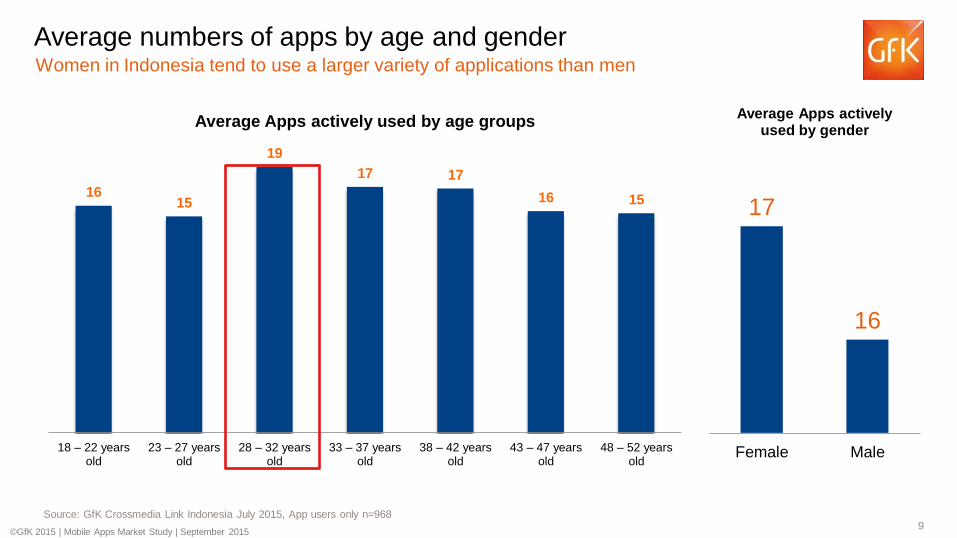
Average numbers of apps by age and gender
1615
19
17 17
16 15
18 – 22 years old
23 – 27 years old
28 – 32 years old
33 – 37 years old
38 – 42 years old
43 – 47 years old
48 – 52 years old
Average Apps actively used by age groups
Source: GfK Crossmedia Link Indonesia July 2015, App users only n=968
17
16
Female Male
Average Apps actively used by gender
©GfK 2015 | Mobile Apps Market Study | September 2015
Women in Indonesia tend to use a larger variety of applications than men
10
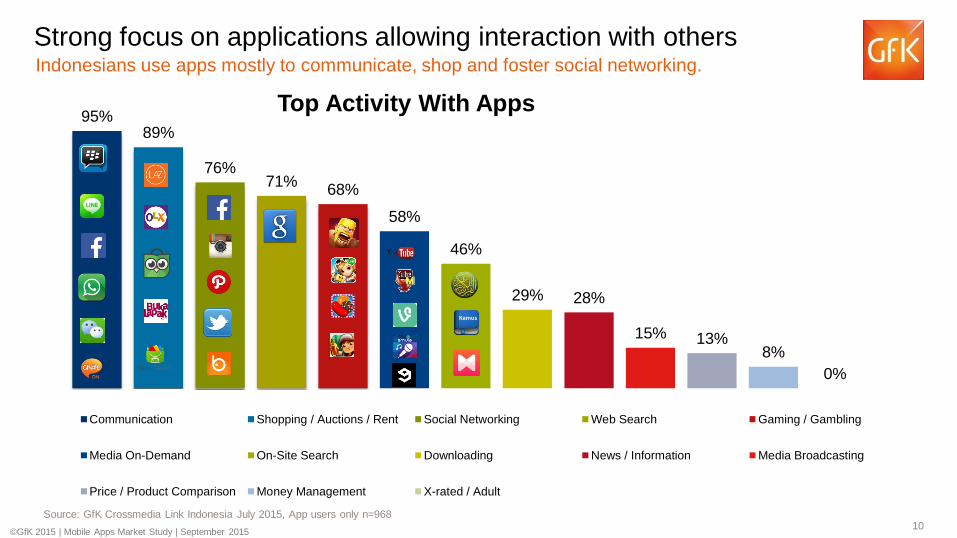
Strong focus on applications allowing interaction with others
95%89%
76%71%
68%
58%
46%
29% 28%
15% 13%8%
0%
Top Activity With Apps
Communication Shopping / Auctions / Rent Social Networking Web Search Gaming / Gambling
Media On-Demand On-Site Search Downloading News / Information Media Broadcasting
Price / Product Comparison Money Management X-rated / Adult
Indonesians use apps mostly to communicate, shop and foster social networking.
Source: GfK Crossmedia Link Indonesia July 2015, App users only n=968
©GfK 2015 | Mobile Apps Market Study | September 2015

11
Portals, Entertainment, and Travel Apps dominate the market
97%
76%
36%
12% 10% 9% 8% 6% 4% 3% 2% 1% 1% 1% 1% 1%
Top Apps by Content
Multi-Content / Portal Entertainment / Media Travel Telecom
Lifestyle / Hobbies Religion Finance IT / Software / Office
Weather Sports Education / Training Family
Fashion Dating / Relationship Business / Economy Employment / Career
Source: GfK Crossmedia Link Indonesia July 2015, App users only n=968, GfK Crossmedia Link Brazil July 2015 n=1.987
Many branches still lack adequate representation in applications. Few people use applications
for managing their finances and educational purposes.
©GfK 2015 | Mobile Apps Market Study | September 2015
1 Multi-Content / Portal 100%
2 Entertainment / Media 62%
3 Travel 28%
4 Finance 22%
5 Lifestyle / Hobbies 11%

12
Top Apps By Category, breakdown by age
Group of 28 – 32 year olds exhibits openness to use applications to ease everyday choirs
such as maintaining their finances and telco subscriptions.
Source: GfK Crossmedia Link Indonesia July 2015, App users only n=968
©GfK 2015 | Mobile Apps Market Study | September 2015
97%
75%
37%
11% 11% 7%
88%
77%
33%
11% 7%
97%
80%
39%
18%13% 7%
Multi-Content/Portal
Entertainment/Media
Travel
Lifestyle/Hobbies
Telecom
Religion
Finance
88%
73%
39%
12%9%
97%
77%
31%
14%12%
18 – 22 Years
23 – 27 Years 32 – 37 Years
28 – 32 Years >38 Years

13
The app usage during the dayDuring 18 – 21 PM is the highest usage of apps followed by 12 – 15 PM
169
130
187
235
188
288
221
121
96
142
178
141
219
169
3223
3038
30
4735
00 - 06 06-09 09-12 12-15 15-18 18-21 21-24
Total Apps Multi-Content / Portal Entertainment / Media
Source: GfK Crossmedia Link Indonesia July 2015, App users only n=968
*Total Apps : Total content duration distribution
©GfK 2015 | Mobile Apps Market Study | September 2015
Average duration in minutes per
daytime slot

14
For further information :
William Kusuma
(GXL Commercial Lead Indonesia)
+62 877 8 777 0102


![[Baidu web frontend_conference_2010]_[soso_frontend_architecture]](https://img.dokumen.tips/doc/110x75/556222c8d8b42af6668b49ba/baidu-web-frontendconference2010sosofrontendarchitecture.jpg)


![[Baidu web frontend_conference_2010]_[sina_blog_architecture]](https://img.dokumen.tips/doc/110x75/559cf1251a28ab545a8b4791/baidu-web-frontendconference2010sinablogarchitecture.jpg)