Embed Size (px)
Citation preview

Nov 2011

2
Record crop in 10/11, but 11/12 will be smaller due to cyclical down-turn in Brazil
112.3
125.9
110.1
119.8
110.1
132.3
117.9
137.1
125.3
142.4
133.8
80
90
100
110
120
130
140
150
m. 6
0kg
bag
s
01/02 02/03 03/04 04/05 '05/06 '06/07 07/08 08/09 09/10 10/11 11/12
Crop year
Brazil-10/11 58.2 m. bags, 11/12 46.9 m. bags *- provisional

3
16
18
20
22
24
26
28
30
32
34
36
Jan-08 Apr-08 Jul-08 Oct-08 Jan-09 Apr-09 Jul-09 Oct-09 Jan-10 Apr-10 Jul-10 Oct-10 Jan-11 Apr-11 Jul-11 Oct-11
M g
ree
n b
ag
s
Green Arabicas Soluble Green Robustas
Brazil coffee exports remain at a high level

4
Colombian production is slowly recovering from disasters in 08/09 & 09/10
12.0 12.212.5
8.78.1 8.8
10.1
0
2
4
6
8
10
12
14
m. 6
0kg
bags
'05/06 '06/07 07/08 08/09 09/10 10/11 11/12*
Crop year
* Preliminary

5
Vietnam production remains at a high level, but is expected to fall in 10/11
0
2
4
6
8
10
12
14
16
18
20
22
M. b
ag
s
02/03 03/04 04/05 05/06 06/07 07/08 08/09 09/10 10/11*
* Preliminary.

6
Indonesia production is dipping due to excess rainfall during La Niña
7.07.7
10.0 9.89.1
6.2
0
2
4
6
8
10
12
m. 6
0kg
bags
'06/07 07/08 08/09 09/10 10/11 11/12*
Crop year
* Preliminary. Crop year start in April

7
80
90
100
110
120
130
140
150
160
170
1990 1992 1994 1996 1998 2000 2002 2004 2006 2008 2010 2012 2014 2016 2018 2020
Mill
ion
60
kg
ba
gs
Total Demand
Demand is growing
Projection
1990-2000: 1.3% 2000-10: 2.1% 2010-20: 1.7%

8
40
45
50
55
60
65
70
75
80
85
90
2000 2002 2004 2006 2008 2010 2012 2014 2016 2018 2020
Mill
ion
60
kg
ba
gs
Developed Markets* Emerging Markets
Growth is coming from Emerging Markets
Projection

9
100
110
120
130
140
m. 6
0kg
bags
03/04 04/05 05/06 06/07 07/08 08/09 09/10 10/11 11/12
Coffee Year Production Consumption (Oct-Sep)
Production balanced with demand in last 2 coffee years, surplus develops at end of 11/12

10
-1%
0%
1%
2%
3%
4%
5%
6%
7%
SE Asia Brazil E.Europe
M. East N.America
Japan Other LatAmerica
W.Europe
World
2002-09 2010-20
Total Demand Growth by Regionpe
r ce
nt p
er a
nnum

11
Robusta Demand Growth by Region
-1%
0%
1%
2%
3%
4%
5%
6%
7%
8%
9%
Brazil N. America SE Asia M. East E. Europe W. Europe Japan World
2002-09 2010-20
per
cen
t per
ann
um

12
Natural Demand Growth by Region
-1%
0%
1%
2%
3%
4%
5%
6%
Brazil N. America SE Asia M. East E. Europe W. Europe Japan World
2002-09 2010-20
per
cen
t per
ann
um

13
Robusta share tends to be higher in growing regions
0%
10%
20%
30%
40%
50%
60%
70%
80%
90%
O T H E R AS IA M ID D LE E AS T * E . E UR O P E B R AZ IL O T H E R AF R IC A T O T AL WO R LD W. E UR O P E JAP AN US A+C AN AD A
0.0%
0.5%
1.0%
1.5%
2.0%
2.5%
3.0%
3.5%
4.0%
4.5%
5.0%
Share of Robusta (left) Forecast annual growth of coffee 2010-20 (right)
*- includes India & N. Africa
14
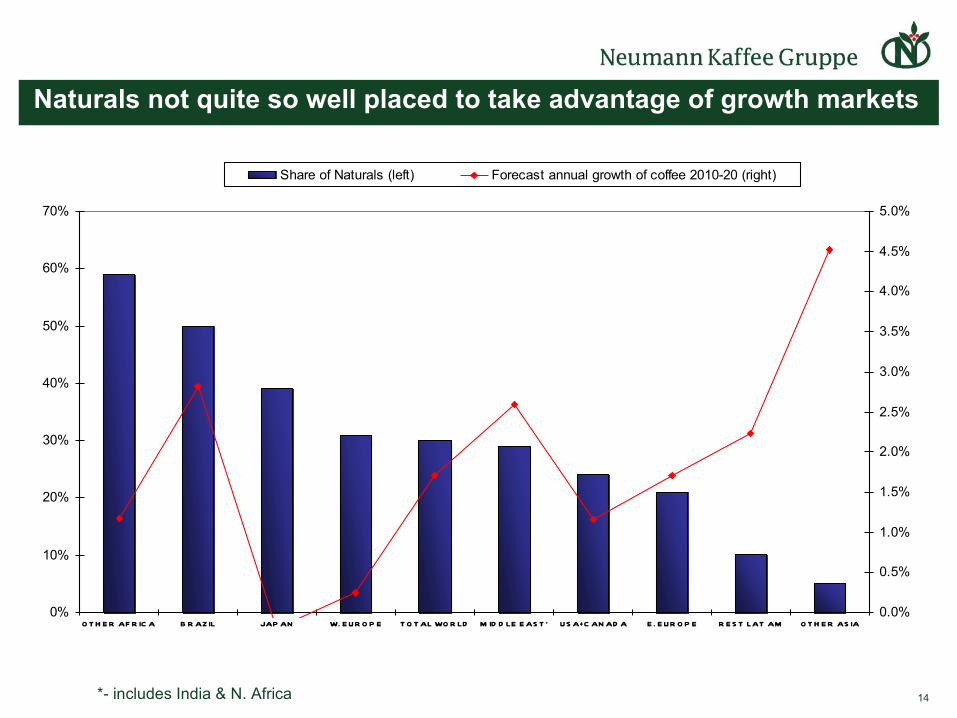
Naturals not quite so well placed to take advantage of growth markets
0%
10%
20%
30%
40%
50%
60%
70%
O T H E R AF R IC A B R AZ IL JAP AN W. E UR O P E T O T AL WO R LD M ID D LE E AS T * US A+C AN AD A E . E UR O P E R E S T LAT AM O T H E R AS IA
0.0%
0.5%
1.0%
1.5%
2.0%
2.5%
3.0%
3.5%
4.0%
4.5%
5.0%
Share of Naturals (left) Forecast annual growth of coffee 2010-20 (right)
*- includes India & N. Africa

15
30
35
40
45
50
55
60
65
70
2000 2002 2004 2006 2008 2010 2012 2014 2016 2018 2020
Mill
ion
60
kg
ba
gs
Robusta Demand
Demand for robusta has also been strong
Projection
2000-10: 3.63% 2010-20: 2.3%

16
Increasing share of Robustas & Naturals in blend in importing countries
33% 32%28% 29% 29% 27% 28% 27% 28%
35%33%
34% 34% 35%34% 34% 37%
30%
0%
10%
20%
30%
40%
50%
60%
70%
2010 2009 2008 2007 2006 2005 2004 2003 2002
NATURALS ROBUSTAS

17
World Blend: Increasing use of Naturals in developed coffee markets of EU
28% 29%
32% 32% 32%33%
32%33% 34%
12%
14%15% 15%
17% 17%
24%25%
22%
10%
12%14%
16%
18%20%
22%24%
26%
28%30%
32%
34%36%
38%
2002 2003 2004 2005 2006 2007 2008 2009 2010
Robustas in EU15 Naturals in EU12

18
Arabica share tends to be higher in developed countries
0
10,000
20,000
30,000
40,000
50,000
60,000
Finland Australia USA Germany Japan S Korea Poland Russia China
GD
P p
er C
ap
ita
in c
urr
en
t US
$
0%
10%
20%
30%
40%
50%
60%
70%
80%
90%
100%
GDP/Cap Share of Arabica
Shares based on green imports 2005-07

19
y = 0.2406Ln(x) - 1.8445
R2 = 0.7339
0%
10%
20%
30%
40%
50%
60%
70%
80%
90%
100%
0 10,000 20,000 30,000 40,000 50,000 60,000 70,000 80,000 90,000 100,000
GDP per capita in current US$
Sh
are
of
Ara
bic
a
The Changing Blend: As income increases the share of arabica increases.Finland

20
0
200
400
600
800
1,000
1,200
1,400
1,600
1,800
2,000
2,200
2,400
2,600
00
0 b
ag
s
2003 2004 2005 2006 2007 2008 2009 2010 2011*
Sales of R.A. Coffee
Rainforest Alliance has highest sales growth
Average growth rate of 51% p.a since 2005
*- Projection

21
0
200
400
600
800
1,000
1,200
1,400
1,600
1,800
00
0 b
ag
s
2006 2007 2008 2009 2010*
Utz Certified Sales
Utz sales growth is averaging 39% per annum
*- Projection

22
-20-10
0102030405060708090
100
Jan-09
Mar-09
May-09
Jul-09
Sep-09
Nov-09
Jan-10
Mar-10
May-10
Jul-10
Sep-10
Nov-10
Jan-11
Mar-11
May-11
Jul-11
Sep-11
US ce
nts /
lb
Colombian Privates Honduras HG Costa Rica HB
Mild differentials have been almost as volatile as futures prices
Basis FOB Prompt Shipment

23
0
10
20
30
40
50
60
Jan-09
Mar-09
May-09
Jul-09
Sep-09
Nov-09
Jan-10
Mar-10
May-10
Jul-10
Sep-10
Nov-10
Jan-11
Mar-11
May-11
Jul-11
Sep-11
Nov-11
US ce
nts /
lb
Arb Honduras HG FOB diff minus Brazil FOB diff
And apparent loss of Brazil competitiveness
Basis FOB Prompt Shipment

24
ICE Stocks are at an extremely levels
0.0
1.0
2.0
3.0
4.0
5.0
6.0
J an-0 4
J ul -0 4
J an-0 5
J ul -0 5
J an-0 6
J ul-0 6
J an-0 7
J ul -0 7
J an-0 8
J ul -0 8
J an-0 9
J ul -0 9
J an-10
J ul -10
J an-11
J ul-11
m. b
ags
In EuropeIn the USA
To End Oct 2011

25
LIFFE Certified stocks have started to increase in 2011
0.00.51.01.52.02.53.03.54.04.55.05.56.06.57.0
D ec -0 7
M ar-0 8
J un-0 8
S ep -0 8
D ec -0 8
M ar-0 9
J un-0 9
S ep -0 9
D ec -0 9
M ar-10
J un-10
S ep -10
D ec -10
M ar-11
J un-11
S ep -11
m. b
ags
To End Oct 2011