Embed Size (px)
Citation preview
�
BT12 Concurrent�Session�11/14/2013�3:45�PM�
�����
"Measure Customer and Business Feedback to Drive
Improvement" ���
Presented by:
Paul Fratellone uTest
������
Brought�to�you�by:��
��
340�Corporate�Way,�Suite�300,�Orange�Park,�FL�32073�888Ͳ268Ͳ8770�ͼ�904Ͳ278Ͳ0524�ͼ�[email protected]�ͼ�www.sqe.com
Paul Fratellone uTest
Paul Fratellone’s career in quality assurance and testing began in the mid-1980s and has spanned multiple industries and domains. Through the years, Paul has recognized certain patterns and pain points which all organizations need to deal with. Building a business case for justifying investments in quality and testing has enabled organizations to not only measure success but continually improve. Paul’s perspective and passion are clearly rooted in ensuring teams provide value to the business and ultimately to end users. Knowing what is important to the customer is how Paul has quantitatively articulated the cost-risk-benefit equation of quality to business owners and IT management.
9/10/13
1
|
Measure Customer and Business Feedback to Drive Improvement Presented by Paul Fratellone November 2013
|
Session Name: B12 Metrics
9/10/13
2
|
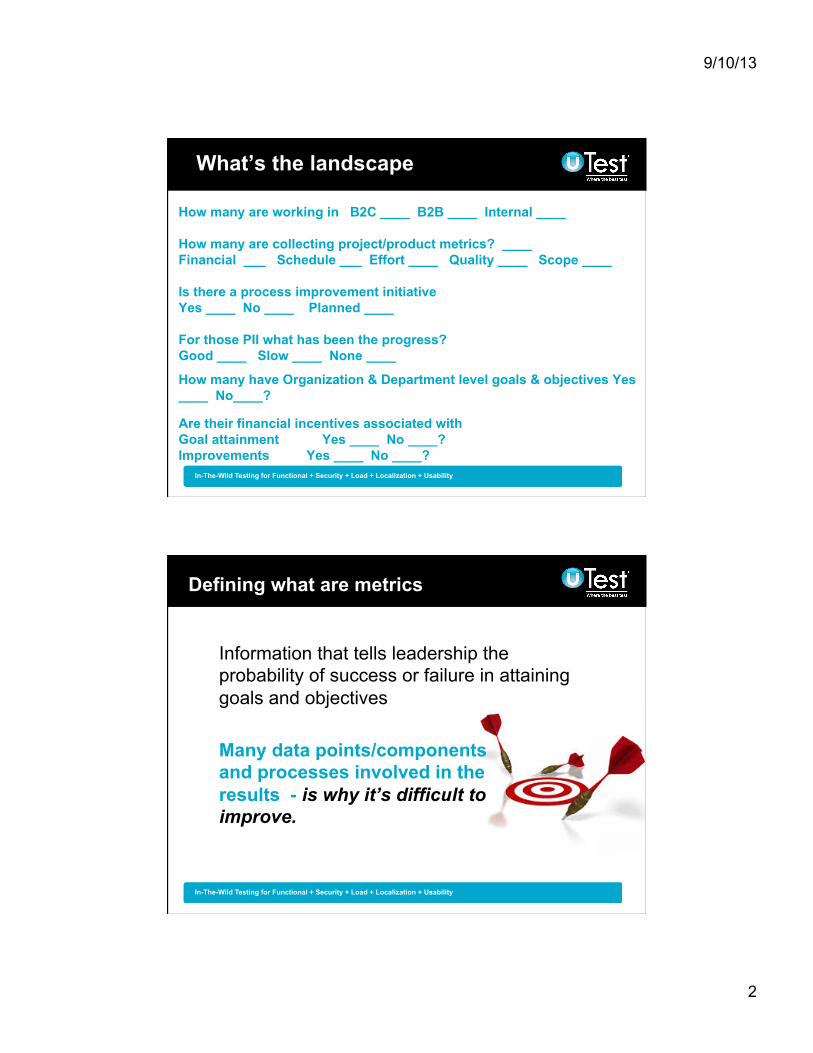
What’s the landscape
How many are working in B2C ____ B2B ____ Internal ____
How many are collecting project/product metrics? ____ Financial ___ Schedule ___ Effort ____ Quality ____ Scope ____
Is there a process improvement initiative Yes ____ No ____ Planned ____
For those PII what has been the progress? Good ____ Slow ____ None ____
How many have Organization & Department level goals & objectives Yes ____ No____?
Are their financial incentives associated with Goal attainment Yes ____ No ____? Improvements Yes ____ No ____?
|
Defining what are metrics
Many data points/components and processes involved in the results - is why it’s difficult to improve.
Information that tells leadership the probability of success or failure in attaining goals and objectives
9/10/13
3
|
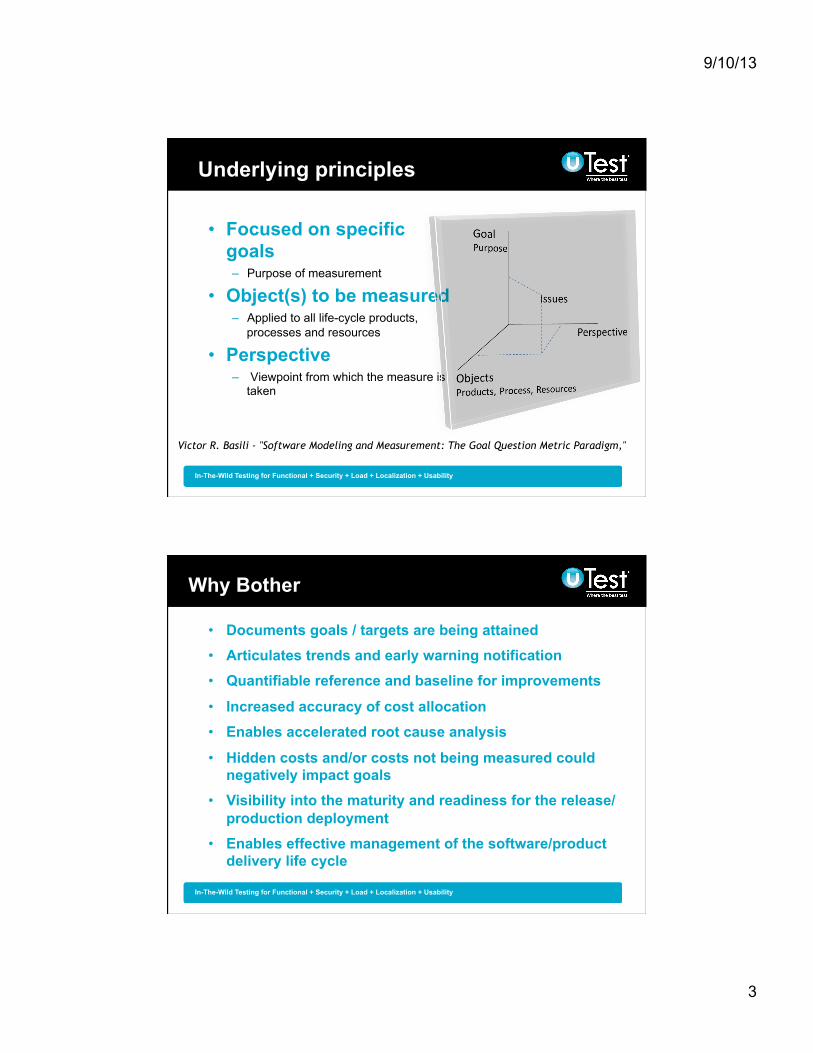
• Focused on specific goals – Purpose of measurement
• Object(s) to be measured – Applied to all life-cycle products,
processes and resources
• Perspective – Viewpoint from which the measure is
taken
Underlying principles
Victor R. Basili - "Software Modeling and Measurement: The Goal Question Metric Paradigm,"
|
Why Bother
• Documents goals / targets are being attained • Articulates trends and early warning notification • Quantifiable reference and baseline for improvements
• Increased accuracy of cost allocation • Enables accelerated root cause analysis
• Hidden costs and/or costs not being measured could negatively impact goals
• Visibility into the maturity and readiness for the release/production deployment
• Enables effective management of the software/product delivery life cycle
9/10/13
4
|
Roadblocks to Actions/Improvements
• Organizational Corporate – Non existent / cascading goals
– No incentive to change
– Uncertain market conditions
– Management indecision
• Operational Layers – Insufficient / Inaccurate data
– No analytics/intelligence data
– Poor planning/estimating models
– Unreliable historical data
|
All too true for some organizations
9/10/13
5
|
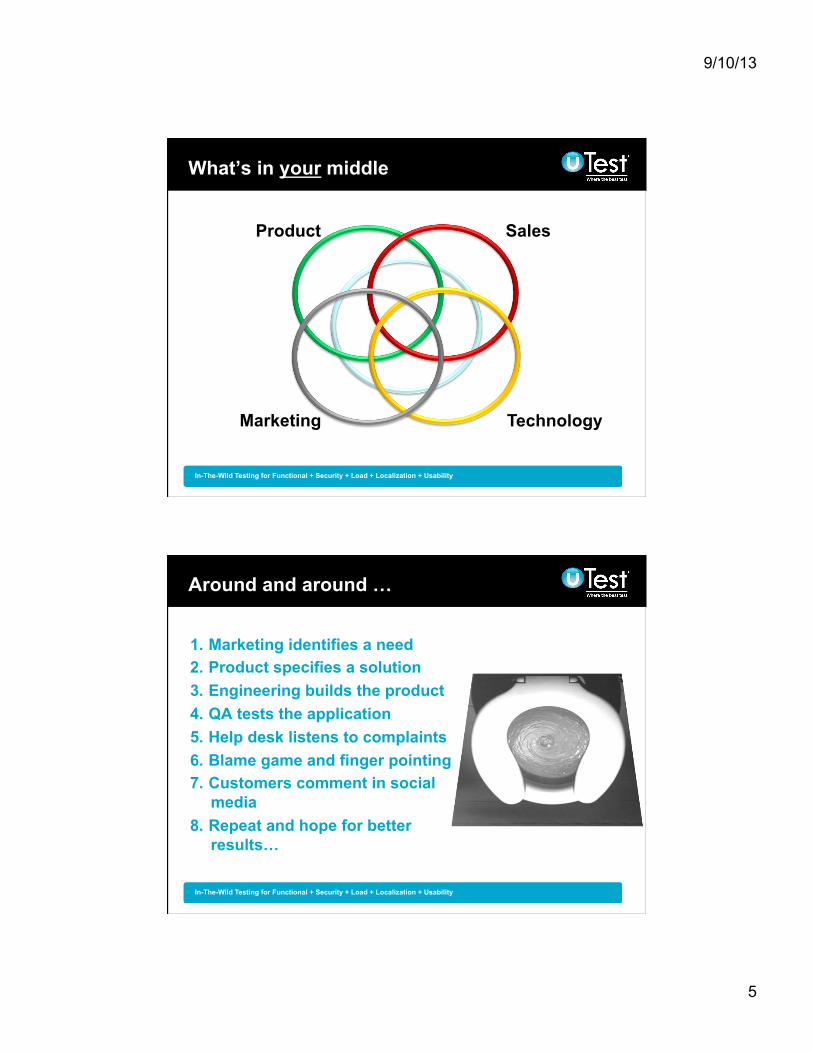
What’s in your middle
Product Sales
Marketing Technology
|
Around and around …
1. Marketing identifies a need 2. Product specifies a solution 3. Engineering builds the product 4. QA tests the application 5. Help desk listens to complaints 6. Blame game and finger pointing 7. Customers comment in social
media 8. Repeat and hope for better
results…
9/10/13
6
|
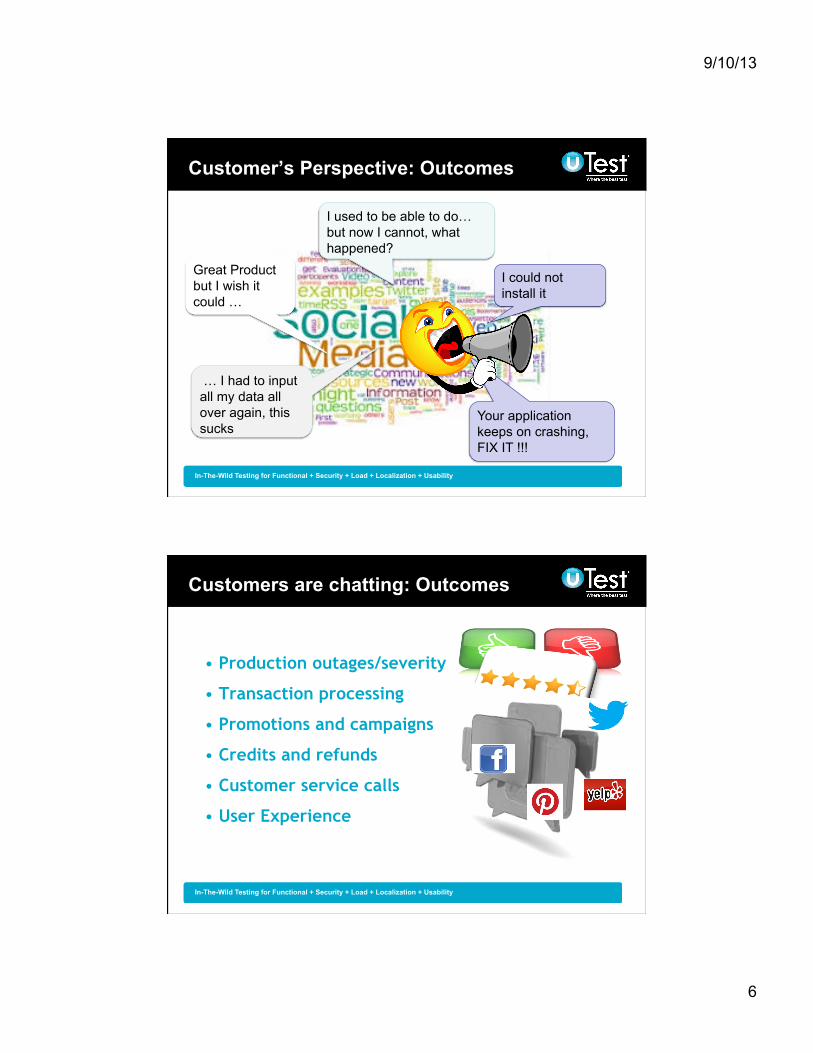
Customer’s Perspective: Outcomes
Great Product but I wish it could …
I used to be able to do… but now I cannot, what happened?
I could not install it
Your application keeps on crashing, FIX IT !!!
… I had to input all my data all over again, this sucks
|
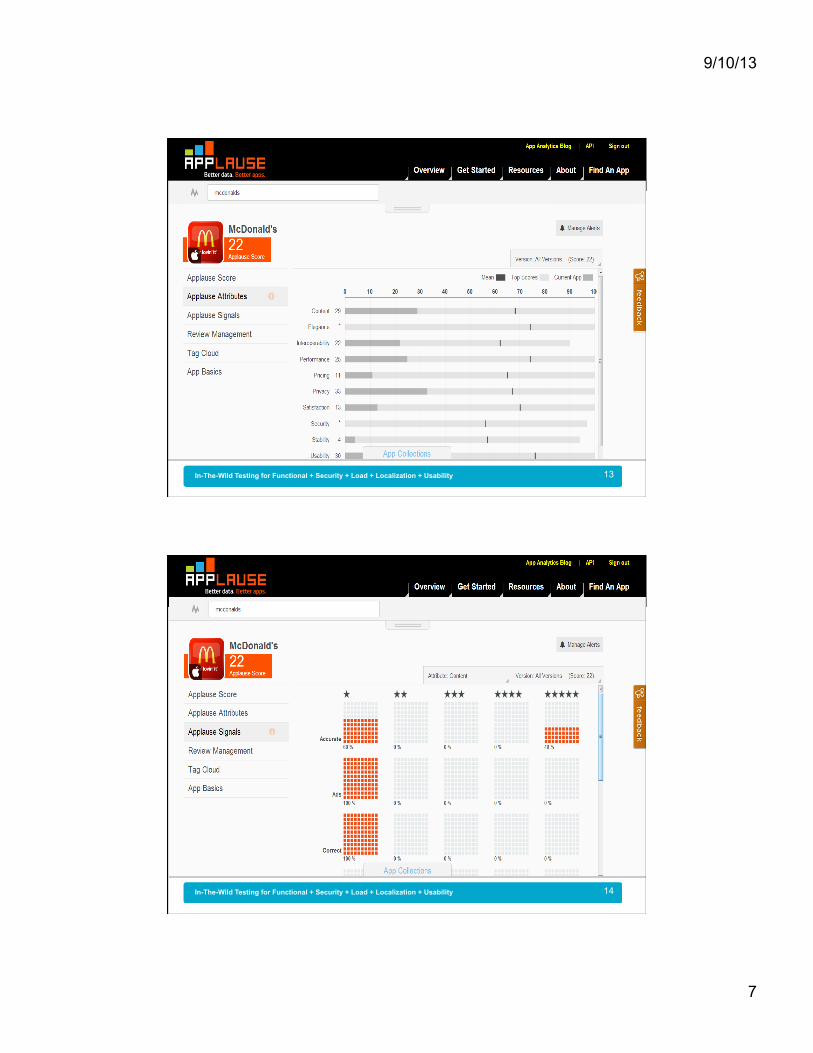
Customers are chatting: Outcomes
• Production outages/severity
• Transaction processing
• Promotions and campaigns
• Credits and refunds
• Customer service calls
• User Experience
9/10/13
7
| 13
| 14
9/10/13
8
|
What’s needed to action change
Social media negative reviews What when wrong …
Risk & Impact to business goals What was being measured (needs to be) What warning signals need to be in place What processes are involved in the
delivery of the results Base Line / Benchmarks
Articulate the changes / Improvements State the target (measurable) improvement
Measure results – Comparisons Success Attainment – Course Corrections
|
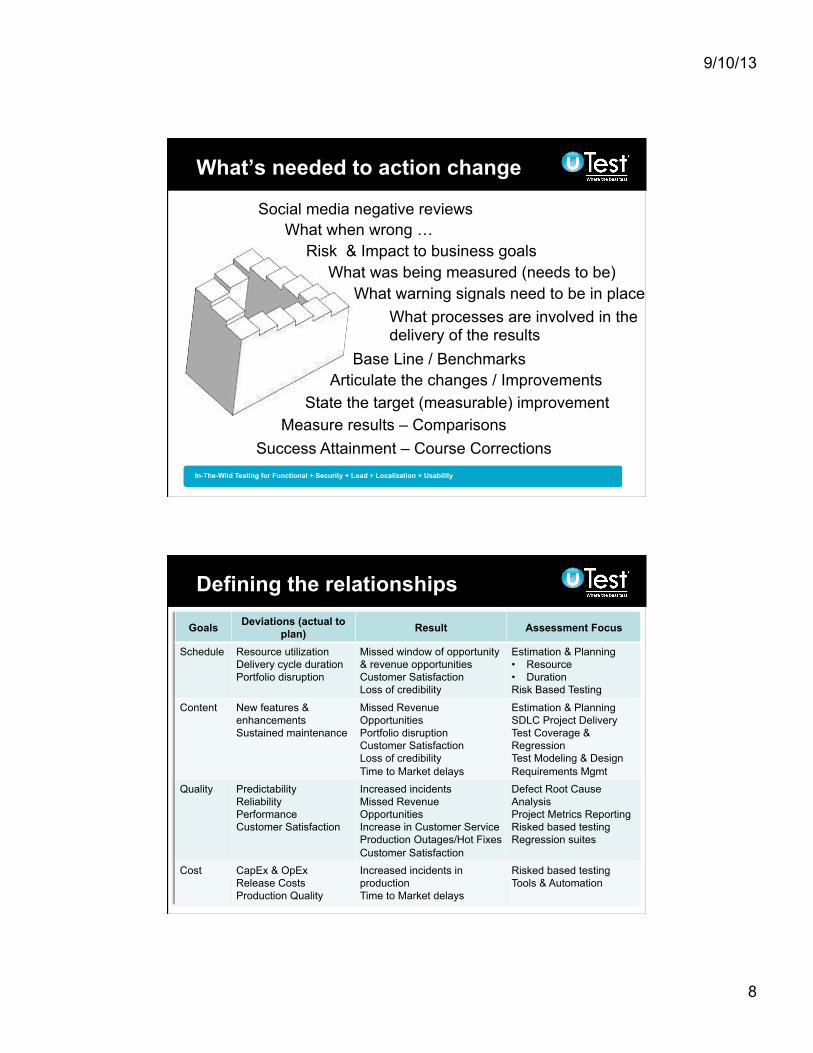
Defining the relationships
Goals Deviations (actual to plan) Result Assessment Focus
Schedule Resource utilization Delivery cycle duration Portfolio disruption
Missed window of opportunity & revenue opportunities Customer Satisfaction Loss of credibility
Estimation & Planning • Resource • Duration Risk Based Testing
Content New features & enhancements Sustained maintenance
Missed Revenue Opportunities Portfolio disruption Customer Satisfaction Loss of credibility Time to Market delays
Estimation & Planning SDLC Project Delivery Test Coverage & Regression Test Modeling & Design Requirements Mgmt
Quality Predictability Reliability Performance Customer Satisfaction
Increased incidents Missed Revenue Opportunities Increase in Customer Service Production Outages/Hot Fixes Customer Satisfaction
Defect Root Cause Analysis Project Metrics Reporting Risked based testing Regression suites
Cost CapEx & OpEx Release Costs Production Quality
Increased incidents in production Time to Market delays
Risked based testing Tools & Automation
9/10/13
9
|
Models & Estimating
Estimating The process of forecasting or approximating the time and cost (effort) of completing activities i.e. deliverables.
Contingencies (buffers) Are created to offset uncertainty; reduce the likelihood of…
|
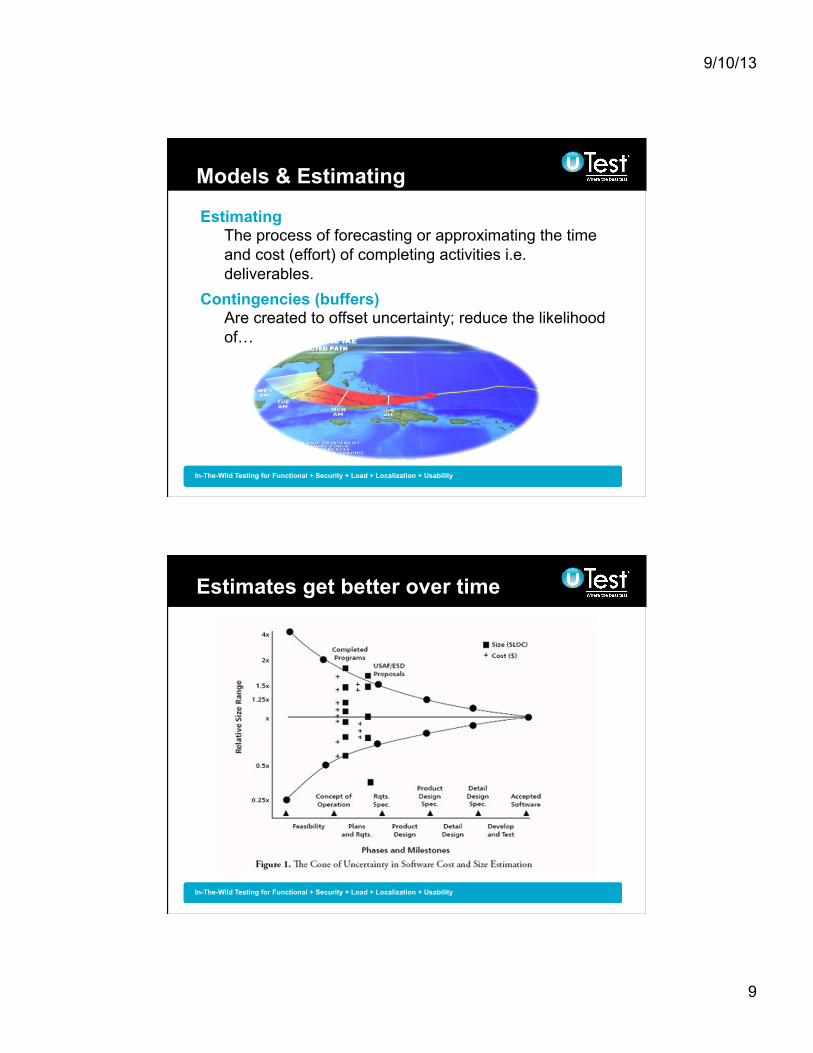
Estimates get better over time
9/10/13
10
|
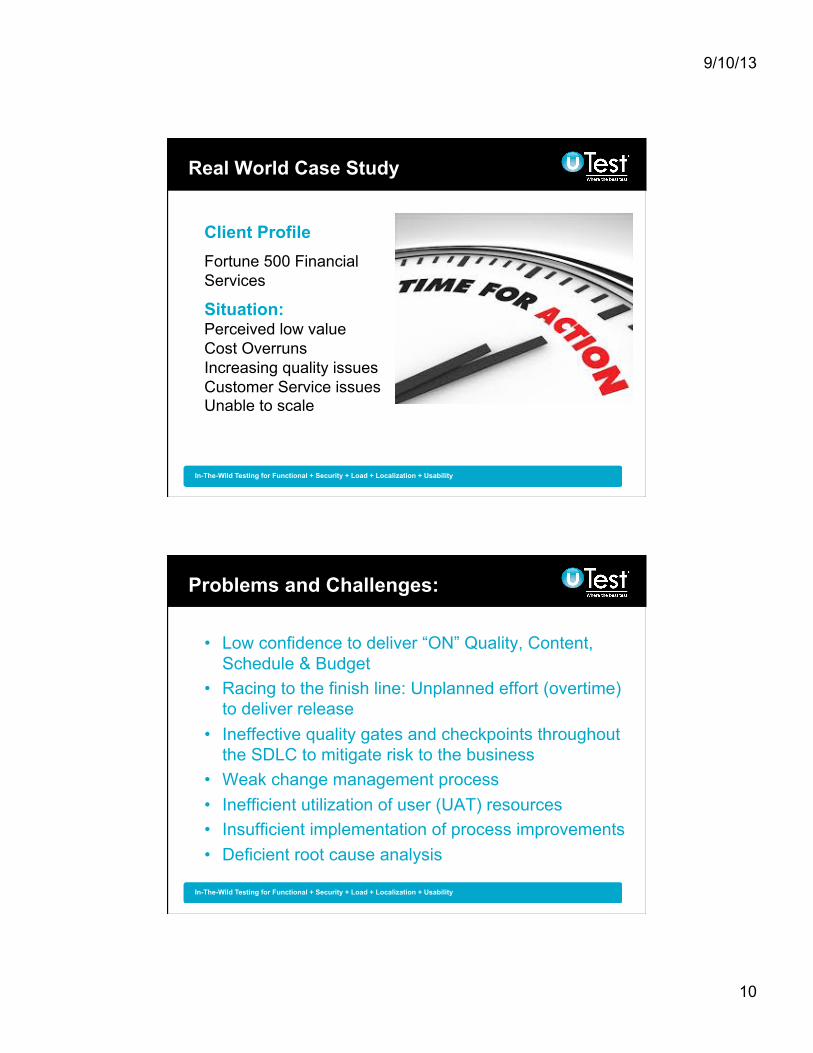
Real World Case Study
Client Profile
Fortune 500 Financial Services
Situation: Perceived low value Cost Overruns Increasing quality issues Customer Service issues Unable to scale
|
Problems and Challenges:
• Low confidence to deliver “ON” Quality, Content, Schedule & Budget
• Racing to the finish line: Unplanned effort (overtime) to deliver release
• Ineffective quality gates and checkpoints throughout the SDLC to mitigate risk to the business
• Weak change management process • Inefficient utilization of user (UAT) resources • Insufficient implementation of process improvements • Deficient root cause analysis
9/10/13
11
|
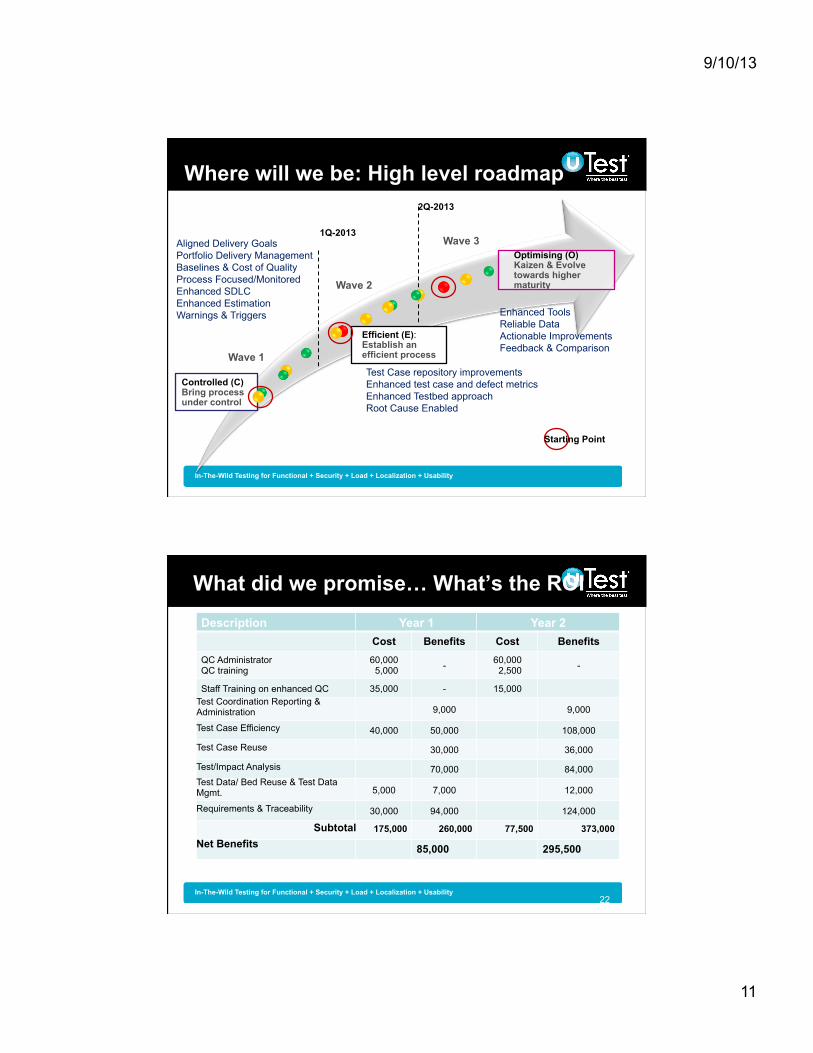
Where will we be: High level roadmap
Controlled (C) Bring process under control
Efficient (E): Establish an efficient process
Optimising (O) Kaizen & Evolve towards higher maturity
Wave 1
Wave 2
1Q-2013
2Q-2013
Aligned Delivery Goals Portfolio Delivery Management Baselines & Cost of Quality Process Focused/Monitored Enhanced SDLC Enhanced Estimation Warnings & Triggers
Test Case repository improvements Enhanced test case and defect metrics Enhanced Testbed approach Root Cause Enabled
Wave 3
Enhanced Tools Reliable Data Actionable Improvements Feedback & Comparison
Starting Point
|
What did we promise… What’s the ROI
22
Description Year 1 Year 2 Cost Benefits Cost Benefits
QC Administrator QC training
60,000 5,000 - 60,000
2,500 -
Staff Training on enhanced QC 35,000 - 15,000 Test Coordination Reporting & Administration 9,000 9,000
Test Case Efficiency 40,000 50,000 108,000
Test Case Reuse 30,000 36,000
Test/Impact Analysis 70,000 84,000 Test Data/ Bed Reuse & Test Data Mgmt. 5,000 7,000 12,000
Requirements & Traceability 30,000 94,000 124,000
Subtotal 175,000 260,000 77,500 373,000 Net Benefits 85,000 295,500
9/10/13
12
|
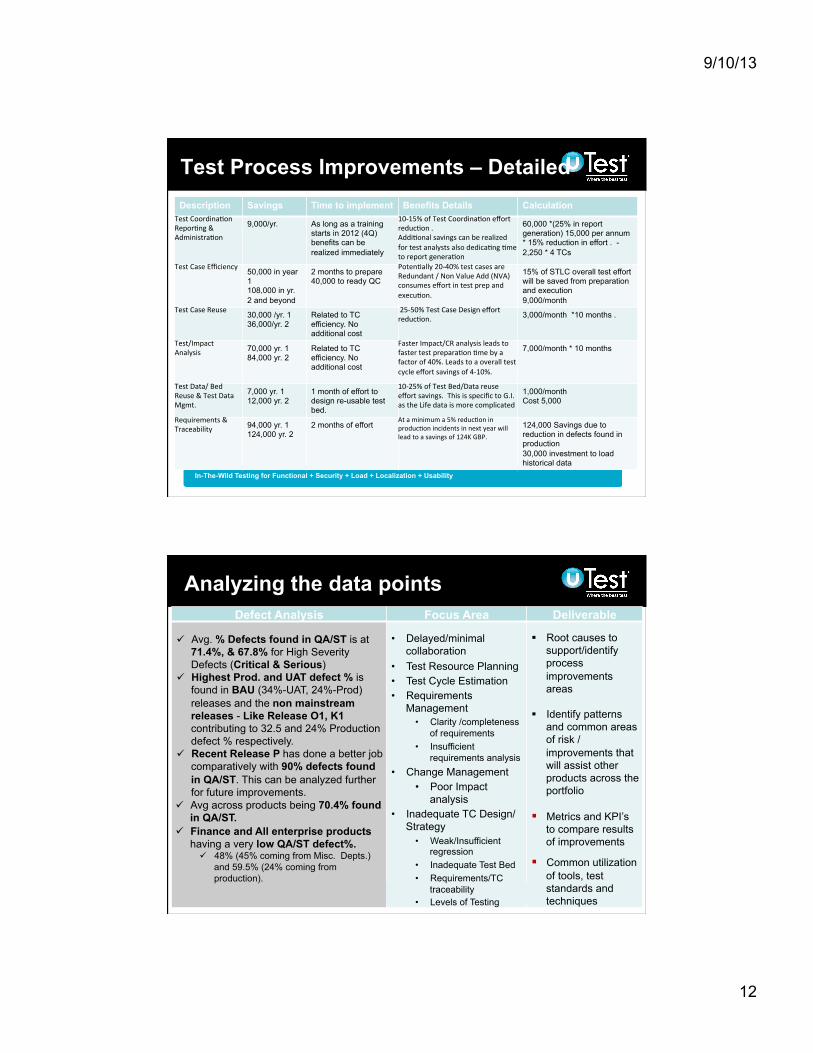
Test Process Improvements – Detailed Description Savings Time to implement Benefits Details Calculation
Test%Coordina-on%Repor-ng%&%Administra-on%
9,000/yr. As long as a training starts in 2012 (4Q) benefits can be realized immediately
10615%%of%Test%Coordina-on%effort%reduc-on%.%Addi-onal%savings%can%be%realized%for%test%analysts%also%dedica-ng%-me%to%report%genera-on%
60,000 *(25% in report generation) 15,000 per annum * 15% reduction in effort . - 2,250 * 4 TCs
Test%Case%Efficiency% 50,000 in year 1 108,000 in yr. 2 and beyond
2 months to prepare 40,000 to ready QC
Poten-ally%20640%%test%cases%are%Redundant%/%Non%Value%Add%(NVA)%consumes%effort%in%test%prep%and%execu-on.%
15% of STLC overall test effort will be saved from preparation and execution 9,000/month
Test%Case%Reuse% 30,000 /yr. 1 36,000/yr. 2
Related to TC efficiency. No additional cost
%25650%%Test%Case%Design%effort%reduc-on.%%
3,000/month *10 months .
Test/Impact%%Analysis% 70,000 yr. 1
84,000 yr. 2 Related to TC efficiency. No additional cost
Faster%Impact/CR%analysis%leads%to%faster%test%prepara-on%-me%by%a%factor%of%40%.%Leads%to%a%overall%test%cycle%effort%savings%of%4610%.%
7,000/month * 10 months
Test%Data/%Bed%Reuse%&%Test%Data%Mgmt.%
7,000 yr. 1 12,000 yr. 2
1 month of effort to design re-usable test bed.
10625%%of%Test%Bed/Data%reuse%effort%savings.%%This%is%specific%to%G.I.%as%the%Life%data%is%more%complicated%%
1,000/month Cost 5,000
Requirements%&%Traceability%% 94,000 yr. 1
124,000 yr. 2 2 months of effort
At%a%minimum%a%5%%reduc-on%in%produc-on%incidents%in%next%year%will%lead%to%a%savings%of%124K%GBP.%
124,000 Savings due to reduction in defects found in production 30,000 investment to load historical data
|
Analyzing the data points Defect Analysis Focus Area Deliverable
• Delayed/minimal collaboration
• Test Resource Planning • Test Cycle Estimation • Requirements
Management • Clarity /completeness
of requirements • Insufficient
requirements analysis • Change Management
• Poor Impact analysis
• Inadequate TC Design/Strategy
• Weak/Insufficient regression
• Inadequate Test Bed • Requirements/TC
traceability • Levels of Testing
! Root causes to
support/identify process improvements areas
! Identify patterns
and common areas of risk /improvements that will assist other products across the portfolio
! Metrics and KPI’s to compare results of improvements
! Common utilization of tools, test standards and techniques
" Avg. % Defects found in QA/ST is at 71.4%, & 67.8% for High Severity Defects (Critical & Serious)
" Highest Prod. and UAT defect % is found in BAU (34%-UAT, 24%-Prod) releases and the non mainstream releases - Like Release O1, K1 contributing to 32.5 and 24% Production defect % respectively.
" Recent Release P has done a better job comparatively with 90% defects found in QA/ST. This can be analyzed further for future improvements.
" Avg across products being 70.4% found in QA/ST.
" Finance and All enterprise products having a very low QA/ST defect%. " 48% (45% coming from Misc. Depts.)
and 59.5% (24% coming from production).
9/10/13
13
|
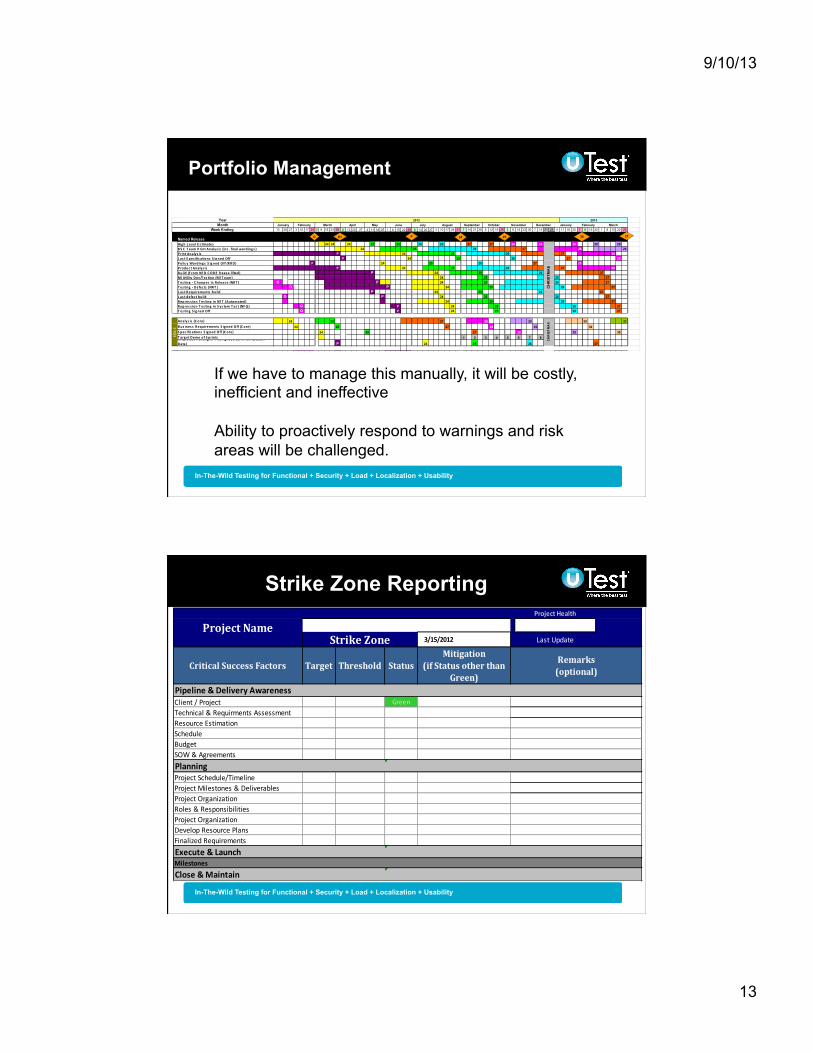
Portfolio Management
13 20 27 3 10 17 24 2 9 16 23 30 6 13 20 27 4 11 18 25 1 8 15 22 29 6 13 20 27 3 10 17 24 31 7 14 21 28 5 12 19 26 2 9 16 23 30 7 14 21 28 4 11 18 25 1 8 15 22 1 8 15 22 29
Hig h%L evel%E s timates % 24 24 24 25 25 26 26 27 27 28 28 28 29 29B S C %T eam%P rint%Analys is %(inc .%final%wording s ) 24 25 26 27 28 29P rint%Analys is P 24 25 26 27 28L as t%S pec ific ations %S ig ned%Off P 24 25 26 27 28Polic y %Wording s %S ig ned%Off%(RRD) P 24 25 26 27 28P roduc t%Analys is P 24 25 26 27 28B uild%(F rom%NF D%C ODE %freeze%lifted) P 24 25 26 27MI%Utility %Dev/T es ting %(MI%T eam) 24 25 26 27T es ting %M%C hang es %in%Releas e%(NRT ) O P 24 25 26 27T es ting %M%Defec ts %(NRT ) O P 24 25 26 27L as t%Requirements %B uild P 24 25 26 27L as t%defec t%build O P 24 25 26 27Reg res s ion%T es ting %in%NF T %(Automated) 24 25 26 27Reg res s ion%T es ting %in%S ys tem%T es t%(NFQ) O P 24 25 26 27T es ting %S ig ned%Off O P 24 25 26 27
Analys is %(C ore) 24 25 27 28 29 30 31B us ines s %Requirements %S ig ned%Off%(C ore) 24 25 27 28 29 30S pec ific ations %S ig ned%Off%(C ore) 24 25 27 28 29 30T arg et%Demo%of%S prints 1 2 3 4 5 6 7 8C R/Defec t%T es ting %in%T H1%Ag reed%by%NFUM%(L ates t%Date) P 24 25 26 27
CH
RIS
TMA
S
SDLC
CH
RIS
TMA
S
MarchWeek Ending
Named Release
July August September October November DecemberJanuary February March April May January FebruaryJune2013
MonthYear 2012
O P 24 26O1 25 27
If we have to manage this manually, it will be costly, inefficient and ineffective Ability to proactively respond to warnings and risk areas will be challenged.
|
Strike Zone Reporting Project(Health
Client'/'Project' GreenTechnical'&'Requirments'AssessmentResource'EstimationScheduleBudgetSOW'&'Agreements
#REF!
Project'Schedule/TimelineProject'Milestones'&'DeliverablesProject'OrganizationRoles'&'ResponsibilitiesProject'OrganizationDevelop'Resource'PlansFinalized'Requirements
#REF!
#REF!
Last'Update
Target Threshold
Strike/Zone
Milestones(Execute(&(Launch
Close(&(Maintain(
Planning
Pipeline(&(Delivery(Awareness
3/15/2012
Critical/Success/Factors
Project/Name
StatusMitigation
(if/Status/other/than/Green)
Remarks(optional)
9/10/13
14
|
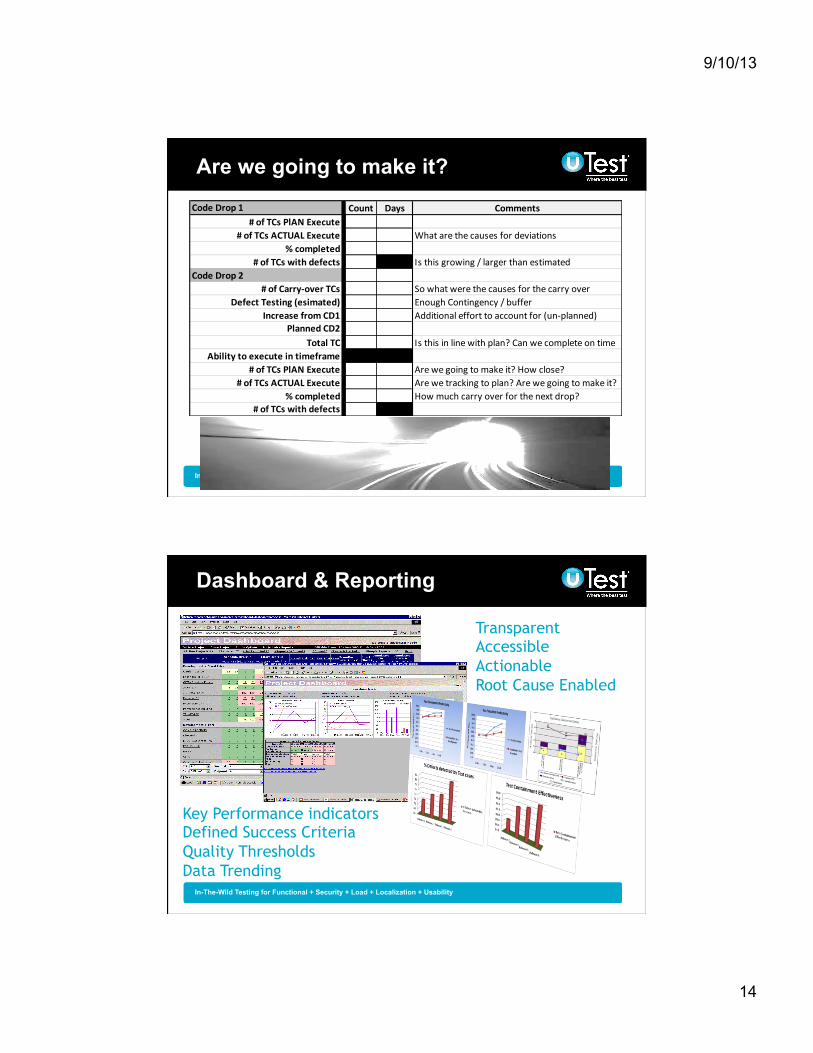
Are we going to make it?
Code%Drop%1 Count Days Comments#%of%TCs%PlAN%Execute
#%of%TCs%ACTUAL%Execute What%are%the%causes%for%deviations%%completed
#%of%TCs%with%defects Is%this%growing%/%larger%than%estimatedCode%Drop%2
#%of%CarryBover%TCs So%what%were%the%causes%for%the%carry%overDefect%Testing%(esimated)% Enough%Contingency%/%buffer
Increase%from%CD1 Additional%effort%to%account%for%(un>planned)Planned%CD2%
Total%TC Is%this%in%line%with%plan?%Can%we%complete%on%timeAbility%to%execute%in%timeframe
#%of%TCs%PlAN%Execute Are%we%going%to%make%it?%How%close?#%of%TCs%ACTUAL%Execute Are%we%tracking%to%plan?%Are%we%going%to%make%it?
%%completed How%much%carry%over%for%the%next%drop?#%of%TCs%with%defects
|
Dashboard & Reporting
Transparent
Accessible
Actionable
Root Cause Enabled
Key Performance indicators
Defined Success Criteria
Quality Thresholds
Data Trending
9/10/13
15
|
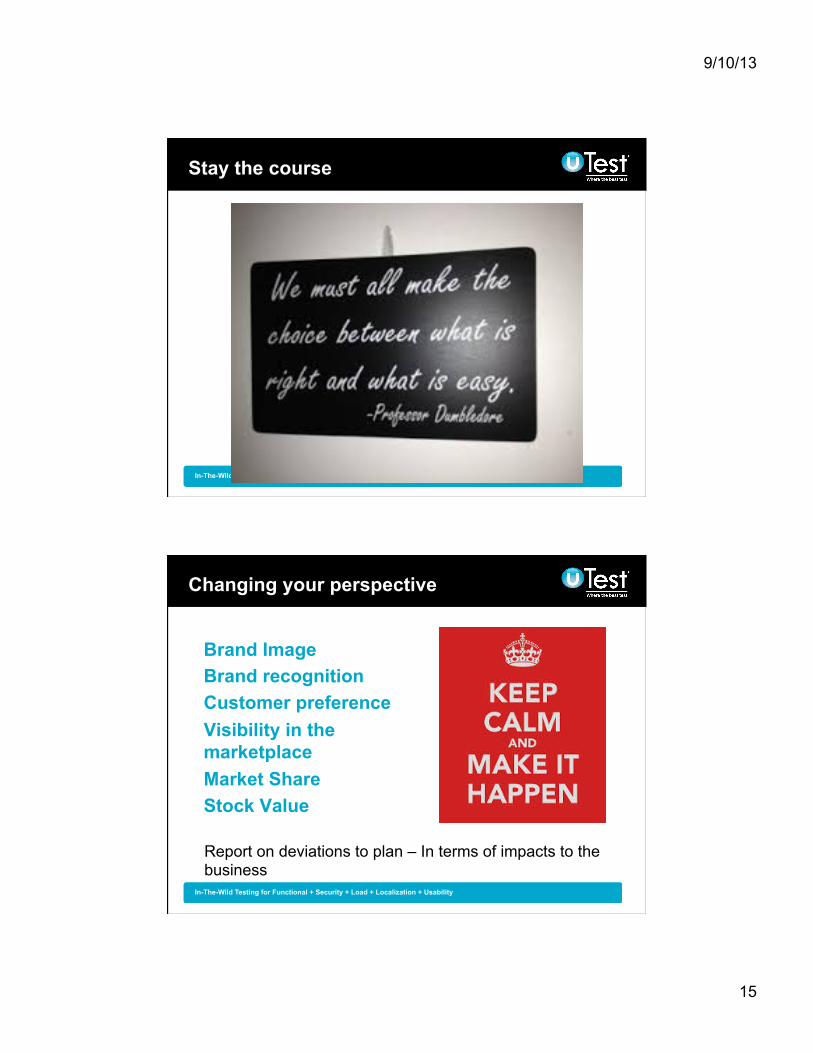
Stay the course
|
Changing your perspective
Brand Image Brand recognition Customer preference Visibility in the marketplace Market Share Stock Value Report on deviations to plan – In terms of impacts to the business
9/10/13
16
|
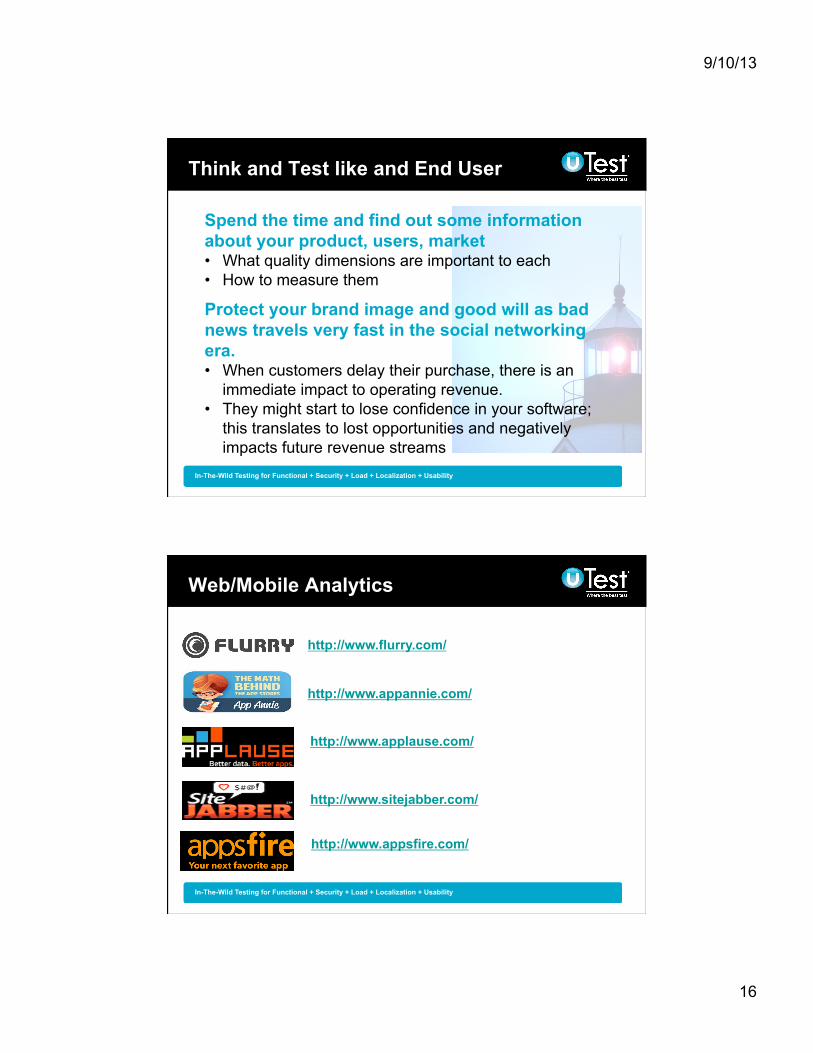
Think and Test like and End User
Spend the time and find out some information about your product, users, market • What quality dimensions are important to each • How to measure them
Protect your brand image and good will as bad news travels very fast in the social networking era. • When customers delay their purchase, there is an
immediate impact to operating revenue. • They might start to lose confidence in your software;
this translates to lost opportunities and negatively impacts future revenue streams
|
Web/Mobile Analytics
http://www.flurry.com/
http://www.appsfire.com/
http://www.sitejabber.com/
http://www.appannie.com/
http://www.applause.com/
9/10/13
17
|
Thanks for Attending
Please fill out an evaluation form and drop it in the collection basket located at the back of the
room.
|
Contact Information
Paul Fratellone, Test Evangelist uTest Inc. HQ: Framingham, MA 01772 Voice +1 570.269.5342 email: [email protected] www.utest.com