Embed Size (px)
Citation preview
C o m m u n i t y E x p e r i e n c e D i s t i l l e d
Use PyCharm with fl uid effi ciency
Mastering PyCharm
Quazi N
afi ul Islam
Mastering PyCharm
PyCharm is addictive with powerful and confi gurable code completion, superb editing tools, top-notch support, diverse plugins, and a vibrant ecosystem to boot. Learning how PyCharm works and maximizing the synergy of its powerful tools will help you to rapidly develop applications.
You will start by getting comfortable with PyCharm and making it look exactly how you want. You can customize the tools and taskbars to suit individual developers' coding styles. You will understand the inner workings of PyCharm and how plugins, such as Codemap, Vim, Bitbucket, Assets compressor, Markdown, bash fi le, shortcut translator, and .gitignore, leverage the power of the IntelliJ Platform.
You will take an in-depth look at the various tools in PyCharm, improving your workfl ow drastically. Packed with insider tricks, this book will help you boost productivity with PyCharm.
Who this book is written forIf you know PyCharm but want to understand it better and leverage its more powerful but less obvious toolset, this is the book for you.
$ 44.99 US£ 28.99 UK
Prices do not include local sales tax or VAT where applicable
Quazi Nafi ul IslamVisit www.PacktPub.com for books, eBooks,
code, downloads, and PacktLib.
What you will learn from this book
Understand the internal workings of the IntelliJ Platform
Leverage PyCharm's powerful search tools and learn which ones are the best for you and your workfl ow
Customize PyCharm's enhanced Python interpreter and its built-in terminal
Develop web applications quickly and easily with different frameworks such as Flask and Django
Understand how code completion works in PyCharm for Python and JavaScript
Mastering PyC
harm"CommunityExperienceDistilled"
Free Sample
In this package, you will find: The author biography
A preview chapter from the book, Chapter 6 'Debugging'
A synopsis of the book’s content
More information on Mastering PyCharm
About the Author
Quazi Nafi ul Islam is a consultant and an occasional speaker, and has worked professionally with Python for 3 years while completing his bachelor's degree in computer science. He blogs regularly on his website, nafiulis.me.
He struggled to fi nd the right tools that could aid his workfl ow when working on large Python projects until he was introduced to PyCharm. He loved it so much that he wrote a book on it, his very fi rst one.
PrefaceTLDR: So you want more PyCharm productivity, but don't want to read a book. I get that! So, just head over to the main menu, go over to Help and then Productivity Guide. If you want to get down to the best tools, read Chapter 4, Editing, Chapter 5, Interpreters and Consoles, and Chapter 6, Debugging. However, if you read this book, you'll get a lot more.
Welcome to Mastering PyCharm. If you've bought this book, then you probably want to become more effective with PyCharm in your day-to-day work. However, whether you can truly master a tool as multifaceted as PyCharm is completely up for debate since PyCharm changes so fast and so quickly. However, what I can promise you is that you will learn a great deal not only about how to use PyCharm, but how PyCharm works as part of the IntelliJ ecosystem of IDEs and what that means in terms of tooling and extensibility.
What this book coversChapter 1, Getting the Right Look, will help you make PyCharm look the exact way you want it to. So, whether you want too many buttons or too few or you want to change the theme or modify it more effectively, PyCharm will help you do all these.
Chapter 2, Understanding the Keymap, will help you map all the actions to their shortcuts and search for the actions using the action name or by invoking the shortcut. If that doesn't make sense, it means you've been missing out on something. This chapter also covers how to overcome known problems with keyboard shortcuts.
Chapter 3, Getting Places, covers a host of tools that PyCharm has. These tools will help you navigate everything from a really large fi le to huge codebases with loads of packages.
Chapter 4, Editing, will explain all the tools and help you learn more about writing error-free code quickly.

Preface
Chapter 5, Interpreters and Consoles, covers a lot of interpreters that Python has. PyCharm can support a whole host of them and provide code completion inside the console and much more. If you don't read this chapter, you're really going to miss out on some of the most powerful tools PyCharm has to offer.
Chapter 6, Debugging, being an iterative chapter, covers how to incorporate PyCharm's powerful debugger in to your debugging workfl ow. Buckle up; this one's going to get greasy.
Chapter 7, The PyCharm Ecosystem, answers PyCharm's existential questions. Who makes it? How does it work? How do you extend it? Where do plugins come from? Oh, and a lot more.
Chapter 8, File Templates and Snippets, covers the powerful set of snippets and fi le templates that PyCharm has. This will help you pump out code as fast as you can hit Tab. This chapter also talks about how to make your own fi le templates and snippets and extend the ones that already exist, using the velocity templating language. After all, don't you hate writing the same stuff all over again, such as getters and setters or function declarations?
Chapter 9, Version Control Integration, is a short chapter on some of the good parts of PyCharm's version control features that support multiple version control systems.
Chapter 10, HTML and JavaScript Tools, covers a set of tools that PyCharm comes with, which will help you work with JavaScript effi ciently. JavaScript is (unfortunately) everywhere!
Chapter 11, Web Development with PyCharm, talks about picking a web framework, any framework. Chances are that PyCharm supports it as well as the tools that support those frameworks such as SQLAlchemy and templating languages such as Jinja2 and Mako.
[ 101 ]
Debugging"There is no freedom quite like the freedom of being constantly underestimated."
– Scott Lynch
When I fi rst started programming, I used print statements. Having to write this book, I took a look at some of my earliest code samples, and it turns out that most of it was commented out print statements used for checking the value of variables. Note that I started off writing C using Notepad, and compiling all that through the command line, so no green run button and no IDE. I knew about GDB, but it was so hard to even set a simple breakpoint that I stuck to my print statements. Most of the bugs I had encountered so far had been obvious bugs staring at me in the face. After a few mishaps, I started to print everything that I could so that I could take a look at where the program was and what was happening, making sure not to underestimate bugs or the extent of my own stupidity.
In this chapter, we are going to be talking about PyCharm's powerful debugging tools and use them to understand, examine, and yes, debug our programs. We are going to:
• Take a look at how we can run Python scripts in running mode anddebugging mode
• Understand the different components of the debugging toolset• Use variables and watches to make sure we miss nothing• Utilize frames to zoom in and out of different layers of a program—from
your scripts right down to the Python standard library• Evaluate expressions at breakpoints• Use the Python console and Python prompt to gain a better understanding of
program execution
Debugging
[ 102 ]
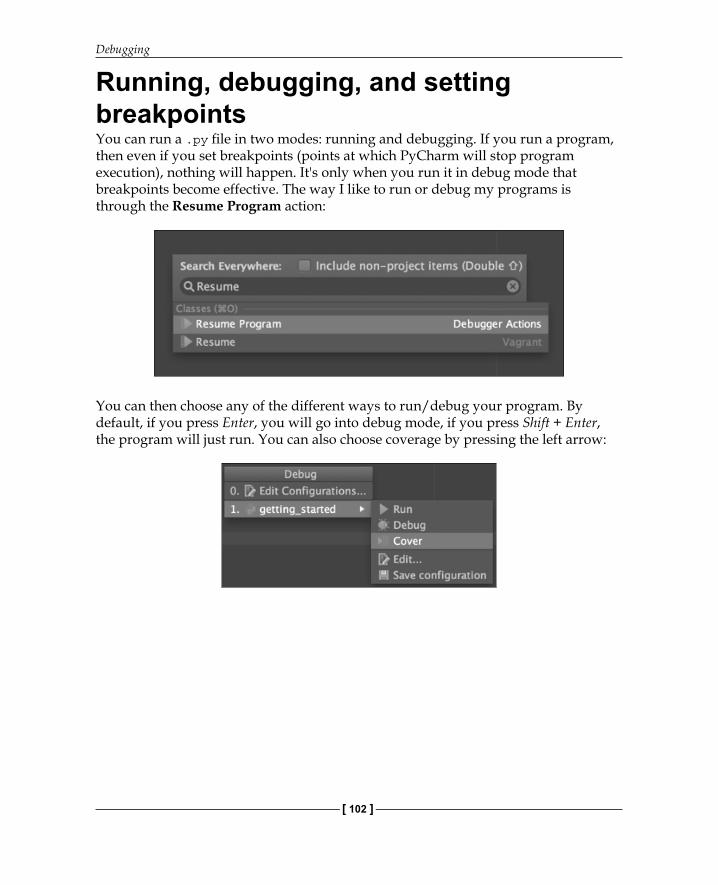
Running, debugging, and setting breakpointsYou can run a .py fi le in two modes: running and debugging. If you run a program, then even if you set breakpoints (points at which PyCharm will stop program execution), nothing will happen. It's only when you run it in debug mode that breakpoints become effective. The way I like to run or debug my programs is through the Resume Program action:
You can then choose any of the different ways to run/debug your program. By default, if you press Enter, you will go into debug mode, if you press Shift + Enter, the program will just run. You can also choose coverage by pressing the left arrow:

Chapter 6
[ 103 ]
As soon as you start debugging, a window appears underneath and you have so many options that it's hard to make sense of it all. Let's focus on managing breakpoints for now. To the bottom-left of the window, you can see a bunch of buttons:
This is the View Breakpoints button. This allows you to see different types of breakpoints that are available to you:
Debugging
[ 104 ]
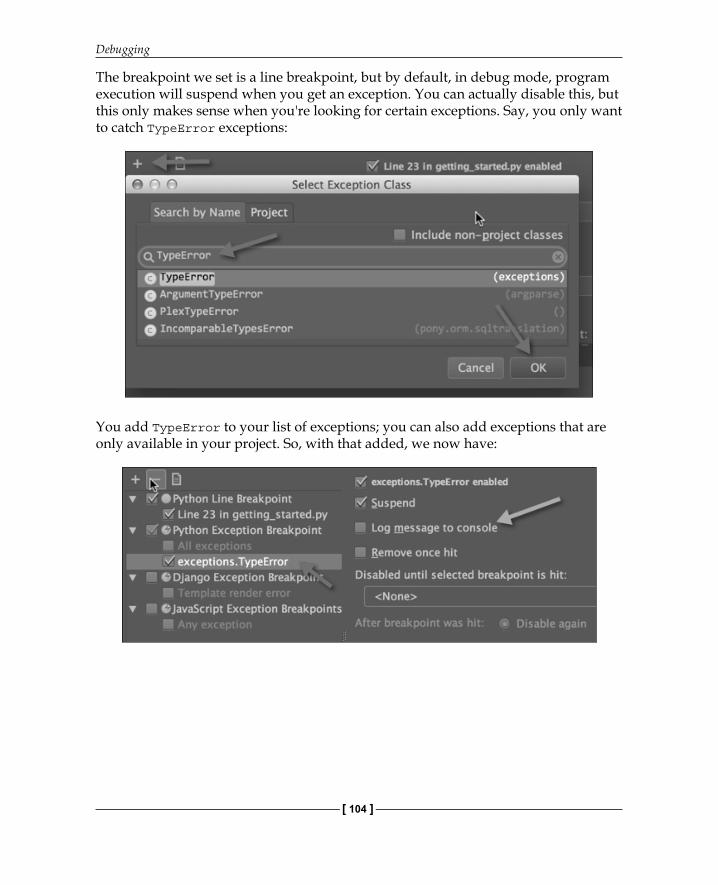
The breakpoint we set is a line breakpoint, but by default, in debug mode, program execution will suspend when you get an exception. You can actually disable this, but this only makes sense when you're looking for certain exceptions. Say, you only want to catch TypeError exceptions:
You add TypeError to your list of exceptions; you can also add exceptions that are only available in your project. So, with that added, we now have:
Chapter 6
[ 105 ]
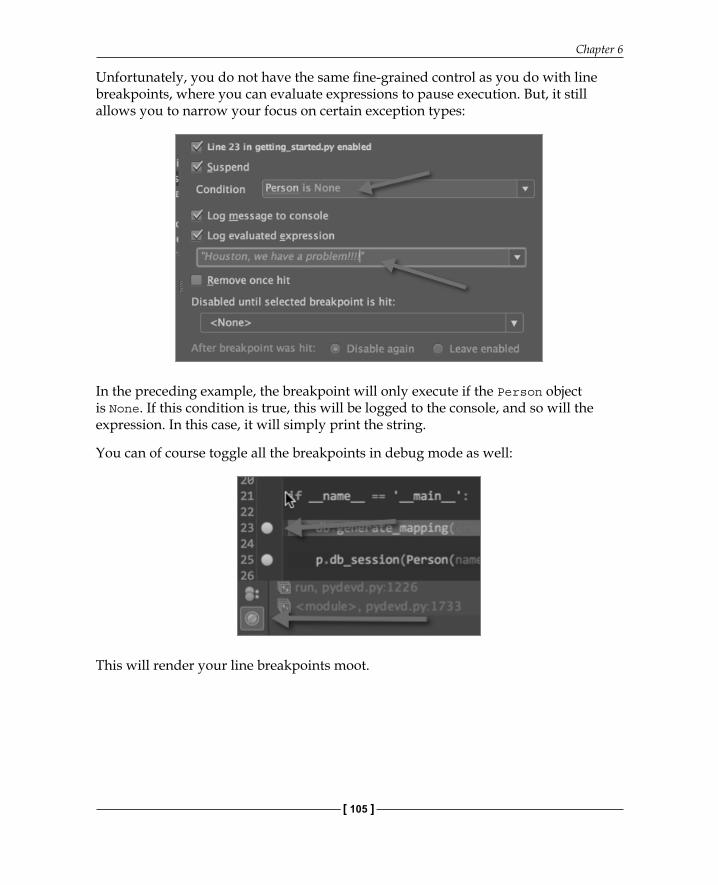
Unfortunately, you do not have the same fi ne-grained control as you do with line breakpoints, where you can evaluate expressions to pause execution. But, it still allows you to narrow your focus on certain exception types:
In the preceding example, the breakpoint will only execute if the Person object is None. If this condition is true, this will be logged to the console, and so will the expression. In this case, it will simply print the string.
You can of course toggle all the breakpoints in debug mode as well:
This will render your line breakpoints moot.
Debugging
[ 106 ]
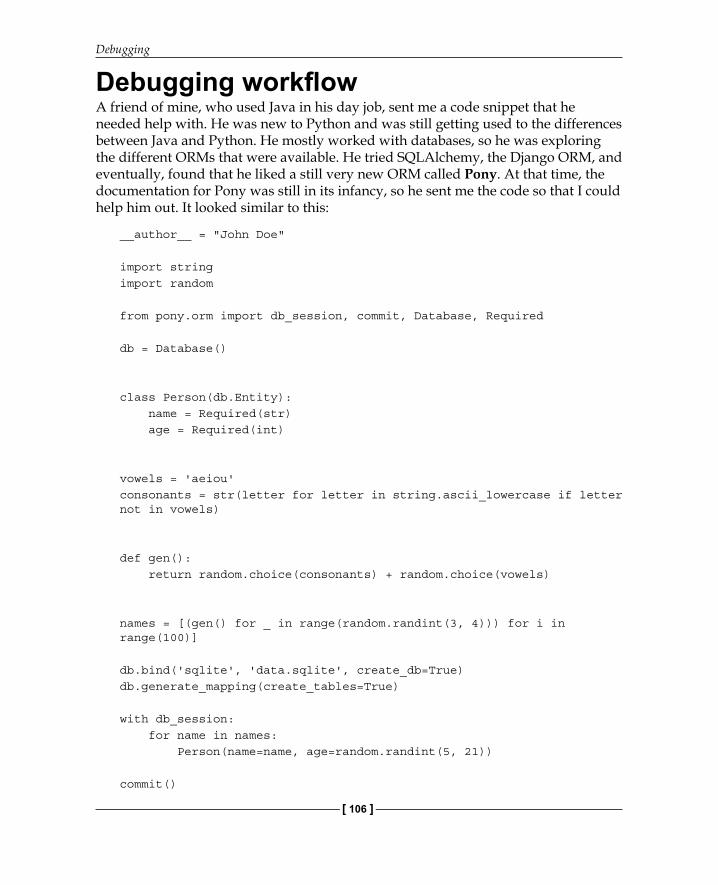
Debugging workfl owA friend of mine, who used Java in his day job, sent me a code snippet that he needed help with. He was new to Python and was still getting used to the differences between Java and Python. He mostly worked with databases, so he was exploring the different ORMs that were available. He tried SQLAlchemy, the Django ORM, and eventually, found that he liked a still very new ORM called Pony. At that time, the documentation for Pony was still in its infancy, so he sent me the code so that I could help him out. It looked similar to this:
__author__ = "John Doe"
import stringimport random
from pony.orm import db_session, commit, Database, Required
db = Database()
class Person(db.Entity): name = Required(str) age = Required(int)
vowels = 'aeiou'consonants = str(letter for letter in string.ascii_lowercase if letter not in vowels)
def gen(): return random.choice(consonants) + random.choice(vowels)
names = [(gen() for _ in range(random.randint(3, 4))) for i in range(100)]
db.bind('sqlite', 'data.sqlite', create_db=True)db.generate_mapping(create_tables=True)
with db_session: for name in names: Person(name=name, age=random.randint(5, 21))
commit()
Chapter 6
[ 107 ]
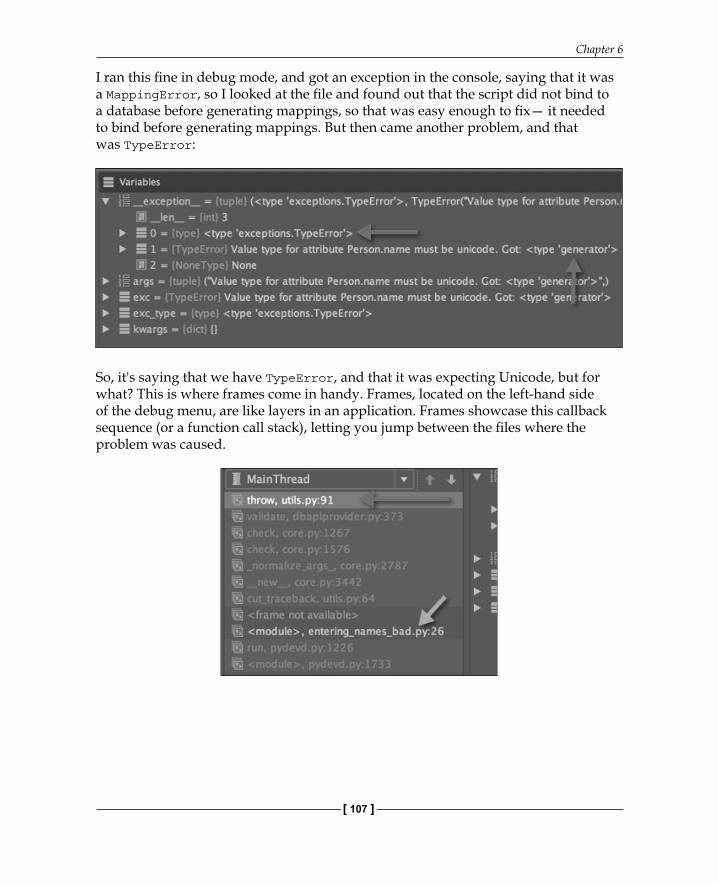
I ran this fi ne in debug mode, and got an exception in the console, saying that it was a MappingError, so I looked at the fi le and found out that the script did not bind to a database before generating mappings, so that was easy enough to fi x— it needed to bind before generating mappings. But then came another problem, and that was TypeError:
So, it's saying that we have TypeError, and that it was expecting Unicode, but for what? This is where frames come in handy. Frames, located on the left-hand side of the debug menu, are like layers in an application. Frames showcase this callback sequence (or a function call stack), letting you jump between the fi les where the problem was caused.
Debugging
[ 108 ]
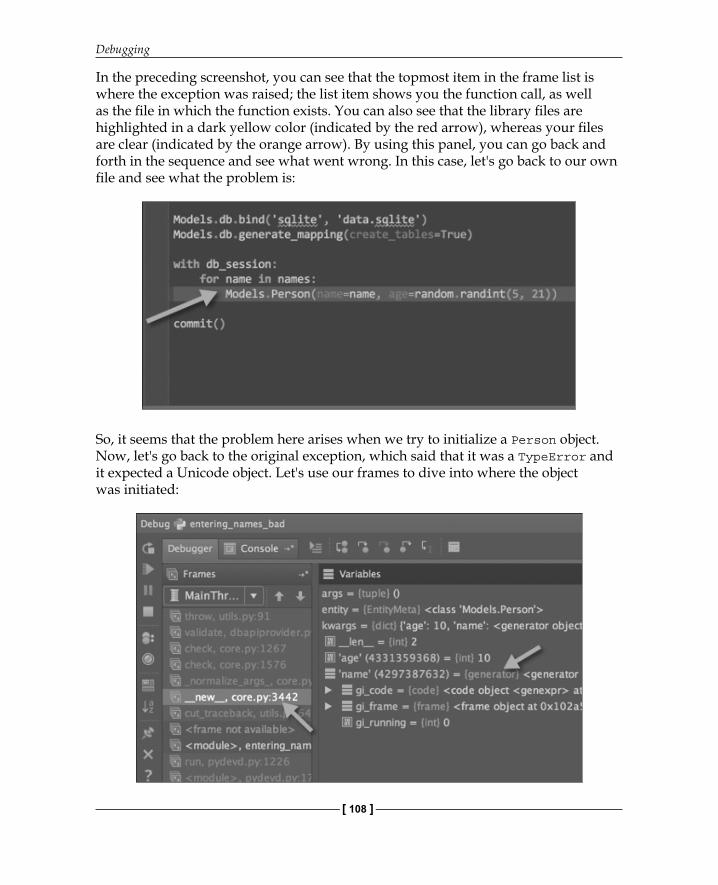
In the preceding screenshot, you can see that the topmost item in the frame list is where the exception was raised; the list item shows you the function call, as well as the fi le in which the function exists. You can also see that the library fi les are highlighted in a dark yellow color (indicated by the red arrow), whereas your fi les are clear (indicated by the orange arrow). By using this panel, you can go back and forth in the sequence and see what went wrong. In this case, let's go back to our own fi le and see what the problem is:
So, it seems that the problem here arises when we try to initialize a Person object. Now, let's go back to the original exception, which said that it was a TypeError and it expected a Unicode object. Let's use our frames to dive into where the object was initiated:

Chapter 6
[ 109 ]
We can see here that name is a generator, which feels wrong to me, because it should be a string or perhaps even Unicode. Let's go back to our original fi le and see what this is all about and also see what name is all about:
So, if we hover over name, we can see that it's a generator object, but that doesn't sound right. I mean, a person's name isn't supposed to be a generator. Name comes from names, and let's take a look at what names is made up of:
You can use the Evaluate Expression… button to check what an expression is; this button even has autocompletion. Right now, you can use it to evaluate simple expressions such as checking out the gen function. You can even select an expression in Python, right-click on the expression and then choose Evaluate Expression...:
Debugging
[ 110 ]
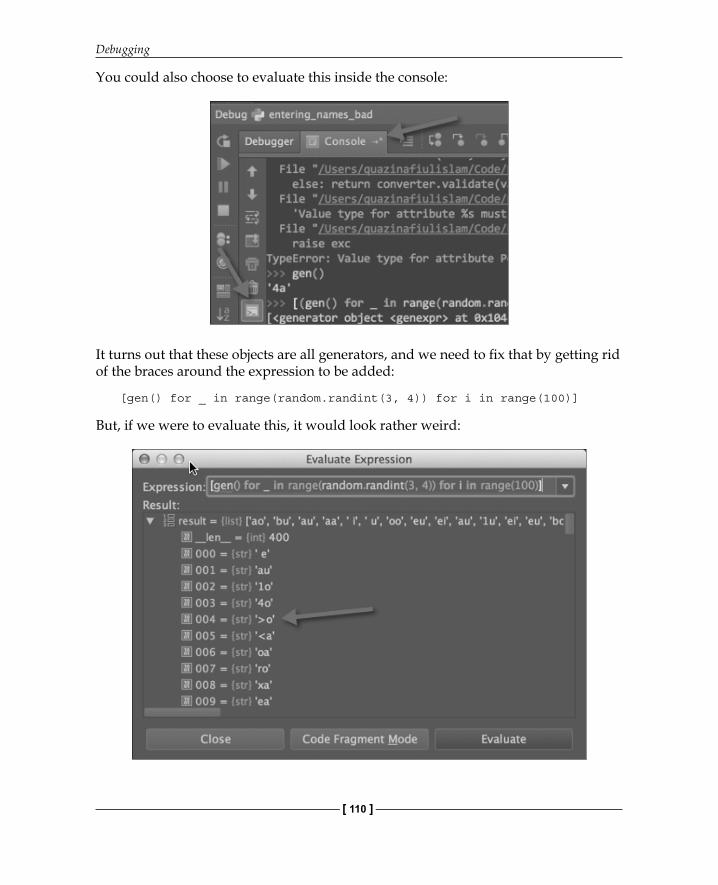
You could also choose to evaluate this inside the console:
It turns out that these objects are all generators, and we need to fi x that by getting rid of the braces around the expression to be added:
[gen() for _ in range(random.randint(3, 4)) for i in range(100)]
But, if we were to evaluate this, it would look rather weird:

Chapter 6
[ 111 ]
First, we're trying to generate names; names are usually not two letters long. Second, when was the last time you saw a name with a greater-than sign in it? Something fi shy is going on here. So, the gen function is giving us all of this data, and hence, there has to be something wrong with the gen function. Let's take a look at the gen function then. It turns out that gen concatenates a consonant and a vowel to form a pronounceable syllable.
Taking a look at gen, we fi nd that it makes function calls to random.choice, so I doubt there's a problem in the standard library. It uses two variables, vowels and consonants, and that means there's a problem in both or either of these two. The vowels variable is pretty simple, so there isn't much room for error. However, we're probably messing something up when we're generating consonants. Let's set a line breakpoint just before the declaration of the gen function and take a look at what the consonants variable is made up of.
Ha! It looks like we've got a stringifi ed (is that even a word?) generator. We need to use the string's .join function to get the job done. Let's do that now and change the line to this:
consonants = "".join(letter for letter in string.ascii_lowercase if letter not in vowels)
Let's see if that works now and take a look at what the names look similar to:

Debugging
[ 112 ]
It seems like we're having a little bit of trouble here. I've heard of a nickname called zu, but I think the names are too small, so let's make them bigger:
names = ["".join(gen() for _ in range(random.randint(3, 4))) for i in range(100)]
After making the change and rerunning the program, we get mobuwa and yemuyo as names. This is pretty neat! I might just use these names as example names; they are way better than John Doe.
After that fi nal change, the script ran smoothly and the right data was inserted into the database. I was able to send this back to my friend, and told him where he went wrong—mostly with the string concatenation using generators.
Before we depart this section, I'd like to tell you that Evaluate Expression… and the Console work inside frames. This means that if you're trying to evaluate an expression in a different frame that you have currently selected in the debugger, the debugger will give you an error.
Finally, PyCharm also supports watches and the usual step-into/step-out procedures that are conventional in debugging.
Dealing with threads and processesPyCharm has very good support for dealing with threads. Just like how we can change frames, we can also change threads if we so wish (that is, if we have more than one thread to begin with). Let's take the example of a simple downloader script called downloader.py:
# encoding=utf-8from threading import Thread
import requests
def download(url):

Chapter 6
[ 113 ]
response = requests.get(url) if response.status_code == 200: print "Success -> {:<75} | Length -> {}".format(response.url, len(response.content)) else: print "Failure -> {:>75}".format(response.url)
if __name__ == '__main__': urls = "http://www.google.com http://www.bing.com http://www.yahoo.com http://news.ycombinator.com".split()
for u in urls: Thread(target=download, args=(u,)).start()
To run this code, you'll need to install requests though pip install requests in the command line.
This is a simple script that sends a get request to a url (there are four in total here), and each request is sent in its own thread. This simple script will demonstrate PyCharm's ability to debug threads. This is what the output looks similar to after an initial run:
$ python downloader.py
Success -> http://www.google.com.bd/?gws_rd=cr&ei=1N_HVePAH9HiuQTHsLigDQ | Length -> 12559
Success -> http://www.bing.com/ | Length -> 58210
Success -> https://news.ycombinator.com/ | Length -> 27698
Success -> https://www.yahoo.com/ | Length -> 357013

Debugging
[ 114 ]
It seems simple enough; we can now set a breakpoint after we check for a 200 status:
After we set the breakpoint, we can now debug the script, and we see that the debugger stops on every single thread.
The drop-down menu, indicated by the red arrow, allows us to jump between threads. The orange arrow indicates the URL (since that is what is used to create each new thread).
Chapter 6
[ 115 ]
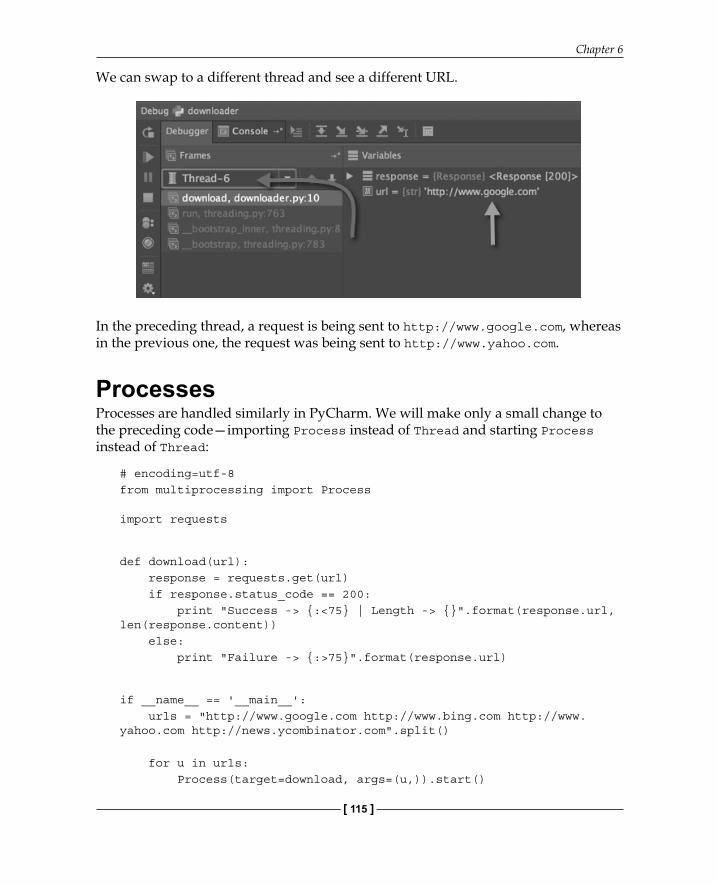
We can swap to a different thread and see a different URL.
In the preceding thread, a request is being sent to http://www.google.com, whereas in the previous one, the request was being sent to http://www.yahoo.com.
ProcessesProcesses are handled similarly in PyCharm. We will make only a small change to the preceding code—importing Process instead of Thread and starting Process instead of Thread:
# encoding=utf-8from multiprocessing import Process
import requests
def download(url): response = requests.get(url) if response.status_code == 200: print "Success -> {:<75} | Length -> {}".format(response.url, len(response.content)) else: print "Failure -> {:>75}".format(response.url)
if __name__ == '__main__': urls = "http://www.google.com http://www.bing.com http://www.yahoo.com http://news.ycombinator.com".split()
for u in urls: Process(target=download, args=(u,)).start()
Debugging
[ 116 ]
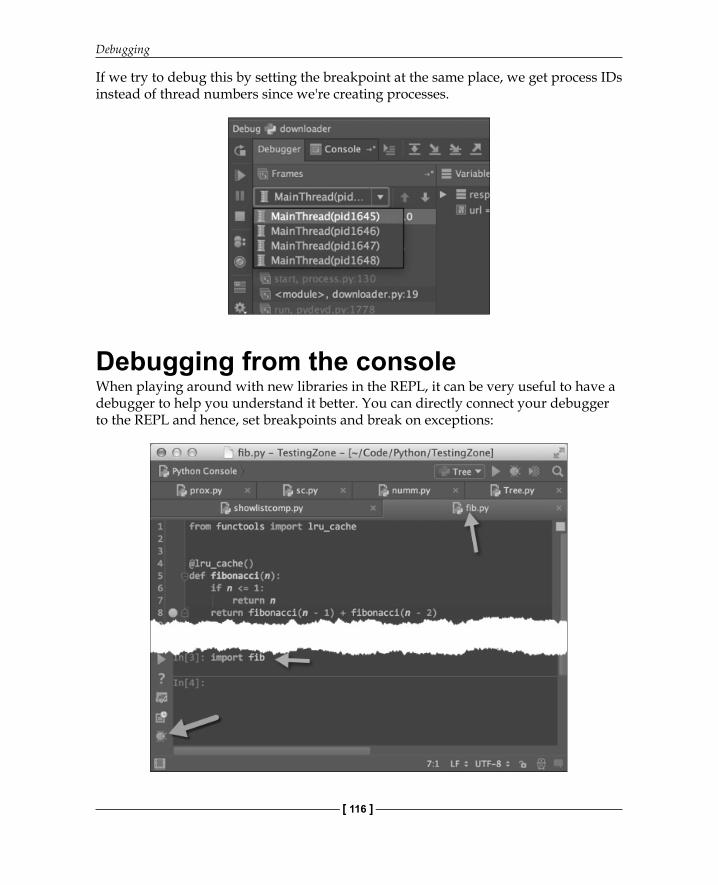
If we try to debug this by setting the breakpoint at the same place, we get process IDs instead of thread numbers since we're creating processes.
Debugging from the consoleWhen playing around with new libraries in the REPL, it can be very useful to have a debugger to help you understand it better. You can directly connect your debugger to the REPL and hence, set breakpoints and break on exceptions:
Chapter 6
[ 117 ]
We're importing fib fi rst (which is in our PYTHONPATH; in other words, in the root directory of the project), we set a breakpoint in the fibonacci function's recursive call, and we click on the button indicated by the green arrow. If we call the fibonacci function now from our REPL, we will see that the Python debugger suspends on the line indicated. So, fi rst we import the fi le we want to test out in our PYTHONPATH, then we click on the debugger button in the console, and fi nally, we merely invoke the function where we have set a breakpoint.
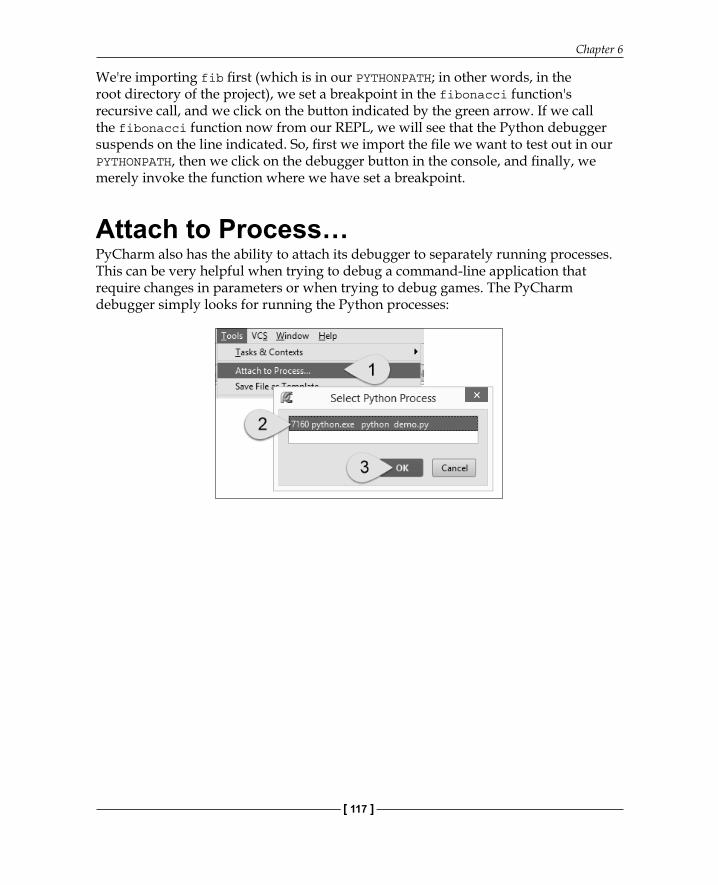
Attach to Process…PyCharm also has the ability to attach its debugger to separately running processes. This can be very helpful when trying to debug a command-line application that require changes in parameters or when trying to debug games. The PyCharm debugger simply looks for running the Python processes:
Debugging
[ 118 ]
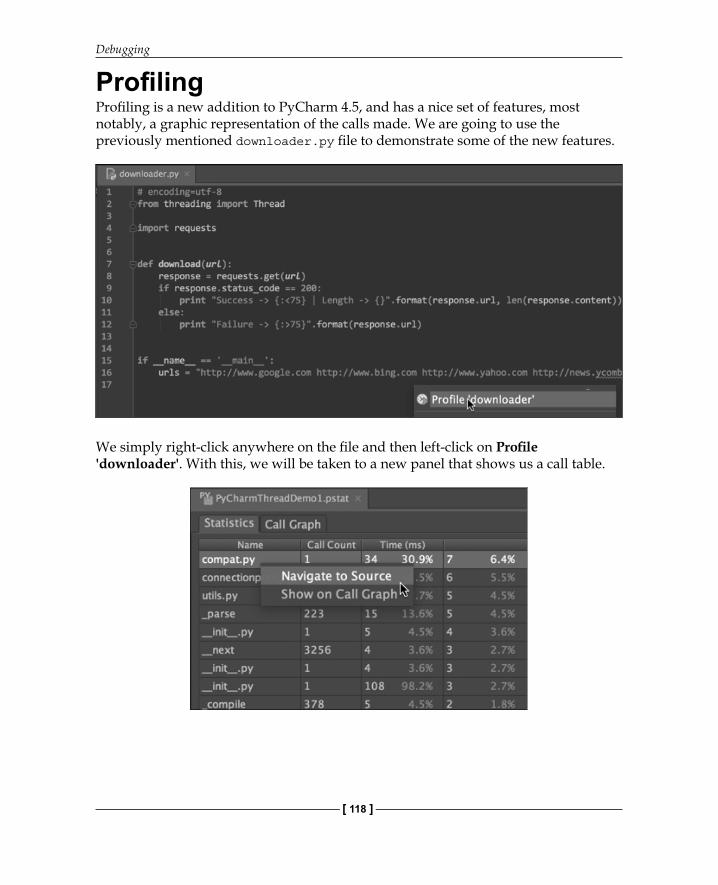
Profi lingProfi ling is a new addition to PyCharm 4.5, and has a nice set of features, most notably, a graphic representation of the calls made. We are going to use the previously mentioned downloader.py fi le to demonstrate some of the new features.
We simply right-click anywhere on the fi le and then left-click on Profi le 'downloader'. With this, we will be taken to a new panel that shows us a call table.
Chapter 6
[ 119 ]
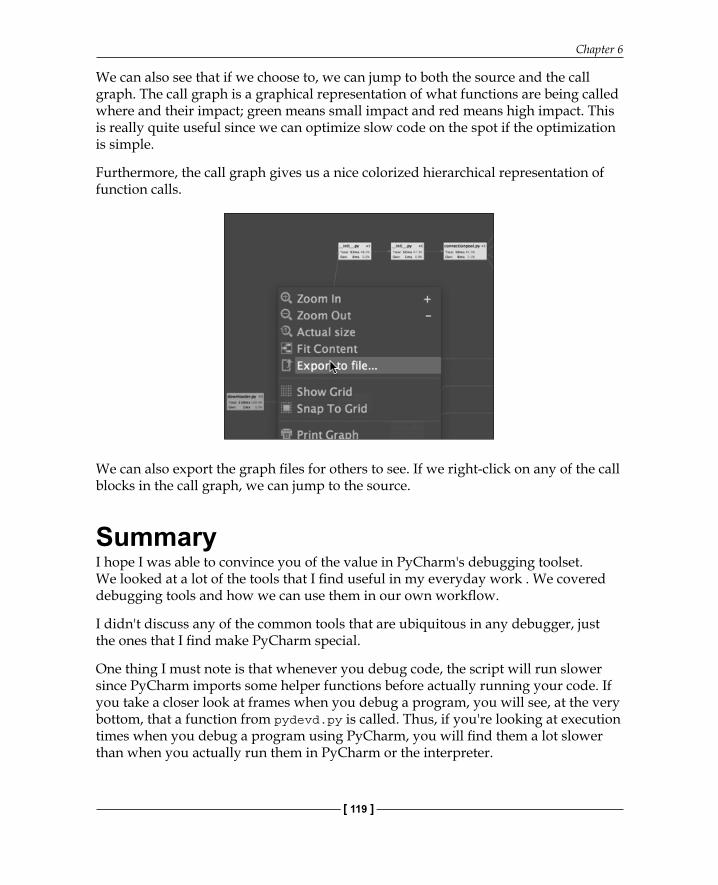
We can also see that if we choose to, we can jump to both the source and the call graph. The call graph is a graphical representation of what functions are being called where and their impact; green means small impact and red means high impact. This is really quite useful since we can optimize slow code on the spot if the optimization is simple.
Furthermore, the call graph gives us a nice colorized hierarchical representation of function calls.
We can also export the graph fi les for others to see. If we right-click on any of the call blocks in the call graph, we can jump to the s ource.
SummaryI hope I was able to convince you of the value in PyCharm's debugging toolset. We looked at a lot of the tools that I fi nd useful in my everyday work . We covered debugging tools and how we can use them in our own workfl ow.
I didn't discuss any of the common tools that are ubiquitous in any debugger, just the ones that I fi nd make PyCharm special.
One thing I must note is that whenever you debug code, the script will run slower since PyCharm imports some helper functions before actually running your code. If you take a closer look at frames when you debug a program, you will see, at the very bottom, that a function from pydevd.py is called. Thus, if you're looking at execution times when you debug a program using PyCharm, you will fi nd them a lot slower than when you actually run them in PyCharm or the interpreter.
Debugging
[ 120 ]
We also looked at PyCharm's new profi ler that allows to see a nice colorized call graph as well as giving you the ability to jump to source. If we so wished, we could also save the fi les for others to view.
Finally, make absolutely sure that you turn on the collection of runtime information when you debug since it will help you with type information, that is, better code completion.
Where to buy this book You can buy Mastering PyCharm from the Packt Publishing website.
Alternatively, you can buy the book from Amazon, BN.com, Computer Manuals and most internet
book retailers.
Click here for ordering and shipping details.
www.PacktPub.com
Stay Connected:
Get more information Mastering PyCharm