Embed Size (px)
Citation preview

01

Let's start!02

What's in this presentationWhat is JIT?
What does it do?
How to tune it?
Do we need to tune it?
••••
03

JIT04

JITJustInTime compilation
Compiled when needed
Maybe immediately before execution
...or when we decide it's important
...or never?
•••••
05

JVM
06

MixedmodeInterpreted
Bytecodewalking
Artificial stack machine
Compiled
Direct native operations
Native register machine
The Hotspot JVM uses mixedmode JIT
First interpreted, then compiled
•••
•••
••
07

Bytecode execution
08

ProfilingGather data about code while interpreting
Invariants (types, constants, nulls)
Statistics (branches, calls)
Use that information to optimize
Educated guess
It decides when to compile to native code, through profiling
It looks at which methods are called, at loops, at locks
The JVM guys called it "the shape of code"
•••
••
•••
09

OptimizationMethod inlining
Loop unrolling
Lock coarsening/eliding
Dead code elimination
Duplicate code elimination
Escape analysis
...
•••••••
10

InliningCombine caller and callee into one unit
e.g. based on profile
Perhaps with a guard/test
Optimize as a whole
More code means better visibility
•••
••
11

Inlining
12

Inlining
13

Inlining
14

Loop unrollingWorks for small, constant loops
Avoid tests, branching
Allow inlining a single call as many
•••
15

Loop unrolling
16

Loop unrolling
17

Lockcoarsening18

Lock coarsening
19

Lock coarsening
20

Lock eliding21

Lock eliding
22

Lock eliding
23

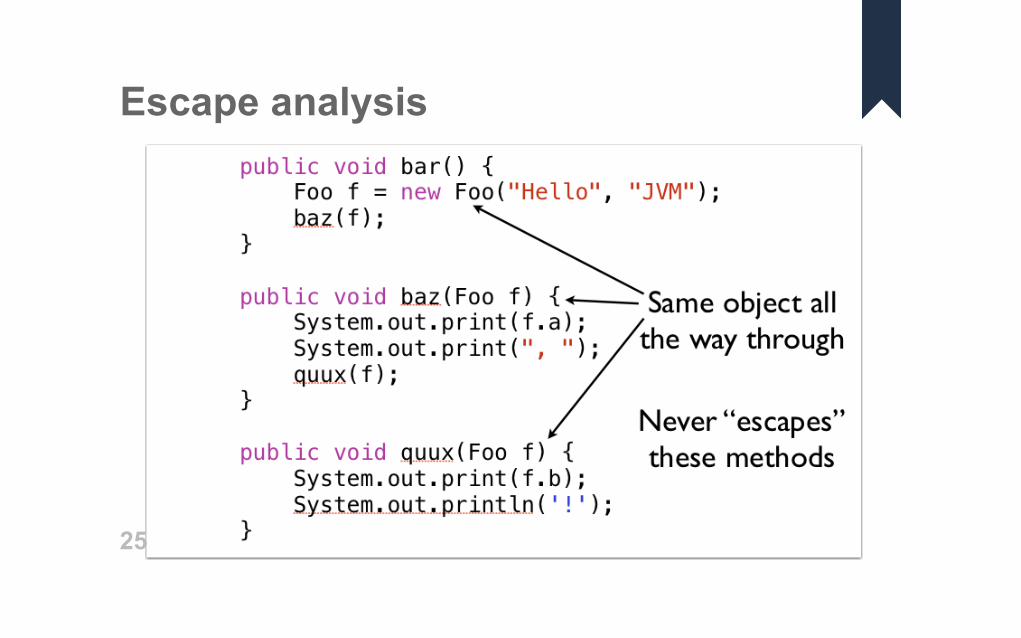
Escape analysis
24
Escape analysis
25

Escape analysis
26

Escape analysisEscape Analysis is a bit "flaky" on older Hotspot versions
Much better in JRockit and later Hotspot versions••
27

Call siteThe place where you make a call
Monomorphic ("one shape")
Single target class
Bimorphic ("two shapes")
Polymorphic ("many shapes")
Megamorphic ("you're screwed")
•••
•••
28

Call siteA call site of a function (subroutine) is a line in the code, which calls (or
may call, through dynamic dispatch) a function. A call site passes zero
or more arguments to the function, and receives zero or more return
values.
29

Example.java
30

Compilers31

Hotspotclient mode (C1) inlines, less aggressive
Fewer opportunities to optimize
server mode (C2) inlines aggressively
Based on richer runtime profiling
tiered mode
••
••
•
32

C1 CompilerFast startup
No profiling••
33

C2 CompilerProfile to find "hot spots"
Call sites
Branch statistics
Profile until 10k calls
Inline mono/bimorphic calls
Other mechanisms for polymorphic calls
••••
••
34

Tiered Compilation‐XX:+TieredCompilation
Multiple tiers of interpretation
Level 0 (interpreted)
Level 1 (C1, no profiling)
Level 2 (C1, basic profiling)
Level 3 (C1, full profiling)
Level 4 (C2)
•••••••
35

Monitoring JITDozens of flags
Reams of output
Always evolving
•••
36

Accumulator.java
37
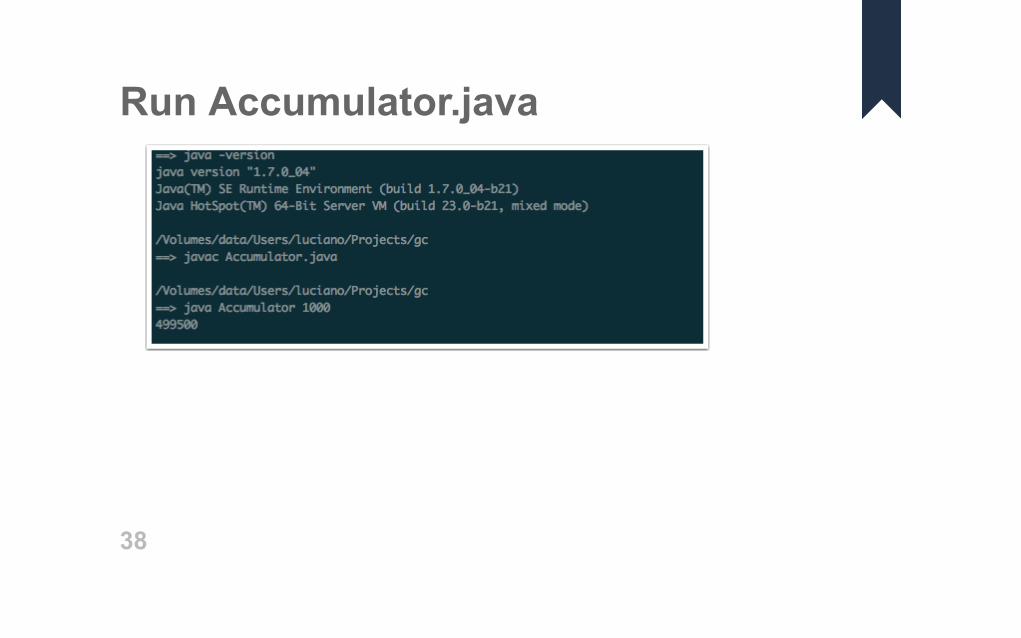
Run Accumulator.java
38

Print compilation‐XX:+PrintCompilation
Print methods as they compile
Class + name + size
•••
39

JIT debug
40

JIT debug
41

Zombies
42

Optimisitic compilersAssume profile is accurate
Aggressively optimize based on profiling information
Bail out if we're wrong
...and hope that we're usually right
••••
43
Optimisitic compilersThe way JVM works is based on OPTIMISTIC compilers
It assumes that the profile of the code is always accurate and will base
optimize based on this profile
What if we are wrong? We need to be able to bail out...
What can change? Different branches in the interpreter, new classes
loaded, etc.
••
••
44

DeoptimizationBail out of running code
Monitoring flags describe process
"uncommon trap" something's changed
"not entrant" don't let new calls enter
"zombie" on its way to deadness
•••••
45

DeoptimizationUncommon trap > there was a mistake and JIT needs to reanalyze
the system
Nonentrant > no thread can enter this code anymore
Zombie > code that will never be used
•
••
46
DeoptimizationExample: Generally the server compiler makes aggressive inlining
decisions of nonfinal methods. As long as the inlined method is never
overridden the code is correct. When a subclass is loaded and the
method overridden, the compiled code is broken for all future calls to it.
The code gets declared "non entrant" (no future callers to the broken
code), but sometimes existing callers can keep using the code. In the
case of inlining, that's not good enough; existing callers' stack frames
are "deoptimized" when they return to the code from nested calls (or
just if they are running in the code).47

No JIT at All?Code is too big
Code isn't called enough••
48

Other interesting flagsb Blocking compiler (always set for client)
* Generating a native wrapper
% On stack replacement (where the compiled code is running)
! Method has exception handlers
s Method declared as synchronized
n Method declared as native
01.
02.
03.
04.
05.
06.
49

More on JIT debug
50

Print inlining‐XX:+UnlockDiagnosticVMOptions ‐XX:+PrintInlining
Display hierarchy of inlined methods
Include reasons for not inlining
After compilation, we go deeper to figure out how the JVM decides
inlining
We use new flag to show the hierarcy of methods which get inlined
The UnlockDiagnosticVMOptions is required when using
PrintInlining and other flags which enable debug output
••••
••
51

No inline?
52

Why?
53

Why?The "add" method get "jitted", but not inlined, because there is nothing
to inline. The "+" operation is native and the "hot" code is not "hot"
enough to get other methods inlined.
54

New class
55

Inline output
56

IntrinsicKnown to the JIT
Don't inline bytecode
Do insert "best" native code
e.g. kernellevel memory operation
e.g. optimized sqrt in machine code
•••••
57

Common intrinsicsString#equals
All of Math methods
System.arraycopy
Object#hashCode
Object#getClass
sun.misc.Unsafe methods
••••••
58

Tuning inlining‐XX:+MaxInlineSize=35
Largest inlinable method (bytecode)
‐XX:+InlineSmallCode=#
Largest inlinable compiled method
‐XX:+FreqInlineSize=#
Largest frequentlycalled method...
••
••
••
59

Tuning inlining‐XX:+MaxInlineLevel=9
How deep does the rabbit hole go?
‐XX:+MaxRecursiveInlineLevel=#
Recursive inlining
••
••
60

More JIT logging‐XX:+UnlockDiagnosticVMOptions
‐XX:+TraceClassLoading
‐XX:+LogCompilation
‐XX:+PrintCodeCache
‐XX:+PrintCodeCacheOnCompilation
•••
61

More JIT logging‐XX:+PrintAssembly
‐XX:+PrintOptoAssembly
••
62

Code cache size‐XX:ReservedCodeCacheSize=#•
63
Demo: JIT64

Demo:JitWatch
65

Hmm...Can't we just compile all code before JVM starts?
Can we cache compiled code and make JVM start faster?••
66

AOTIBM JDK
Azul Zing
Excelsior JET
...
••••
67

AOT in HotSpot
68

AOT in HotSpot
69

Conclusion70

TakeawaysJIT compiler is on and works well by default
JIT compiler transforms code based on profiling information it collects
while application is running
It's worth tuning for frameworks/highperformance/lowlatency
scenarios
Method size and call frequency matters
••
•
•
71

Readingmaterial
72

References Ihttps://wiki.openjdk.java.net/display/HotSpot/LogCompilation+overview
http://www.oracle.com/technetwork/articles/java/architectevanspt1
2266278.html
https://gist.github.com/chrisvest/2932907
http://blog.joda.org/2011/08/printcompilationjvmflag.html
••
••
73

References IIhttps://blog.codecentric.de/en/2012/07/usefuljvmflagspart2flag
categoriesandjitcompilerdiagnostics/
http://www.insightfullogic.com/2014/May/12/fastandmegamorphic
whatinfluencesmethodinvoca/
http://psylobsaw.blogspot.co.uk/2013/05/usingjmhtobenchmark
multithreaded.html
http://www.slideshare.net/iwanowww/jitcompilerinjvmby
•
•
•
•
74

References IIIhttps://vimeo.com/197377385
http://www.slideshare.net/MonicaBeckwith/theperformanceengineers
guidetohotspotjustintimecompilation
https://www.infoq.com/articles/OpenJDKHotSpotWhattheJIT
https://www.infoq.com/news/2016/10/AOTHotSpotOpenJDK9
••
••
75

Books76
Java Performance
77

Java Performance Companion
78

Java Performance: The Defenetive Guide
79

Java Performance And Scalability
80

People to followKirk Pepperdine
Monica Beckwith
Alexey Shipilev
Sergey Kuksenko
Vladimir Ivanov
and many others
••••••
81

OpenJDK source codehttp://hg.openjdk.java.net
/jdk8u/jdk8u/hotspot
/file/e765322578aa/src/share/vm/opto
•••
82

Questions?83

Upcomingtrainings
84

JVM internals & perf. tuning
85

JVM internals & perf. tuninghttp://devchampions.com/training/jvm/
Riga, 18th19th of May, 2017
15% discount to JUG members, use JUG_LV code
•••
86

Effective Coding Principles in Java 8
87

Effective Coding Principles in Java 8http://devchampions.com/training/java/
Riga, 8th9th of May, 2017
15% discount to JUG members, use JUG_LV code
•••
88

Cheat Sheets89

Thank you!90


![Server-Side Type Profiling for Optimizing Client …the JVM [3] and CLR [2]), JavaScript JIT compilers opti-mize based on profile information collected during execution. But unlike](https://img.dokumen.tips/doc/110x75/5f666373458fd461020d3717/server-side-type-proiling-for-optimizing-client-the-jvm-3-and-clr-2-javascript.jpg)