Embed Size (px)
Citation preview

������������������ �
�������
��� ����������������������

���������� �� �����
�����������������
����������������������������� ��
�������������������� �!���"��
#���� ��!����"��������������"�!�������$"�������������� �����#���%��&������"����������������"���������%�����"���������%�� �������"�������� ��������������"�'���������������%�(������(���)��"����������*����� ���%��&!��'��������"��������!�������� ��!��'����!����(���"����"��!�"����"��(��"����������"����������"������(��'������ ��!������������������������!(�$"�����$����������!�����%�����'�����������+����������'�����������,�����"�-������(����(./ *�%0��&����(��������(��1�.2.3/4 (����
#���� ��!����"��������������"�!������'5�"�"�����%�������"��
����(���)�*67(��"��8(��"9��%(��������-��(-��7'5�"�(�����)�*67(�8�(������������'������������!��&�� �������!��������!�������"�������(��"�(�������������������������"���������"�������:���������������������������������!!�����.8������(�86(����7;7(������7;7����(���;��8(�����;��8����(�����)�*67����(�-<(���*�#=7�>(�����*�#=7�>����(���������#�*(�����#�*����(��"�� �(����"�� �����(��"�� �<�?�����*(��"�� �@��� ��������;��(��"�� �@#��=����A�;��(��"����(����"��������(����"��8����(����"��8=��&?��"�����(��"������(����"8������(����"8��7���������(��"8�"(����8�#(������8�#����(��"������(����"����������(��"�����(��"�$������(����"�$����������(��"�$�����(����"�$���������(��"6-(����"6-����(����"6-9��%������(��";��(��"�-�(����"�-�����(��"<�����"�(����"<�����"���������(��"-��(��"7'5�"�(��"���(����"�������(����<7#(������<7#����(��"�����(����"���������(����"����� ����"9��%����(��"�"��(����"�"������(��"�"���(����"�"�������(��"�"����(��"�8�(����"�8�����(����"�8���8���������(��"���(��"���!(����"���!����(��"������(��"#���'�$(��"#����(����"#��������(��"���(����"�������(�� ��������"9��%;������(����"9��%.8����������(����"9��%?�����������������(����"9��%8����'����������(����"9��%�!���������������(����"9��%������-������������(����"9��%*�%��&����������(����"9��%����������������(����"9��%����-������(����"9��%����-��� ����(����"9��%#��"&�������������(��"9������(��"=����(����"=��������(����;��(������;������(����=���(������(������������(����������-������(8�>(��8�>����(8�#�?����*#�;��#7�(8?�>�(��8���������� ��=��������(������8������(���������������(����@#��!;��(����@#��;��������(6��!���(;��������"8���������!(;��������-����(;��'�����(;��8��(��;��8������(;�� ����������(;��8��������(������-��(-��?����(-���� B(��-���� B����(��-��7'5�"�����(��-��7'5�"�������-������������(-����?������(-7<�(��-7<�����(*�������(��*�����������(�������)�*67����(������8�#(������<7#(������C�<<(��8�#��7*9����7*(��*�#=7�>(��79��<�0(���#��#��>�#(��#�?<��(�������"���<���#���������(�����-��(�������-������(�������-���-�����(������8��'���������(���8�����(�-<(���������(����-��(#�?<��(#��=����A�<������8��&��;��(����������������0�����������;��������"�� ��!��������!�������!��&�:�����"8��(��"7���(��"D���(���������"=�'(���3�3#�"�(;��������*�%��&(��;��������*�%��&����(%%%������������%��&�"�!(E�����"�!(���%%%������"�!��������"�!��&�� �����
#����!��� ����"�!��������������"��������������!��&����������������!��&�� ���������"�������!��&�%�����
��"9��%;������C�<#�"���������<������������ %����������"�����
����������������� ������ � ���� ���������� %���(��"�!������(���)���������������������������'5�"�����!�� ��<�"���������!����������������������;�����!���"+����������������#���#�8)<�-�#�8��;C#����!���!�!(���(�����"����(�����"������'�������;�����!������'5�"������"�������� �����6��FG����234����������(��(������HI�*41/2J:6��FG����2341HI�*41/2J���)��6��F4���44)4���4�H��!!��"���#�"���"��8��)��!������ %���J:���86���F�G����232 4GH*79411GJH#�"���"��8��J���)��86���F��2�2� �H��!������ %���J(�������"�'��������"��)-��� �"����������(./ *�%0��&����(��������(��1�.2.3/4 (����

��
� � � � � � � �
� �����������
��������������� �������������� ������������������������������������������������������������������������������������ ������������ ��������������������������������������������������������������������������������������������������������������������������������� ����� ������������� ��������������������������������������������������������������������������������������������������������������������� ����� ���������������������������������������������������������������������������������������������������������������������������������� ����� ���������������������������������������������������������������������������������������������������������������������������������� �� �!�����������"��������������������������������������������������������������������������������������������������������������������� ��#�������$��!� ������������������������������������������������������������������������������������������������������������������������ ��%��&�'����� $$�������� ��������������������������������������������������������������������������������������������������������� ��()*��������+$����$!��������������������������������������������������������������������������������������������������� ����)*����������������' ������������������������������������������������������������������������������������������������������������� ����
� ���������������������������������
� � �����������������
���������������'������������������������������������������������������������������������������������������������������������������ ����!����������"������������������������������������������������������������������������������������������������������������������������ ������& ������������������������������������������������������������������������������������������������������������������������������� �����$� �������� ������������������������������������������������������������������������������������������������������������������������ ������������������������������������������������������������������������������������������������������������������������������������������� �� , ��+ �������������������������������������������������������������������������������������������������������������������������������������� ��#���+��� ���������������������������������������������������������������������������������������������������������������������������������� ��%-��$��+������������������������������������������������������������������������������������������������������������������������������������ ��(. �$ � ����������������������������������������������������������������������������������������������������������������������������������� ���/.����0����$���������� ��������������������������������������������������������������������������������������������������������� ����1�$��������&��� ������������������������������������������������������������������������������������������������������ ����2�$������������������������������������������������������������������������������������������������������������������������������������ �������$������&�������$!������� ������������������������������������������������������������������������������������������� ����3�����$��������������!�$����������������������������������������������������������������������������������������������������� ����������-��4��$�5��� ��� ���������������������������������������������������������������������������������������������������� ��� .������'��&��$$�������������������������������������������������������������������������������������������������������������� ���#���2�$��������������������������������������������������������������������������������������������������������������������������������� ���%�������������������������������������������������������������������������������������������������������������������������������������� ���(���6�����*�����' ������������������������������������������������������������������������������������������������������������ ���/�������!��$ �������������������������������������������������������������������������������������������������������������������������� ����-���������� ���������������������������������������������������������������������������������������������������������������������� ����)*����������������' ������������������������������������������������������������������������������������������������������������� ����
� ��������� ������������������������������������������'�������������������������������������������������������������������������������������������������������������������� ����
����������� �������� �

������������������ �� ��������
� �������������
���������������' ���������������������������������������������������������������������������������������������������������������������6!�����2�$�����&��� ����������������������������������������������������������������������������������������������������������������-����7��'������+� ��7��'"���������������������������������������������������������������������������������������������������������+���8������&�����8������$� �����������������������������������������������������������������������������������������������������+������������������������������������������������������������������������������������������������������������������������������������������� -����&����� �������������������������������������������������������������������������������������������������������������������������������#2�$�������������������������������������������������������������������������������������������������������������������������������������������%2�������!��6������&��������96.�:������������������������������������������������������������������������������������(2�������� ���!����$ �����������������������������������������������������������������������������������������������������������/3���������4���4 ���������������������������������������������������������������������������������������������������������������������2���&��������������'�'���'������������������������������������������������������������������������������������������������������&��� ���������������������������������������������������������������������������������������������������������������������������!������+�����$��$������ �������������������������������������������������������������������������������������������������������������$��������$��+������������������������������������������������������������������������������������������������������������������������&������; ��+ ������������������������������������������������������������������������������������������������������ ��+����+������+������2�$ ���������������������������������������������������������������������������������������������������#-��$��+���; ������������� �� ���������������������������������������������������������������������������������������������������%-��$��+���; ������������� �� �������������������������������������������������������������������������������������������������(����������+���&��� ��������������������������������������������������������������������������������������������������������������������/�!������!��������� ����&�������+�����������������������������������������������������������������������������������������������������2�$��$����� �����������������������������������������������������������������������������������������������������������)*����������������' ������������������������������������������������������������������������������������������������������������������
� ��������������������������������' ������������������������������������������������������������������������������������������������������������������������
� ��������������������
���������������' �������������������������������������������������������������������������������������������������������������������������&+������������������������������������������������������������������������������������������������������������������������������������<���� ���������������������������������������������������������������������������������������������������������������������������������������2��� ��������������������������������������������������������������������������������������������������������������������������������������2�$6�$�����!+$����4������������������������������������������������������������������������������������������������������������� ���������������' ��������������������������������������������������������������������������������������������������������������������#�!+����+� ���������������"���������������������������������������������������������������������������������������������������%������������������������ �����������������������������������������������������������������������������������������������������������(�����������+��� ������������������������������������������������������������������������������������������������������������������������/������������!��� �����������������������������������������������������������������������������������������������������������������������������������������$����������������������������������������������������������������������������������������������������������
������ ������������� ��������

��������
������ ����������� ���������������������������������������������������������������������������������������������������������������� ������������+���������9�$������; ��+: ����������������������������������������������������������������������������������������� ������������������������!��� �������������������������������������������������������������������������������������������������� ������������+����$!�������������������������������������������������������������������������������������������������������������������� ��� ���� ������� ����+����������� ��������������������������������������������������������������������������������������������� ���#)*����������������' ������������������������������������������������������������������������������������������������������������� ���%
� �������� �����������������������������������'�������������������������������������������������������������������������������������������������������������������� ���(
! "��#���$��������������
���������������'������������������������������������������������������������������������������������������������������������������ ���1�$��������������$!���&��� ���������������������������������������������������������������������������������������������� ������� ����&��� ���������� ����������������������������������������������������������������������������������������������������� �����4���&��� ������������� ��� ����������������������������������������������������������������������������������������������� ����$�����������&������ ���������������������������������������������������������������������������������������������������������������� �� �����������������&����� �������������������������������������������������������������������������������������������������������� ��#�����������&��!������������� ���������������������������������������������������������������������������������������������� ��%�������������������������������������������������������������������������������������������������������������������������������� ��()�1��!�$�&���������&�������������������������������������������������������������������������������������������������������� ���/)�1���������������&�������������������������������������������������������������������������������������������������������� ������-�&���������&����� ������������������������������������������������������������������������������������������������������������ ����6�� ������������������$����&��� �������� ����������������������������������������������������������������������������� ����2����������������� ������������������������������������������������������������������������������������������������������������ ����3����������$!+�=��'��4����� ������������������������������������������������������������������������������������������� ��� 3�������������� ����������������������������������������������������������������������������������������������������������������� ���#6!����'�+��������'����� ������������������������������������������������������������������������������������������������������� ���%6!������������������������������������������������������������������������������������������������������������������������������� ���(���������! ��������������������������������������������������������������������������������������������������������������� ���/6!��5�����'������������������������������������������������������������������������������������������������������������������������ �������� ������������ ������������������������������������������������������������������������������������������������������������ ����6!��2����������� ������������������������������������������������������������������������������������������������������������������ ���������������&������ ����������������������������������������������������������������������������������������������������������� �����������������&������!������������ ������������������������������������������������������������������������������������� ���������������������!����������������������������������������������������������������������������������������������������� ��� �����������.$���� �������������������������������������������������������������������������������������������������������������� ���#�����'�&�����+$������������������������������������������������������������������������������������������������������������������ ���%)*����������������' ������������������������������������������������������������������������������������������������������������� ���(
� �����!�� �����������������������������������'�������������������������������������������������������������������������������������������������������������������� ���/
������������� �������� ���

������������������ �� ��������
% "��#���$���������
������ ��������' ������������������������������������������������������������������������������������������������������������������ ��6����� �������������������������������������������������������������������������������������������������������������������������������������� ��3���������������������+�������������������������������������������������������������������������������������������������� ��6�� ���������&������+$�� ����������������������������������������������������������������������������������������������������������� ��6��������$ ����������������������������������������������������������������������������������������������������������������������� � ��������� ����&������ ����������������������������������������������������������������������������������������������������������� �#����������������� ������������������������������������������������������������������������������������������������������������������� �%6�������������!�$� ������������������������������������������������������������������������������������������������������������������ �(>�������������� �������������������������������������������������������������������������������������������������������������������� ��/���������������'��!����� ������������������������������������������������������������������������������������������������� ������������������'��!�������� ���������������������������������������������������������������������������������������������� ������$!� ����������������������������������������������������������������������������������������������������������������������������������� ������$!������������������������������������������������������������������������������������������������������������������������������� ���1�$���� ���������������������������������������������������������������������������������������������������������������������������������� ������2�$�1�$���������� ���������������������������������������������������������������������������������������������������������� �� ��+�����1�$�������������������������������������������������������������������������������������������������������������������������� ��#)*������� ���������' ����������������������������������������������������������������������������������������������������������� ��%
� �����%��&����������'���������)*������� ?��������' ����������������������������������������������������������������������������������������������������������� ��(
� �����%��(���������������������������)�*�������� ������' �������������������������������������������������������������������������������������������������������������������� ��/
+ ����������
������#���������'����������������������������������������������������������������������������������������������������������������#����������������������&��������������������������������������������������������������������������������������������������������#��6!��)������������� �������������������������������������������������������������������������������������������������������������������#��2������������������ �����������������������������������������������������������������������������������������������������������#�����������&��� ��� ��������������������������������������������������������������������������������������������������������������������#� ���$����������& ����� ���������������������������������������������������������������������������������������������������������#�#���4���'��!��4���!�� ������������������������������������������������������������������������������������������������������������#�%3������$$��������������������������������������������������������������������������������������������������������������������������#�()�������4� �������������������������������������������������������������������������������������������������������������������������������#��/�������=�'�<��� ������4 �������������������������������������������������������������������������������������������������������#���2���&+�<��� ������1��!�$��<��� �� �����������������������������������������������������������������������������������#���)*���@6����<��� �������� ��5��+����������������������������������������������������������������������������������#���� ������$�����5��+�� �������������������������������������������������������������������������������������������������������#������������������*����$���������������������������������������������������������������������������������������������������������#���
������ ������������� ��������

��������
������� ��������������������������������������������������������������������������������������������������������������������������� #�� 6��������� ������������������������������������������������������������������������������������������������������������������������������ #��#�4���!�����*���� � ����������������������������������������������������������������������������������������������������������� #��%2���&+����*������&��� ����������������������������������������������������������������������������������������������������� #��(��������4���!�������� ������������������������������������������������������������������������������������������������������� #��/)*�������#���������'����������������������������������������������������������������������������������������������������������� #���
� �����+)���������������$��������������������������#?��������' ������������������������������������������������������������������������������������������������������������� #���)������������ ��������&������������&��� ��� ��������������������������������������������������������������������������� #���)������������ ���������$������� ��������������������������������������������������������������������������������������� #���2�4�����!�����!����������������������������������������������������������������������������������������������������������� #�����!�����!����������2�$ ������������������������������������������������������������������������������������������������� #�� ������������&���������������������������������������������������������������������������������������������������������� #��#��!�����!�����'��!����6�����* ��������������������������������������������������������������������������������������� #��%�������=�'�<��� �������� ���������������������������������������������������������������������������������������������������� #��()*�������#?��������'����������������������������������������������������������������������������������������������������������� #��/
� �����+,�������������������������#������'�������������������������������������������������������������������������������������������������������������������� #���
- "��#���$��������������������
������%��������'������������������������������������������������������������������������������������������������������������������ %���!�����������&������" ��������������������������������������������������������������������������������������������������������� %�������������+���������������������������������������������������������������������������������������������������������������������� %��-�� ��������� ���������� ����������������������������������������������������������������������������������������������� %��1�&��������������� ������������������������������������������������������������������������������������������������������������� %� 2�$�$��������� ���������������������������������������������������������������������������������������������������������������������� %�#5������������������ ��������������������������������������������������������������������������������������������������������������� %�%6+$����&�$��������� ��������������������������������������������������������������������������������������������������������������� %�(�����������+��������$������������������������������������������������������������������������������������������������ %��/�������$����������&������� ��������������������������������������������������������������������������������������������� %���7��'���$����������&������� ������������������������������������������������������������������������������������������� %������2�$����$��������� ������������������������������������������������������������������������������������������������������� %����!�����$��������������������������������������������������������������������������������������������������������������������� %���)*�������%��������' ������������������������������������������������������������������������������������������������������������� %���
� �����-��"��#�$�������������������'�����������%������'�������������������������������������������������������������������������������������������������������������������� %��
������������� �������� �

������������������ �� ��������
. /�������������
������(��������' ������������������������������������������������������������������������������������������������������������������(��2�$�������������������� ������������������������������������������������������������������������������������������������������(��<�������������������������$!������������������������������������������������������������������������������������������(������ �����������$� ���������������������������������������������������������������������������������������������������������(��6+$����&���$� �������������������������������������������������������������������������������������������������������������������������(� �� �������������$!�������� ��������������������������������������������������������������������������������������������������(�#����������$�������2�$�������������������������������������������������������������������������������������������������������(�%������� $��!��$���������������������������������������������������������������������������������������������������������������������(�(����&+�����$��������������������������������������������������������������������������������������������������������������(��/���������$�������� ���������������������������������������������������������������������������������������������������������(������*��$����&��!��������5��$�������������������������������������������������������������������������������������(��������������!�����'�����������������������������������������������������������������������������������������������������(������$�����������&�������+���� ������������������������������������������������������������������������������������������(������������*� ����&��������������������������������������������������������������������������������������������������������(�����+� ����������������������������������������������������������������������������������������������������������������������������������(�� ���������� ���� ���������������������������������������������������������������������������������������������������������������������(��#����������� ������$����$����� ����������������������������������������������������������������������������������������(��%5���������$���������$� ����������������������������������������������������������������������������������������������������(��()*$����������$ ��������������������������������������������������������������������������������������������������������������������(��/)*�������(��������' ��������������������������������������������������������������������������������������������������������������(���
� �����.��(�����������������(������' ��������������������������������������������������������������������������������������������������������������������(���
������ ������������� ��������

����
����
�������������������� ��������������������������������
�����������
��������������� �������������� ������������ ����� ������������� ����� �������������� ����� ����������� �� �!�����������" ��#�������$��!� ��%��&�'����� $$�������� ���� ��()*��������+$����$!����������� ����)*����������������' ����


Introduction to ArcGIS I 1-1Introduction
Copyright © 2000–2004 ESRI. All rights reserved. Introduction to ArcGIS I
Introduction to ArcGIS I
Introduction to ArcGIS I 1-2Introduction
1-2Introduction to ArcGIS ICopyright © 2000–2004 ESRI. All rights reserved.
Welcome to Introduction to ArcGIS IInstructor introduction
Student introductionsName
Organization
Role in organization
GIS experience
Goals and expectations for this class
Welcome to Introduction to ArcGIS I.
Prerequisites
This course is the first of two introductory-level courses for ArcGIS, and no prerequisite courses are required. No prior knowledge of GIS or experience with ArcGIS software is needed.

Introduction to ArcGIS I 1-3Introduction
1-3Introduction to ArcGIS ICopyright © 2000–2004 ESRI. All rights reserved.
LogisticsDaily schedule
Start _______________Lunch _______________Finish _______________
FacilitiesRefreshments and break areaRestroomsTelephones and messagesInternet accessStudent ID badgesParking
Daily schedule
Under normal conditions, the class will begin each morning at 8:30 a.m. and continue until 5:00 p.m. There will be at least one break in the morning and one in the afternoon. You will generally be given one hour for lunch.
Facilities
Your instructor will provide information regarding the facilities.
Internet access
Some training facilities provide Internet access for your use during class. ESRI® regards Internet access as an essential business resource for classroom demos, exercises, arranging travel, and maintaining contact with your office. Please limit your use of the Internet to business activities only and as a courtesy to your classmates, refrain from typing or surfing during lecture presentations.

Introduction to ArcGIS I 1-4Introduction
1-4Introduction to ArcGIS ICopyright © 2000–2004 ESRI. All rights reserved.
Course materials
ESRITraining Data
BooksLectureExercise
CDsCourse data
Online course evaluationhttp://classeval.esri.com
Requires Course Identification Number
Software evaluationE-mail enhancement requests to product teams
Teaching methods
Research indicates that students learn differently. This course maximizes your learning experience by combining instructor-led lectures and discussions, demonstrations, computer-based exercises, and review questions.
Class materials
Your class materials include lecture and exercise coursebooks. These are yours to take home, so feel free to write in them. The class data CD, attached to the back of the exercise book, contains all the datasets you will work with during class.
Course evaluation
Your feedback improves ESRI’s courses. At the end of the week, please evaluate the following:
• Instructor • Course materials • Teaching facilities • Overall course
Software evaluation
If you have access to a Web-based e-mail account during class, you can send comments about the software directly to the product development teams. Your comments directly influence enhancements to ESRI products, so please let us know what you think.

Introduction to ArcGIS I 1-5Introduction
1-5Introduction to ArcGIS ICopyright © 2000–2004 ESRI. All rights reserved.
Course objectivesDisplay spatial and tabular data
Query data usingAttributes
Spatial relationships
Edit spatial and attribute data
Produce maps, reports, and graphs
Ask questions and participate in discussions
Course objectives
This course introduces you to the ArcGIS desktop software applications and provides you with the foundation to become a successful user of ArcView, ArcEditor, or ArcInfo. You will learn to use the ArcCatalog™ and ArcMap applications, explore some of the tools available inthe ArcToolbox™, and discover how these components work together to provide a complete GIS software solution. The course covers fundamental GIS concepts as well as how to create, edit, and work with georeferenced spatial data. You will learn how to manipulate spatial and tabular data, query a GIS database, and present data clearly and effectively using maps, charts, and reports.
This course covers a variety of topics but may not include tools or concepts specific to your needs. If you have questions about particular functionality that does not appear to be covered by this class, feel free to ask your instructor for more information.
Introduction to ArcGIS I 1-6Introduction
1-6Introduction to ArcGIS ICopyright © 2000–2004 ESRI. All rights reserved.
Course timeline
Explore GIS conceptsDisplay dataQuery your databaseWork with spatial data
Day 1
Work with tablesEdit dataWork with georeferenced dataPresent data
Day 2
Lesson 9: Presenting data
Lesson 5: Working with spatial data
BreakBreak
Lesson 8: Working with georeferenced data
Lesson 4: Querying your database
LUNCHLUNCH
Lesson 7: Editing data
Lesson 3: Displaying data
BreakBreak
Lesson 6: Working with tables
Lesson 1: Introduction
Lesson 2: Exploring GIS concepts
Day 2Day 1

Introduction to ArcGIS I 1-7Introduction
1-7Introduction to ArcGIS ICopyright © 2000–2004 ESRI. All rights reserved.
What is ArcGIS?
ArcGIS Clients
Application/Data Servers
ArcGIS DesktopEXTENSIONS
ArcGIS Engine
Components ArcObjectsArcObjects
ArcReaderArcReader ArcViewArcView
ArcInfoArcInfo
ArcEditorArcEditor
CustomApplication
CustomApplication
RDBMS
ArcSDEArcSDE
ArcGIS ServerArcGIS Server ArcIMSArcIMS
EXTENSIONS
ArcPadArcPad
Network
WebBrowser
WebBrowser
ArcGIS is the name used to identify ESRI’s flagship family of GIS products. ArcGIS®
includes ArcGIS client software, components as well as application and data server software. ArcGIS itself is not a GIS application; rather, it is a set of software products for building ArcGIS systems that best suit your GIS needs.ArcGIS is based on a common library of shared GIS software components, called ArcObjects™. ArcGIS is composed of client and server applications. Each software application can create, manage, analyze, and serve data stored in one or more formats.• ArcGIS Desktop: Integrated suite of advanced GIS applications consisting of three software
products: ArcView®, ArcEditor™, and ArcInfo®. The ArcGIS Desktop applications provide the same core mapping, editing, and analysis functionality. The level of functionality available differs depending on which license you have. ArcInfo provides users with the most complete level of GIS functionality. It is composed of ArcInfo Desktop, as well as ArcInfo Workstation.
• ArcReader™: Allows users to view high quality published maps (.PMFs) created in ArcMap™.
• ArcGIS® Engine: Developer toolkit of embeddable GIS components for building custom stand alone applications using COM, C++, Java, and .NET
• ArcPad®: Used with PDAs for creating and managing data while in the field• ArcGIS® Server: A shared library of GIS software objects used to build/develop serverside
GIS applications in enterprise and Web computing frameworks• ArcIMS®: Use to publish maps, data, and metadata through open internet protocols• ArcSDE®: Manages and serves spatial information from external RDBMS to ArcGIS clientsFor more information, go to http://www.esri.com/software/index.html.

Introduction to ArcGIS I 1-8Introduction
Depending on which ESRI software your organization has licensed, your skills, and your plans for upcoming projects, you may benefit from additional training on advanced topics, on specialized software, or on background topics to refine your understanding of GIS and related technologies.
Detailed information about Instructor-led and Web-based courses—including a list of topics covered, intended audience, duration, schedules, and pricing—is available in the ESRI Course Catalog. You can access this catalog on the Web at http://www.esri.com/training/index.html. On the ESRI Training Web site, you can also find information about new courses developed since the course catalog was printed.
Web-based courses offer convenience and savings. Also, many ESRI Virtual Campus courses include a free lesson, called a module. You can create a free account and begin training with these free modules within minutes at http://campus.esri.com.
In addition to Web-based courses, the Virtual Campus also offers free live training seminars, training seminars, and Web workshops. Live training seminars are focused lectures on a variety of GIS topics for all levels of users. Consult the Virtual Campus for upcoming topics, dates and times. Training seminars are free recordings of live training seminars, viewable at your convenience. Workshops are recordings of live training seminars, viewable at your convenience, plus printable slides of the presentation, questions and answers from the live training seminar, a software exercise with accompanying data, an optional exam to assess understanding, and a certificate for successfully completing the exam.
1-8Introduction to ArcGIS ICopyright © 2000–2004 ESRI. All rights reserved.
Learning pathshttp://www.esri.com/training_events.html
Learning Guide Learning paths organized by software and topic
Learning optionsInstructor-led courses
Virtual Campus courses
Training seminars
Web workshops

Introduction to ArcGIS I 1-9Introduction
1-9Introduction to ArcGIS ICopyright © 2000–2004 ESRI. All rights reserved.
ESRI Support Centera gateway to resourceshttp://support.esri.com
Knowledge BaseTechnical articlesWhite papersSystem requirements
DownloadsPatches and service packsData modelsArcScripts
User ForumsDiscussion groupsE-mail lists
Software support resources
For DevelopersDeveloper resources
Request ESRI Technical SupportAvailable to support subscribers
ESRI’s primary resource for software support is the ESRI Support Center at http://support.esri.com. From the ESRI Support Center, you can request assistance from ESRI Technical Support, interact with other ESRI software users, and even help yourself to technical information and downloads. Look for answers to your questions in one of several self-help resources.
Knowledge Base
The Knowledge Base is a searchable database of focused technical articles. It includes answers to frequently asked questions, step-by-step directions for performing common tasks, and workarounds for known software limitations. The Knowledge Base also contains topic-focused white papers organized by product, system requirement information, and product documentation.
Downloads
Obtain the latest software patches (a bug fix) and service packs (a compilation of bug fixes), software and code samples, utilities, tutorials, user contributed scripts and sample code (ArcScripts), data models, and evaluation software from ESRI’s Download page.
User Forums
The User Forums allow you to ask questions, provide answers, and exchange ideas with other ESRI product users. Resources include several discussion forums, as well as two subscription email discussion lists moderated by ESRI. ArcView-L is for ArcView users, and ESRI-L is for users of all of ESRI’s other products.

Introduction to ArcGIS I 1-10Introduction
For Developers
This page is targeted at ESRI’s developer community. It provides the latest developer information, including sample code, technical documents, and object model diagrams for ESRI’s Developer products.

Introduction to ArcGIS I 1-11Introduction
1-11Introduction to ArcGIS ICopyright © 2000–2004 ESRI. All rights reserved.
Exercise typographic conventionsDescriptivetextAction
Note
Warning
Question with hint
Controlname
Keyboardinput
Before you begin your first exercise, you need to recognize the typographic conventions used in your exercise coursebook.
Descriptive text
This text can provide an overview of the next sequence of actions, a review of actions just completed, or an interpretation of output on your computer monitor. Descriptive text may introduce what is about to happen with phrases like “Next, create a new map in ArcMap”; the actual instruction follows, indicated by the check box symbol.
Action
Actions are tasks—like starting an application, clicking a button, or typing a command—that you must perform during the exercise. The square check box symbol indicates an action; act only on instructions that are prefaced with the check box symbol.
You can mark the check box symbol in your exercise coursebook as you complete each task. This is especially helpful when shifting your attention between your book and your computer monitor.
Control name
Names of objects on your monitor with which you interact are italicized in your exercise coursebook. These include window titles, menus, and buttons. Many buttons reveal their names with a ToolTip when you hold your mouse cursor over them.

Introduction to ArcGIS I 1-12Introduction
Note
Paragraphs prefaced with Note: provide inconsequential information, such as an optional way to perform an action or platform-specific syntax for a script.
Warning
The large exclamation point symbol and bold text signals critical information for performing the next action. Warnings may alert you to a subtle syntactical rule in a command you will type or inform you that the next button you click will produce an error intentionally. If you have questions about a warning, ask your instructor for clarification before proceeding.
Keyboard input
Text you need to type—like commands in a Command Prompt, entering a file name in a Save dialog, and pressing Ctrl + Alt + Delete—appears in bold, constantly spaced font.
Question with hint
Questions require you to record answers in your coursebook. Questions are renumbered within each exercise and may be followed by a hint.
Sometimes the answer to one question depends on your answer to a previous one. Classes that use this teaching technique extensively include an exercise worksheet as an appendix in your lecture course book, enabling you to record all answers on the worksheet for easier cross-referencing.
Answers to questions immediately follow each exercise.

Introduction to ArcGIS I 1-13Introduction
1-13Introduction to ArcGIS ICopyright © 2000–2004 ESRI. All rights reserved.
Exercise 1 overviewInstall the class database

Introduction to ArcGIS I 1-14Introduction
1-14Introduction to ArcGIS ICopyright © 2000–2004 ESRI. All rights reserved.
����
����
�������������������� ��������������������������������
����� �������������
��������������� ��� ������������ ��������������� ��������������� ������������� ��� ��! ��"#��$!�� ��%&��$�! ��'(����� ��)*(���+��������$����� ��)),������������������������������ ��)�-������$� ��)���.������������������������ ��)�/���������$��$�������� ��)�#�����&��0����1������ ��)�(������������$������ ��)"
#�-�� ��)%#�����$�� ��)'#�2��$3�4� ���� ���*���������$� ���)&�.�������� ����54������������� ����������������� ����


Introduction to ArcGIS I 2-1Exploring GIS concepts
Copyright © 2000–2004 ESRI. All rights reserved. Introduction to ArcGIS I
Exploring GIS concepts

Introduction to ArcGIS I 2-2Exploring GIS concepts
2-2Introduction to ArcGIS ICopyright © 2000–2004 ESRI. All rights reserved.
Lesson 2 overviewIntroduction to GIS concepts
ArcGIS and other ESRI software products

Introduction to ArcGIS I 2-3Exploring GIS concepts
2-3Introduction to ArcGIS ICopyright © 2000–2004 ESRI. All rights reserved.
What is a GIS?An integration of five basic components
Procedures
Definitions of a geographic information system can vary considerably. The definition provided here combines both the components and functions of a GIS. The components needed to perform GIS tasks include:
PeopleThis is the most important component in a GIS. People must develop the procedures and define the tasks of the GIS. People can often overcome shortcomings in other components of the GIS, but the best software and computers in the world cannot compensate for the incompetence of people.
DataThe availability and accuracy of data can affect the results of any query or analysis.
HardwareHardware capabilities affect processing speed, ease of use, and the type of output available.
SoftwareThis includes not only actual GIS software but also various database, drawing, statistical, imaging, or other software.
ProceduresAnalysis requires well-defined, consistent methods to produce accurate, reproducible results.

Introduction to ArcGIS I 2-4Exploring GIS concepts
2-4Introduction to ArcGIS ICopyright © 2000–2004 ESRI. All rights reserved.
GIS functions
QueryQuery
AnalyzeAnalyze
StoreStore
DisplayDisplay
CaptureCapture
OutputOutput
Buildings
Streets
Reality
Customers
Any GIS should be capable of the following fundamental operations in order to be useful for finding solutions to real-world problems.
Capturing dataA GIS must provide methods for inputting geographic (coordinate) and tabular (attribute) data. The more input methods available, the more versatile the GIS.
Storing dataThere are two basic data models for geographic data storage: vector and raster. A GIS should be able to store geographic data in both models.
Querying dataA GIS must provide utilities for finding specific features based on location or attribute value.
Analyzing dataA GIS must be able to answer questions regarding the interaction of spatial relationships between multiple datasets.
Displaying dataA GIS must have tools for visualizing geographic features using a variety of symbology.
OutputA GIS must be able to display results in a variety of formats, such as maps, reports, and graphs.

Introduction to ArcGIS I 2-5Exploring GIS concepts
2-5Introduction to ArcGIS ICopyright © 2000–2004 ESRI. All rights reserved.
Capturing data
480585.5, 3769234.6
483194.1, 3768432.3
485285.8, 3768391.2
484327.4, 3768565.9
483874.7, 3769823.0
480585.5, 3769234.6
483194.1, 3768432.3
485285.8, 3768391.2
484327.4, 3768565.9
483874.7, 3769823.0
Hardcopy mapsHardcopy maps
GPSGPS
GISDataCoordinatesCoordinates
Digital dataDigital data
Because the geographic database is the expensive and long-lived component of the GIS, data entry is an important consideration. ArcGIS integrates a variety of data types from a variety of sources, so it provides multiple data entry options. ArcGIS offers efficient data entry methods for automating paper maps and other nondigital data sources. To take advantage of the vast collection of geographically referenced data that already exists in digital format, ArcGIS provides the most comprehensive data conversion capability of any GIS on the market. ArcGIS software’s integrative capabilities also allow data to be shared with other applications without the need for conversion.

Introduction to ArcGIS I 2-6Exploring GIS concepts
2-6Introduction to ArcGIS ICopyright © 2000–2004 ESRI. All rights reserved.
Storing dataVector formats
Discrete representations of reality
Raster formatsUse square cells to model reality
Reality(A highway)
X,Y
Rows
Columns
X,Y
X,Y X,Y X,Y
You can represent geographic features in vector or raster format.
Vector dataThe vector data model represents geographic features much the same way maps do—using points, lines, and areas. An x,y (Cartesian) coordinate system references real-world locations.
Raster dataInstead of representing features by their x,y coordinates, the raster data model assigns values to cells that cover coordinate locations. Raster format is well-suited to spatial analysis and is also appropriate for storing data collected in grid format. The amount of detail you can show for a particular feature depends on the size of the cells in the grid. This makes raster data inappropriate for applications where discrete boundaries must be known, such as parcel management.

Introduction to ArcGIS I 2-7Exploring GIS concepts
2-7Introduction to ArcGIS ICopyright © 2000–2004 ESRI. All rights reserved.
QueryIdentifying specific features
Identifying features based on conditions
Florida counties with a population greater than 300,000
Florida counties with a population greater than 300,000
Identifying specific featuresOne common type of GIS query is to determine what exists at a particular location. In this type of query, the user understands where the features of interest are but wants to know whatcharacteristics are associated with them. This can be accomplished with GIS because the spatial features are linked to the descriptive characteristics.
Identifying features based on conditionsAnother type of GIS query is to determine the locations that satisfy certain conditions. In this case, the user knows what characteristics are important and wants to find out where the features are that have those characteristics.

Introduction to ArcGIS I 2-8Exploring GIS concepts
2-8Introduction to ArcGIS ICopyright © 2000–2004 ESRI. All rights reserved.
AnalysisWhich parcels are within 50 feet of the road?
Which parcels are within 50 feet of the road?
Well type DrilledBuilding owner SmithSoil type Sandy
Well type DrilledBuilding owner SmithSoil type Sandy
ProximityProximity
OverlayOverlay
NetworkNetwork
You can perform analysis to obtain the answers to a particular question or find solutions to a particular problem. Geographic analysis usually involves more than one geographic dataset and requires the analyst to proceed through a series of steps to reach a result. Three common types of geographic analysis are:
Proximity analysis• How many houses lie within 100 meters of this water main?• What is the total number of customers within 10 kilometers of this store?• What proportion of the alfalfa crop is within 500 meters of the well?To answer such questions, GIS technology uses a process called buffering to determine the proximity between features.
Overlay analysis An overlay process combines the features of two layers to create a new layer that contains the attributes of both. This resulting layer can be analyzed to determine which features overlap or to find out how much of a feature is in one or more areas. An overlay could be done to combine soil and vegetation layers to calculate the area of a certain vegetation type on a specific type of soil.
Network analysisThis type of analysis examines how linear features are connected and how easily resources can flow through them.

Introduction to ArcGIS I 2-9Exploring GIS concepts
2-9Introduction to ArcGIS ICopyright © 2000–2004 ESRI. All rights reserved.
Display
MapsMaps
GraphsGraphs
ReportsReports
For many types of geographic operations, the end result is usually best visualized as a map or graph. Maps are efficient for storing and communicating geographic information. Cartographers have created maps for millennia, but GIS provides new and exciting tools to extend the art and science of cartography. Maps can be integrated with reports, three-dimensional (3D) views, photographic images, and other digital media. This topic is discussed in greater detail in Lesson 3.

Introduction to ArcGIS I 2-10Exploring GIS concepts
2-10Introduction to ArcGIS ICopyright © 2000–2004 ESRI. All rights reserved.
Output
Florida.mxd
DocumentDocument
InternetInternetPaper mapPaper map
GIS Data
Florida.jpg
ImageImage
Sharing the results of your geographic labor is one of the primary justifications for investing resources in GIS. A powerful method for sharing displays created through a GIS is to output them into a distributable format. The more output options a GIS can offer, the greater the potential for reaching the right audience with the right information.

Introduction to ArcGIS I 2-11Exploring GIS concepts
2-11Introduction to ArcGIS ICopyright © 2000–2004 ESRI. All rights reserved.
Organizing spatial data
A GIS works with thematic layers of spatial data
Answer questions by comparing different layers of data
Organizing spatial dataA GIS organizes and stores information about the world as a collection of thematic layers that can be linked by geography. Each layer contains features with similar attributes, like streets and cities, that are located in the same geographic extent. This simple, but powerful and versatile, concept has proven invaluable for solving real-world problems from tracking delivery vehicles to modeling global atmospheric circulation.
The onion analogyThink of the world as a large onion. When you peel an onion, you see that it is composed of many layers. Real-world entities can be seen the same way; the earth can be ‘peeled’ into many layers, each representing a different theme. For example, you can put all the streets in one layer and all the landuse areas in another layer. As you can imagine, the earth’s complexity allows you to create as many layers as you want. The question then becomes how to best organize these real-world entities into manageable geometric shapes (point, line, area) and store them digitally.

Introduction to ArcGIS I 2-12Exploring GIS concepts
2-12Introduction to ArcGIS ICopyright © 2000–2004 ESRI. All rights reserved.
Representing features in vector data
Real-world entities are abstracted into three basic shapes
Points Points
Retail storesRetail stores
LinesLines
StreetsStreets
Areas/PolygonsAreas/Polygons
Land usesLand uses
Abstracting real-world entitiesIt is impossible to capture everything from reality inside a computer. Instead, GIS users must somehow abstract real-world phenomena, or entities, into a geometric representation of those entities. There are three basic geometric shapes used for geographic features: points, lines, and areas. These shapes can be called geometric objects, geometric features, or feature types.Note that there are different methods of making these entities digital, including scanning and digitizing.

Introduction to ArcGIS I 2-13Exploring GIS concepts
2-13Introduction to ArcGIS ICopyright © 2000–2004 ESRI. All rights reserved.
Map scaleMap scale determines the size and shape of features
city
1:5001:500 1:240001:24000
Large scaleSmaller areaMore detail
Large scaleSmaller areaMore detail
1:2500001:2500001:240001:24000
Small scaleLarger areaLess detail
Small scaleLarger areaLess detail
city
Map scale is an important but often misunderstood concept in cartography. To represent a portion of the earth’s surface on a map, the area must be reduced. The extent of this reduction is expressed as a ratio called map scale. Map scale is the ratio of map distance to ground distance.For example, if you draw a 4.8-km road as a 20-cm line on your map, the following statements would describe the map scale:20 cm : 4.8 km, 20 cm : 480,000 cm, 1 cm : 24,000 cm, 1 : 24,000The latter is known as a representative fraction (RF) because the values on either side of the colon represent the proportion between distance on the map and distance on the ground; that is, “1:24,000” means “1 map inch represents 24,000 ground inches”, “1 map meter represents 24,000 ground meters”, or “1 map centimeter represents 24,000 ground centimeters”, and so on.Map scale can be expressed in several different manners: as a fraction (1:24,000), as a verbal statement (one centimeter equals one kilometer), or as a bar.Map scale indicates how much a given distance was reduced to be represented on a map. For maps with the same paper size, features on a small-scale map (1:1,000,000) look smaller than those of a large-scale map (1:1,200). In other words, a dime-sized lake on a large scale map (l:1,200) would be less than the size of the period at the end of this sentence on a small-scale map (1:1,000,000).In general, small-scale maps depict large ground areas, but they have low spatial resolution, showing little detail. On the other hand, large-scale maps depict small ground areas but have high spatial resolution, showing many details. The features on large-scale maps more closely represent real-world features because the extent of reduction is lower than that of a small-scale map. As map scale decreases, features must be smoothed and simplified or not shown at all. For example, at a scale of 1:63,360 (in which 1 inch = 1 mile), it is difficult to represent area features smaller than 1/8th of a mile long or wide because they will be 1/8th of an inch long or wide on a map.

Introduction to ArcGIS I 2-14Exploring GIS concepts
2-14Introduction to ArcGIS ICopyright © 2000–2004 ESRI. All rights reserved.
Components of geographic dataThree general components to geographic information
Each feature corresponds to a record in the attribute table
AttributesAttributesGeometryGeometry
Streets
BehaviorBehavior
Streets and highways may not intersect
Rules:
GeometryGeometry represents the geographic features associated with real-world locations. Geographic features are abstracted into points, lines, or areas.
AttributesAttributes provide descriptive characteristics of the geographic features.
BehaviorBehavior means geographic features can be made to follow certain types of editing, display, or analysis rules, depending on circumstances defined by the user.

Introduction to ArcGIS I 2-15Exploring GIS concepts
2-15Introduction to ArcGIS ICopyright © 2000–2004 ESRI. All rights reserved.
Using spatial relationships
The relative position of features determines relationships
Topology mathematically models connectivity, adjacency, and coincidence
I-80 connects San Francisco and New York
I-80 connects San Francisco and New York
San Francisco is contained by California
San Francisco is contained by California
I-80 has lengthand direction
I-80 has lengthand direction
New York is adjacent to the Atlantic Ocean
New York is adjacent to the Atlantic Ocean
The relationships between features on a map, or where they are located in space relative to one another, communicates important information. Connectivity, adjacency, and containment are types of spatial relationships shown in the graphic above. Interstate 80 connects San Francisco with New York City. San Francisco is adjacent to the Pacific Ocean, and California is withinthe USA. Features may also have coincidence; for example, California and Nevada are both separate polygons, yet each has a common boundary line in the exact same space as the other, these lines are seen to be coincident. The spatial relationships between connecting, coincident, or adjacent features in a geographic data layer are often referred to as topologic relationships. Topology is the branch of geometry that deals with the properties of features that remain unchanged even when the features are bent, stretched, or otherwise distorted. ArcGIS uses these spatial relationships and feature properties like area, length, and direction to identify complex spatial patterns.

Introduction to ArcGIS I 2-16Exploring GIS concepts
2-16Introduction to ArcGIS ICopyright © 2000–2004 ESRI. All rights reserved.
ArcGIS Desktop ProductsTools and database functionalities vary between ArcGIS products
ArcViewArcView ArcEditorArcEditor ArcInfoArcInfo
M o r e F u n c t i o n a l i t y
The ArcGIS Desktop includes a suite of integrated applications: ArcMap, ArcCatalog, and ArcToolbox and Geoprocessor interfaces. Using these applications together, you can perform any GIS task, simple to advanced, including mapping, data management, geographic analysis, data editing, and geoprocessing. In addition, ArcGIS allows you to tap in to an abundance of spatial data and resources available through ArcIMS services on the Internet or stored in an ArcSDE® database. The ArcGIS Desktop is a comprehensive, integrated, scalable system designed to meet the needs of a wide range of GIS users.The ArcGIS Desktop can be accessed using three software products, each providing a higher level of functionality. ArcView provides comprehensive mapping and analysis tools along with simple editing and geoprocessing tools. ArcEditor includes the full functionality of ArcView, plus advanced editing capabilities. ArcInfo extends the functionality of both to include advanced geoprocessing and also includes the applications for ArcInfo Workstation (Arc, ARCPLOT™, ARCEDIT™, and so on). Because the ArcGIS products all share a common architecture, users working with any of these clients can share their work with other users. Maps, data, symbology, map layers, custom tools and interfaces, reports, metadata, and so on, can be accessed interchangeably in all three products. Much more information about the entire ESRI product line can be found at http://www.esri.com.

Introduction to ArcGIS I 2-17Exploring GIS concepts
2-17Introduction to ArcGIS ICopyright © 2000–2004 ESRI. All rights reserved.
Overview of applicationsAll ArcGIS products share common applicationsArcMap, ArcCatalog
ArcToolbox and Command Line windows
All ArcGIS products (ArcView, ArcEditor, and ArcInfo) are comprised of the ArcMap and ArcCatalog applications, both of which contain the Toolbox and Geoprocessing windows. ArcMap is the application for performing analysis and making maps. ArcCatalog is a tool for accessing and managing your data. ArcToolbox contains tools for data conversion and management. The Geoprocessing window allows you to write, import and run scripts, and access individual commands.

Introduction to ArcGIS I 2-18Exploring GIS concepts
2-18Introduction to ArcGIS ICopyright © 2000–2004 ESRI. All rights reserved.
ArcMapPrimary display applicationPerform map-based tasks
Displaying
Editing
Querying
Analyzing
Charting
Reporting
ArcMap provides tools for creating visual displays of your data, querying, and creating presentation-quality maps. ArcMap makes it easy to lay out your maps for printing, embedding in other documents, or electronic publishing. It also includes analysis, charting, reporting functions, and a comprehensive suite of editing tools for creating and editing geographic data. When you save a map, all of your layout work, symbols, text, and graphics are automatically preserved. ArcMap is the primary ArcGIS application for displaying, querying, editing, creating, and analyzing data.

Introduction to ArcGIS I 2-19Exploring GIS concepts
2-19Introduction to ArcGIS ICopyright © 2000–2004 ESRI. All rights reserved.
ArcCatalogA window into your databaseBrowse your dataManage your dataCreate and view data documentation (metadata)
The ArcCatalog application helps you organize and manage all your GIS data. It includes tools for browsing and finding geographic information, recording and viewing metadata, quickly viewing any dataset, and defining the schema structure for your geographic data layers.

Introduction to ArcGIS I 2-20Exploring GIS concepts
2-20Introduction to ArcGIS ICopyright © 2000–2004 ESRI. All rights reserved.
ArcToolbox WindowAvailable in ArcCatalog and ArcMapGeographic processing functions
Data management, analysis, and conversionTools vary between ArcGIS products
The ArcToolbox window provides you with tools for data conversion, managing coordinate systems, changing map projections, and more. ArcToolbox supports easy-to-use drag-and-drop operations from ArcCatalog; with ArcMap, you need to browse to or type in the variables. For ArcInfo users, ArcToolbox provides additional and more sophisticated data conversion and spatial analysis tools.

Introduction to ArcGIS I 2-21Exploring GIS concepts
2-21Introduction to ArcGIS ICopyright © 2000–2004 ESRI. All rights reserved.
Getting helpTabs
Contents IndexSearchFavorites
Other helpWhat’s this?Tool tipsOnline Support
The ArcGIS Desktop Help provides several methods for finding the help you need to use the software most productively. The Contents tab lets you search for information by topic. The Index tab lets you search for topics containing words from the Help index, such as Layer or Table. The Search tab lets you search the Help document for a word you specify. The Favorites tab lets you store your favorite help topics so you can easily access them when needed. Your word does not have to be in the index in order to search the document for it, but the search will take longer if it is not in the index.In ArcCatalog, ArcMap, and ArcToolbox, button and tool names are displayed when you move the mouse over them (these are called ToolTips). You can also click the What’s This? tool in ArcMap or ArcCatalog and then click on a button or tool to access additional help about it (this is called context-sensitive help). For applications like ArcMap that have graphical user interfaces, context-sensitive help is useful for finding out what all the various buttons and tools do.Selecting the ESRI Support Center link will connect you with a wealth of additional online resources. The Web site URL is http://support.esri.com.

Introduction to ArcGIS I 2-22Exploring GIS concepts
2-22Introduction to ArcGIS ICopyright © 2000–2004 ESRI. All rights reserved.
DemonstrationObserve ArcCatalog
Directory structure and navigation
Documentation
Observe ArcMapAdd data
Display and query data
Zoom and Pan tools
Save a map document
Observe ArcToolbox windowToolkits
At this point, your instructor may choose to demonstrate some of the concepts discussed in this lesson. You will also be introduced to the ArcGIS applications you will use for the remainder of the class.

Introduction to ArcGIS I 2-23Exploring GIS concepts
2-23Introduction to ArcGIS ICopyright © 2000–2004 ESRI. All rights reserved.
Exercise 2 overviewUse the software to:
Start ArcMap
Examine some feature layers and their organization
Identify relationships between geographic features
Associate descriptive information with a layer
Identify specific features
Select geographic features based on certain conditions
Challenge: Work with queries

Introduction to ArcGIS I 2-24Exploring GIS concepts
2-24Introduction to ArcGIS ICopyright © 2000–2004 ESRI. All rights reserved.
Lesson 2 reviewWhat are the five components of a GIS?
Geographic objects in vector data can be abstracted into what three geometric shapes?
Match the geographic data component with its correct definition.I. Geometry a. Rules allowing certain functionality for
particular featuresII. Attributes b. Descriptive information about spatial featuresIII. Behavior c. The physical (coordinate) representation of
spatial features

Introduction to ArcGIS I 2-25Exploring GIS concepts
2-25Introduction to ArcGIS ICopyright © 2000–2004 ESRI. All rights reserved.
Lesson 2 reviewThe vector storage model uses a series of equal-sized cells. (T/F)
Vector data is always more accurate than raster data. (T/F)
Topology models the spatial relationships of connectivity, adjacency, and coincidence. (T/F)
ArcCatalog is used for data analysis, viewing, querying, and editing data. (T/F)
What are the six functions that a GIS should perform?

Introduction to ArcGIS I 2-26Exploring GIS concepts
2-26Introduction to ArcGIS ICopyright © 2000–2004 ESRI. All rights reserved.

����
����
�������������������� ��������������������������������
����� �������
��������������� �� ����������������� ������������������������� ������������������������������ �� ����� ��!���������� ��"���� ��#����$�$�������%&�����'��������(�)'* ��+����$�������������� ��,-.��$���%��/��/ ��,,��$��������������������� ��, ��%�&�$�������� ��,�'���$�$����%�&�������� ��,�0��&���������������&�� ��, '����$�����������1��� ��,!
��������%�&�$��������� ��,"���&���$�1��&��������&��� ��,#���&���$�1������������&��� ��,+0���$���&�����&� �� -'���$�$���������������������&��� �� ,0����$�������������� �� 23������������� �� �������������� �� �


Introduction to ArcGIS I 3-1Displaying data
Copyright © 2000–2004 ESRI. All rights reserved. Introduction to ArcGIS I
Displaying data
Introduction to ArcGIS I 3-2Displaying data
3-2Introduction to ArcGIS ICopyright © 2000–2004 ESRI. All rights reserved.
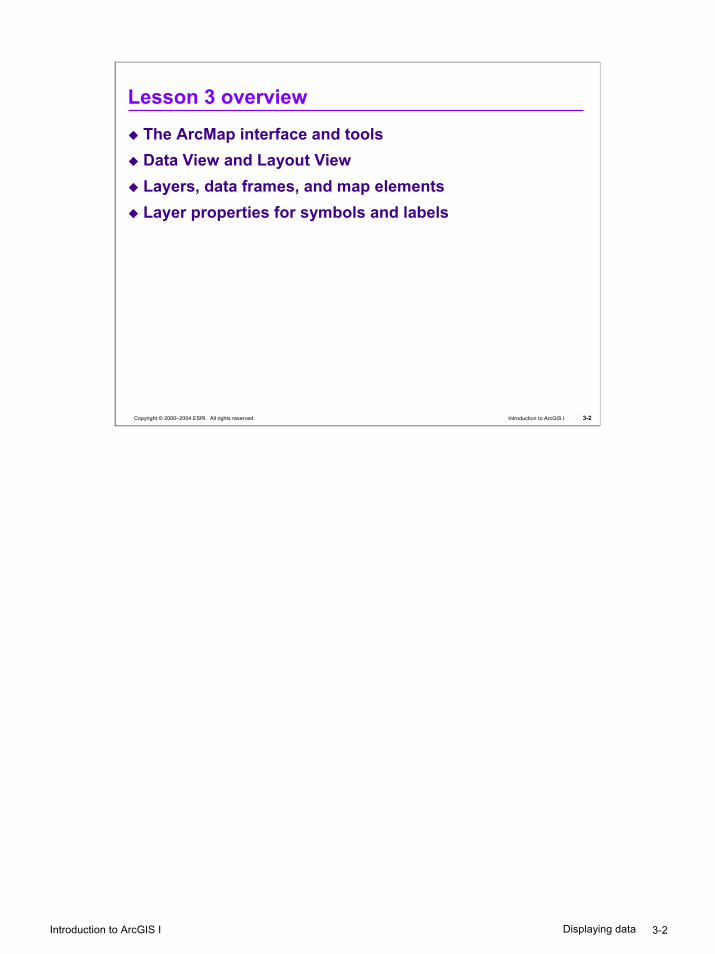
Lesson 3 overviewThe ArcMap interface and toolsData View and Layout ViewLayers, data frames, and map elementsLayer properties for symbols and labels

Introduction to ArcGIS I 3-3Displaying data
3-3Introduction to ArcGIS ICopyright © 2000–2004 ESRI. All rights reserved.
The ArcMap interface
Display area
Display area
Table of ContentsDockable
Context menu
Draw toolbarStatus bar
Standard toolbarMenu barTitle bar
Tools toolbar Tear-off and dockable
Tools toolbar Tear-off and dockable
Features of the ArcMap interface• The Title bar displays the map name (EuropeOnly.mxd in the example above).• The toolbars are dockable.• The Table of Contents lists the Data Views and layer legends. The Table of Contents is
dockable and can be resized by horizontally dragging the vertical divider between the Table of Contents and the display area.
• The display area is where the map features draw.• The Status bar, besides reporting the coordinates, displays a description of the selected
buttons and menu items.

Introduction to ArcGIS I 3-4Displaying data
3-4Introduction to ArcGIS ICopyright © 2000–2004 ESRI. All rights reserved.
Data View or Layout View?Data View
For display, queries, editing, and analysisLayout View
For creating map layouts
Data ViewData View
Layout ViewLayout View
Data ViewYou will work in Data View if you want to display, query, edit, explore, and analyze data.
Layout ViewWhen you choose to create a hard copy map, you need to move to the Layout View. This view is where you add all the other map elements, such as the north arrow, legend, scale, title, and other textual information (e.g., author, data date, map date, projection type). Once the map is complete, you can send it to a plotter or printer or export it as a graphic file.

Introduction to ArcGIS I 3-5Displaying data
3-5Introduction to ArcGIS ICopyright © 2000–2004 ESRI. All rights reserved.
LayerRepresent symbolized spatial data
Data frameOrganizes layers
Map contains
Data frames
Layers
Map elements
Data frameData frame
Layers, data frames, and maps
LayersLayers
Layers, data frames, and mapsLayers store the path to a data source as well as the display properties of that data source. A data frame is a container for layers. When you create a new empty map, a default data frame named Layers is automatically added to the top of the Table of Contents, but you can highlight and change its name. In the example above, the data frame name was changed to Europe. Like the layers they contain, data frames also have properties that you can manipulate.A map is the document that stores the data frames, layers, and any map elements such as graphics and text. A map may contain several data frames. For example, you might create a map that contains one data frame with layers that show an entire country and another data frame that displays layers of a particular region.

Introduction to ArcGIS I 3-6Displaying data
3-6Introduction to ArcGIS ICopyright © 2000–2004 ESRI. All rights reserved.
Layers
Reference spatial data sourcesSet symbols, labels, and other propertiesManipulate through context menu
LayersA layer does not store the actual geographic data but instead references the data contained in the data source. Data sources can be any of the following:• Vector datasets (feature layers): Coverages, shapefiles, CAD files, geodatabase, and ArcSDE
databases• Annotation and Dimensions• Raster datasets (raster layers): Grids and images• TIN datasets: Triangulated Irregular Networks—these model 3D dataReferencing data in this way allows the layers on a map to automatically reflect the most up-to-date information in your GIS database.Layers are stored as part of a saved map document (.mxd file), but they can also be saved as independent files themselves. Layer files (.lyr files) are an efficient method of predefining symbology and other properties, allowing you to set and share standard display options for specific data sources.

Introduction to ArcGIS I 3-7Displaying data
3-7Introduction to ArcGIS ICopyright © 2000–2004 ESRI. All rights reserved.
Data frames
Data frames are containers for layersMaps can have many data frames
Index and inset maps
Arrange in Layout View
Add from Insert menuActivate data frames to view from context menu
Data framesData frames let you organize your data into logical groupings, such as themes or geographic areas. You may want to consider using multiple data frames when you want to compare layers side by side or create insets and overviews that highlight a particular location.You can add as many layers as you want to a data frame; however, a data frame containing too many layers can be more difficult to work with. You may want to consider multiple data frames organized by theme or geography when you have numerous layers.When a map has more than one data frame, one of them is the active data frame. The active data frame is the one you are currently working with in the ArcMap display. For example, when you add a new layer to a map, it gets added to the active data frame. You can always tell which data frame is active because its name is shown in bold text in the Table of Contents. Of course, if a map has only one data frame, it is always the active one.To make a data frame active, right-click on the data frame and click Activate. The active data frame appears in bold font in the Table of Contents. A data frame can also be activated in the Layout View when you use your mouse to select it from the page.

Introduction to ArcGIS I 3-8Displaying data
3-8Introduction to ArcGIS ICopyright © 2000–2004 ESRI. All rights reserved.
MapsHold layers, data frames, graphics, map elements Store information in a map document (MXD) file
MapsThe ArcMap document helps you visualize geographic information by showing you the location of features, which are symbolized to help you understand what they are and why they are being shown. A map can include additional information, such as graphics and map elements, that help explain its context and purpose. When you open a map document, ArcMap checks the links to the data sources. If it cannot find some data (i.e., if the source data for a layer has been deleted or renamed or if a network drive is not accessible), it does not display. The layer is still part of the map, and its name appears in the Table of Contents, but a small red exclamation mark appears right of the layer symbol.When you work in ArcMap, you are always working within an ArcMap document. The ArcMap document (MXD) lets you save the display of your data.

Introduction to ArcGIS I 3-9Displaying data
3-9Introduction to ArcGIS ICopyright © 2000–2004 ESRI. All rights reserved.
Managing the Table of Contents (TOC)Drag layers up or down to change display order
Smart defaults for layer draw orderPoint, lines, or polygons
Layers draw in the TOC in order From the bottom up
Rename data frames and layers
Remove layers
Bottom tabsDisplay
Source
Managing the Table of Contents The Table of Contents lists all the data frames and thematic layers on the map and shows the symbols used to represent the features in each layer. A check box next to a layer indicates whether it is currently visible on the map. Layers at the top of the Table of Contents draw on top of layers listed below them. Learning how to manage layers and frames within the Table of Contents helps you represent your data effectively and efficiently.The draw order of layers within a data frame is from the bottom to the top, so you put those layers that form the background of your map, such as the ocean, at the bottom of the Table of Contents. ArcMap is smart enough to display a point feature class on top of a polygon feature class.To change the order of display, click the layer and drag it up or down the Table of Contents to a new location.You can copy and paste layers within the same data frame or into a different data frame.Layers can be removed by right-clicking on the layer and clicking Remove from the context menu.

Introduction to ArcGIS I 3-10Displaying data
3-10Introduction to ArcGIS ICopyright © 2000–2004 ESRI. All rights reserved.
Moving around the mapZoom in or out
Pan the display
Full extents
Back or forward one display
Zoom to a layer
Zoom to selected features
Moving around the mapAs you work with a map, you can easily change how you view the data it contains. When you are just browsing a map, you might want to pan and zoom around the data to investigate different areas and features. When you are creating a map to use in the field, displaying data at a specific scale may be important in order to keep ground measurement computations simple.Most of the tools for navigating your data are found on the Tools toolbar; others are located on the layer context menus.
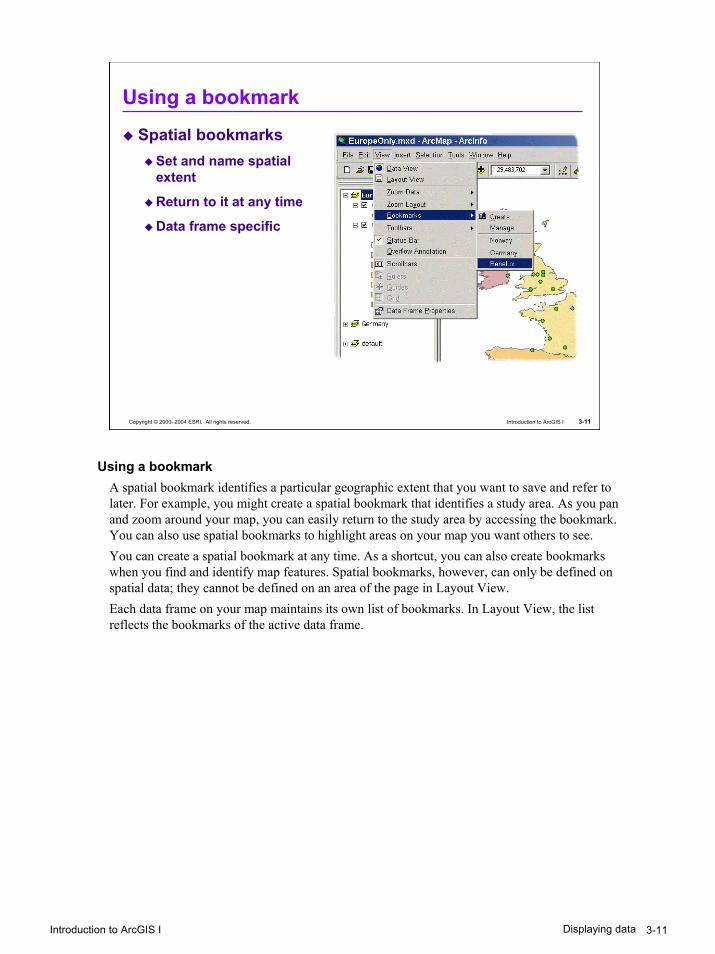
Introduction to ArcGIS I 3-11Displaying data
3-11Introduction to ArcGIS ICopyright © 2000–2004 ESRI. All rights reserved.
Using a bookmarkSpatial bookmarks
Set and name spatial extent
Return to it at any time
Data frame specific
Using a bookmarkA spatial bookmark identifies a particular geographic extent that you want to save and refer to later. For example, you might create a spatial bookmark that identifies a study area. As you pan and zoom around your map, you can easily return to the study area by accessing the bookmark. You can also use spatial bookmarks to highlight areas on your map you want others to see.You can create a spatial bookmark at any time. As a shortcut, you can also create bookmarks when you find and identify map features. Spatial bookmarks, however, can only be defined on spatial data; they cannot be defined on an area of the page in Layout View.Each data frame on your map maintains its own list of bookmarks. In Layout View, the list reflects the bookmarks of the active data frame.

Introduction to ArcGIS I 3-12Displaying data
3-12Introduction to ArcGIS ICopyright © 2000–2004 ESRI. All rights reserved.
Magnifier and overview windowsSee more detail or overview without changing display
Move over display like a magnifying glass
Shows full extent of data plus extent of Data View
Magnifier and overview windowsWhen you do not want to adjust your map display, but you want to see more detail or get an overview of an area, open another window. ArcMap provides two additional ways to explore the spatial data on your map: an overview window and a magnifier window. The magnifier window works like a magnifying glass; as you pass the window over the data, you see a magnified view of the location under the window. Moving the window around does not affect the current map display. The overview window shows you the full extent of the data. A small box in the overview window represents the currently displayed area on the map. You can move this box around to pan the map and shrink or enlarge it to zoom in or out. Both windows operate only in Data View.

Introduction to ArcGIS I 3-13Displaying data
3-13Introduction to ArcGIS ICopyright © 2000–2004 ESRI. All rights reserved.
Labeling featuresLabel features dynamically using attribute valuesLayer properties control appearance and positionConvert labels to annotation features
Labeling featuresWhen you label features on a map, readers can quickly identify them and more easily interpret the map. In ArcMap, you can label features using their attributes or by entering text on the map interactively. Choosing which features are labeled, where the labels are placed, and setting the label display scale can impact whether the right information is conveyed to the reader and can affect the overall legibility of the map.The graphic characteristics of a label symbol can impact the legibility of your text and imply specific meanings. For instance, hydrologic features are typically labeled with blue italicized text. ArcMap gives you significant choice and control over the label symbols you use.Where you place text labels depends on the text font, text size, text position, map scale, and the number of features that need to be labeled. To help you with this task, ArcMap provides tools for controlling the placement, size, map scale, and many other qualities of label text. Labels and the parameters you set for their display are stored within the layer properties and are only available when you add the layer to your ArcMap session. In addition, labels may dynamically shift position as you change your Data View (i.e., zoom in and out or pan), in order to achieve a ‘best fit’ based on any conflict rules you may have set.
AnnotationUnlike labels, annotation is stored as a new layer or feature class in ArcGIS. When you create annotation, you have the option of storing the layer within the map document or as a new feature class in the geodatabase. Once created, annotation features do not move dynamically in the display when you move around the map but remain in a fixed location. In addition, converting labels to annotation allows you to control the placement and/or change the font type for each individual text element.

Introduction to ArcGIS I 3-14Displaying data
3-14Introduction to ArcGIS ICopyright © 2000–2004 ESRI. All rights reserved.
Changing symbol propertiesSymbology tab or Table of Contents
Right-click
Left-click
Changing symbol propertiesArcMap makes it easy to change both a layer’s symbol color (right-click on the symbol) or the symbol itself (click on the symbol).Although ArcMap allows you to choose many symbols and colors, it is important to remember that too many symbols or colors in a map can be distracting. The symbology you choose for displaying layers greatly affects how readers interpret the map. Learning how to display your layers clearly and efficiently helps your audience understand your data and may also reveal patterns not otherwise apparent.

Introduction to ArcGIS I 3-15Displaying data
3-15Introduction to ArcGIS ICopyright © 2000–2004 ESRI. All rights reserved.
Scale-dependent displayDisplay layers at specific scale range
Reduces clutter
Reduces drawing time
Layer display property
1 : 25,000,000
1 : 5,000,000
1 : 500,000
Scale-dependent displayFor each layer in your map, you can set a scale range at which ArcMap displays that layer. Setting a display scale lets you avoid needless clutter on your map by restricting the display of features until an appropriate scale is reached—one with information that is useful to the reader.Two methods are available for setting the scale range:
• Use the Zoom tools to interactively set the display to the minimum scale to which the layer will be drawn. Right-click on the layer and click Visible Scale Range > Set Minimum Scale. Adjust the display scale and repeat to set the Maximum Scale.
• Right-click the layer; then click Properties. On the Properties dialog, click the Generaltab and set the scale range as shown in the figure above.
You can set a layer’s properties so that its features display only if the map extent falls within a certain scale range. The Table of Contents shows a grayed-out check box when the map is outside the scale range for that layer.

Introduction to ArcGIS I 3-16Displaying data
3-16Introduction to ArcGIS ICopyright © 2000–2004 ESRI. All rights reserved.
Creating a definition queryBuild a query based on attributes
Only displays queried features
Does not affect source
Definition queriesDefinition queries can be used to select specific features within a layer, and they only display items that satisfy the condition. Queries are defined under the Definition Query tab in the Layer Properties dialog; simply click the Query Builder button to write a query.After applying the built query string, only the features that meet the query criteria appear in the display area. Although only the features that satisfy the query are displayed, the source data remains intact and unchanged. The remaining features are just hidden from view. It is important to emphasize that this is different than a selection in ArcMap (whether spatial or attribute) where all features in the layer remain displayed, except that the selected features appear ‘selected’ with blue outlines.

Introduction to ArcGIS I 3-17Displaying data
3-17Introduction to ArcGIS ICopyright © 2000–2004 ESRI. All rights reserved.
Layer symbology in ArcMapSame symbol for all features
Based on attribute values
Thematicclassification
methods
Layer symbology in ArcMapDrawing properties can be set within the Symbology tab of the layer’s Layer Properties dialog.In the Show panel of the Symbology tab, ArcMap has several options for creating both qualitative and quantitative thematic maps. When you chose a certain method, the properties options to the right of the Show panel change according to the type of thematic mapping method used.

Introduction to ArcGIS I 3-18Displaying data
3-18Introduction to ArcGIS ICopyright © 2000–2004 ESRI. All rights reserved.
Displaying qualitative valuesFeatures
Categories
Display qualitative valuesOften, seeing where something is—and where it is not—can tell you exactly what you need to know. Mapping the location of features reveals patterns and trends that can help you make better decisions. The easiest way to see where features are is to draw them using a single symbol. You can draw any type of data this way. When you create a new layer, ArcMap draws it with a single symbol by default. A category describes a set of features with the same attribute value. For example, given parcel data with an attribute describing land use (e.g., residential, commercial, and public areas), you can use a different symbol to represent each unique landuse type. Drawing features this way allows you to see where features are and what category they belong to. This can be useful if you are targeting a specific type of feature for some action or policy. For instance, a city planner might use the landuse map to target areas for redevelopment.In general, look for these kinds of attributes when mapping by category or unique value:
• Attributes describing the name, type, or condition of a feature
• Attributes containing measurements or quantities that are already grouped (e.g., “0–99” or “100–199”)
• Attributes that uniquely identify features (e.g., a county name attribute could be used to draw each county with a unique color)
You can let ArcMap assign a symbol to each unique value based on a color scheme you choose, or you can explicitly assign a specific symbol to a specific attribute value.

Introduction to ArcGIS I 3-19Displaying data
3-19Introduction to ArcGIS ICopyright © 2000–2004 ESRI. All rights reserved.
Displaying quantitative valuesQuantities
Charts
Display quantitative valuesWhen you want your map to communicate how much of something there is, you need to draw features using a quantitative measure. This measure might be a count, a ratio (such as a percentage), or a rank (such as high, medium, or low). You can represent quantities on a map by varying the color or symbol size you use to draw features. For example, you might use increasingly darker shades of blue to represent increasingly higher rainfall amounts or larger circles to represent cities with larger populations. Generally, you need to classify your data when you display it. You can either manually define classes or apply one of the standard classification schemes to do so automatically—just specify the number of classes you want to show. Once you have defined the classes, you can add more classes, delete classes, or redefine class ranges.Pie charts, bar charts, and stacked bar charts can present large amounts of quantitative data in an eye-catching fashion. For example, if you are mapping population by county, you can use a pie chart to show the percentage of the population by ethnic group for each county. Generally, you will draw a layer with charts when your layer has a number of related numeric attributes that you want to compare. Use pie charts if you want to show how much of the total amount each category takes up. Use bar charts to show relative amounts rather than a proportion of a total.

Introduction to ArcGIS I 3-20Displaying data
3-20Introduction to ArcGIS ICopyright © 2000–2004 ESRI. All rights reserved.
Saving a layer fileSave symbology for use in other map documentsLayer files
.lyr extension
Save the display for a layer without saving an entire map document
Load into another map document
Preview in ArcCatalog
DefaultsymbologyDefault
symbologyCustomize symbology
Customize symbology In map document
(.mxd)In map document(.mxd)
SaveAs a separate layer (.lyr)
As a separate layer (.lyr)
SourcesSources
VectorRaster
TIN
Saving a layer fileIt takes time to analyze a data’s attributes and symbolize its features so people will readily understand the information within the data. Layers you create in ArcMap are stored as part of the map document file. After finalizing the symbolization and labeling of a layer, you can save it outside the map as a layer file. This layer file can be reused in other maps, or you can e-mail it along with the data to people, who want to add it to their maps.
How to save a layer outside a map1. In ArcMap, open the map containing the layer that you want to save as a layer file. 2. Right-click the layer in the map’s Table of Contents. 3. Click Save As Layer File. 4. Navigate to the folder in which you want to save the layer. 5. Type a name for the layer file. 6. Click Save.

Introduction to ArcGIS I 3-21Displaying data
3-21Introduction to ArcGIS ICopyright © 2000–2004 ESRI. All rights reserved.
Layers with misplaced source data
Click here to change the data source
Changing the data source for a layerMap documents can lose track of the source data
Source data gets moved or renamed
Use Source tab to change the data source for a layerShortcut: Right-click the layer > Data > Set Data Source
Changing the data source for a layerThe map document does not store the spatial data displayed in it; instead it stores references to the locations of the data sources. When a map document is opened, ArcMap reads the file and looks for all the path names to reconstruct the layers.When data sources are moved or renamed, map documents can lose track of the source data for its layers. When this occurs, the layer name appears in the ArcMap Table Of Contents with a red exclamation mark, and nothing appears for that layer in the display area.To correct this problem, access the Properties dialog for the ‘missing’ layer. Click the Source tab, and click Set Data Source. This brings up a browser to specify the new location of the data. Once done, the path to the data source is fixed, and the layer appears. Remember to save the map document so that the new path is saved as well. There is also a shortcut to help correct the path name for a data source. Right-click the layer, click Data in the context menu, and then click Set Data Source from the second context menu.

Introduction to ArcGIS I 3-22Displaying data
3-22Introduction to ArcGIS ICopyright © 2000–2004 ESRI. All rights reserved.
Setting ArcMap options Control default behaviors
Application startup screens
When resizing window
Table fonts
Layout rulers and grid spacing
Raster display
DGN compliance for CAD files
Table of Contents appearance
Geoprocessing environment settings
Setting ArcMap OptionsYou can adjust a number of default settings for ArcMap behaviors. For example, you might change the text size and font of your tables so that they are easier to read. You might also want to change the shape of the lines and patches that represent the features on a map in your Table of Contents. As shown on the slide above, you can add an additional tab to the bottom of your Table of Contents; the Selection Tab provides you with another method of turning selectable layers on or off (see also slide 4-10). Other settings include:
•Layout View: Setting snapping to grids or guides, turning on/off rulers and scroll bars
•Raster: Set default display colors for different bands from a wide variety of raster formats (particularly useful for remotely sensed or false color imagery)
•Geoprocessing: Set default disk storage locations or spatial reference for new dataYou access these options through the Tools menu > Options, located at the bottom of the list.

Introduction to ArcGIS I 3-23Displaying data
3-23Introduction to ArcGIS ICopyright © 2000–2004 ESRI. All rights reserved.
Exercise 3 overviewAdd layers to an ArcMap documentClassify and symbolize spatial dataCreate a definition queryLabel featuresSave layer properties to a layer fileCreate a map layout using Layout ViewChallenge: Save labels as annotation

Introduction to ArcGIS I 3-24Displaying data
3-24Introduction to ArcGIS ICopyright © 2000–2004 ESRI. All rights reserved.
Lesson 3 reviewWhat is a layer in ArcMap?
What is the difference between a layer and a layer file (.lyr)?
What is a data frame?
What is an ArcMap map document?
When would you set a display scale for your layers?
How do you remove a layer from ArcMap?
Describe two ways to rename a layer in ArcMap.
Map documents have an .mxb extension. (T/F)
You can have as many data frames active in ArcMap as you want. (T/F)

����
����
�������������������� ��������������������������������
������ �����������
��������������� �� ��������� �������� ���������� ���������������������� ������������������ �� !���������������������"���# ��$%����&�������"��������� ��'(���"��������� ��)*(���"����+������ ��))�����"��������"���������� ��) %��&��������"��� ��)�(���"��&����"�����,�������-���. ��)���"���������"����+������ ��)�(���"��&������"� ��)�
/��"���������++���������"� ��) 01�"����������� ��)$������������� ��)'


Introduction to ArcGIS I 4-1Querying your database
Copyright © 2000–2004 ESRI. All rights reserved. Introduction to ArcGIS I
Querying your database

Introduction to ArcGIS I 4-2Querying your database
4-2Introduction to ArcGIS ICopyright © 2000–2004 ESRI. All rights reserved.
Lesson 4 overviewTools for examining your data
Identify, Find, Measure, MapTips, hyperlinks
Working with the selection toolsWhy do you need a selection?
Available selection tools
Selection methods and layers
Spatial selection
Attribute selection
Calculating summary statistics

Introduction to ArcGIS I 4-3Querying your database
4-3Introduction to ArcGIS ICopyright © 2000–2004 ESRI. All rights reserved.
IdentifyingPopup attributes for a specific feature
i
Identify Features toolThis tool allows you to display the attributes for any feature you click on with your pointer.
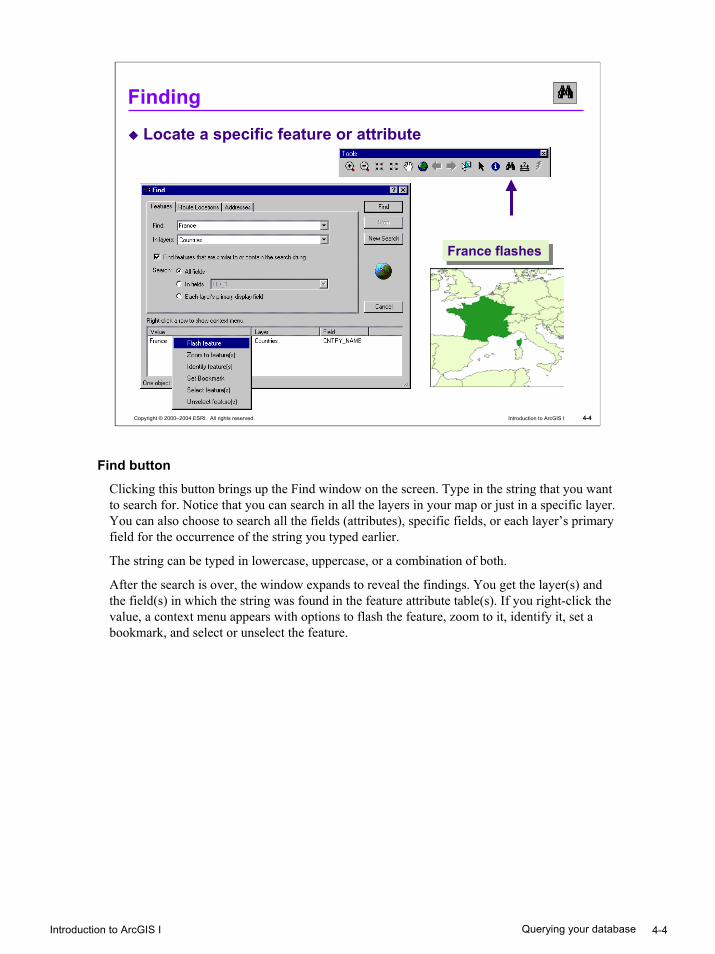
Introduction to ArcGIS I 4-4Querying your database
4-4Introduction to ArcGIS ICopyright © 2000–2004 ESRI. All rights reserved.
Finding
France flashesFrance flashes
Locate a specific feature or attribute
Find buttonClicking this button brings up the Find window on the screen. Type in the string that you want to search for. Notice that you can search in all the layers in your map or just in a specific layer. You can also choose to search all the fields (attributes), specific fields, or each layer’s primary field for the occurrence of the string you typed earlier.
The string can be typed in lowercase, uppercase, or a combination of both.
After the search is over, the window expands to reveal the findings. You get the layer(s) and the field(s) in which the string was found in the feature attribute table(s). If you right-click the value, a context menu appears with options to flash the feature, zoom to it, identify it, set a bookmark, and select or unselect the feature.

Introduction to ArcGIS I 4-5Querying your database
4-5Introduction to ArcGIS ICopyright © 2000–2004 ESRI. All rights reserved.
MeasuringFind linear distances
Measure toolUse the Measure tool to find distances on the map. The Measure tool allows you to draw a line on the map using your mouse. To start, click at a location, and as you move your mouse, a thick line appears on the map. A single-click adds a line segment, while a double-click ends the line. The status bar reports the length of each segment as it is created and the total length of the line when you are finished. All measurements use a pure Cartesian coordinate system, so use such measurement results with caution. You should expect some inaccuracy due to various factors when using this tool for small-scale measurements.

Introduction to ArcGIS I 4-6Querying your database
4-6Introduction to ArcGIS ICopyright © 2000–2004 ESRI. All rights reserved.
MapTips and hyperlinksDisplay property of a layer
MapTipsPointer location displays specific attribute
HyperlinksDocumentURLMacroMultiple links per feature
MapTips and hyperlinksIf you have MapTips set for a layer, when you move the mouse pointer over a feature in the layer, a rectangular box containing textual information appears.The MapTip text comes from a field in the attribute table of that layer. You have to set which field you want attribute values to be reported from when using the MapTips.You can display Web pages accessed over the Internet and documents (such as a text file or image) or run a macro (script). You can dynamically create hyperlinks as you browse your map, or you can store hyperlinks with your data in an attribute field.When you click on a feature, ArcMap determines which program is needed to display the hyperlink. If you specify a Web address, ArcMap launches your default Web browser and displays the page. If you specify a different type of document (e.g., a text document), ArcMap displays it using its native program (such as Notepad or another text editor). The Hyperlink Manager allows you to set more than one hyperlink per feature; these are called Dynamic Hyperlinks.If you are creating maps that people will access interactively or if you want to explore your data before you do analysis, MapTips and hyperlinks are useful ways to present more information about the map’s features.

Introduction to ArcGIS I 4-7Querying your database
4-7Introduction to ArcGIS ICopyright © 2000–2004 ESRI. All rights reserved.
Lesson 4 overviewTools for examining your data
Identify, Find, Measure, map tips, hyperlinks
Working with the selection toolsWhy do you need a selection?
Available selection tools
Selection methods and layers
Spatial selection
Attribute selection
Calculating summary statistics

Introduction to ArcGIS I 4-8Querying your database
4-8Introduction to ArcGIS ICopyright © 2000–2004 ESRI. All rights reserved.
Why do you need a selection?
Selectedfeatures
Use to select other featuresUse to select other features
Calculate statistics
Calculate statistics
Create a new layerCreate a
new layerEditEdit
Focusedanalysis
Focusedanalysis
Convert to graphics
Convert to graphics
ExportExportReportReport
Why do you need a selection?You may have several reasons why you would make a selection, including:• Using the selected set for further analysis• Using the selected set to select other features• Editing the selected set• Creating a new layer from the selected set (Working with a subset is faster than including
the entire set.)• Calculating statistics for the selected set• Creating a report• Exporting the selected set to a separate file• Converting features to a graphic format

Introduction to ArcGIS I 4-9Querying your database
4-9Introduction to ArcGIS ICopyright © 2000–2004 ESRI. All rights reserved.
Available selection toolsInteractive, attributes, location, graphics
Selected setSelected set
Available selection toolsThere are four ways to select graphics in ArcMap: interactively, by attribute, by location, and by graphics.
Interactive selection methodThis option offers different selection methods, including ‘create a new selection’, ‘add to current selection’, ‘remove from current selection’, and ‘select from current selection’. Options further refine the interactive selection methods, which include selecting features that are spatially or completely within the box or graphic, selecting features that are completely within the box or graphic, and selecting features that the box or graphic are completely within.
Select by attributesWith this option, you can write a selection statement. The search is done on the records in the feature attribute table based on the selection criteria typed in the selection statement. Because all features are linked to their respective records in the feature attribute table, ArcMap is able to select the features based on their attributes.
Select by locationHere, features from a certain layer can be selected by features from another. This is considered a spatial query tool.
Select by graphicsFeatures are selected based on their relationship to a graphic or graphics you create through the Draw toolbar (e.g., a polygon or line). The same selection options apply when you select by graphics as when you use the interactive selection method.
Other features in this selection menu include controlling which layers are considered in the selection, zooming to the selected features, and clearing the selection.

Introduction to ArcGIS I 4-10Querying your database
4-10Introduction to ArcGIS ICopyright © 2000–2004 ESRI. All rights reserved.
Selection layersSpecify from Selection menu or add tab to TOC
Layers available when using interactive selection tool
Method 1Method 1
Method 2Method 2
Set Selectable LayersWhile making spatial selections, you have the option of turning on or off the layers that are going to be involved in the selection operation. This can be done in two ways:
Method 1From the Selection menu, click Set Selectable Layers. Check the check boxes for any layers you want to include in your next selection.
Method 2From the Tools menu, click Options and click on the Table of Contents tab. Check the Selection check box in the Table of Contents tab options panel and then click OK. Now you have a permanent Selection tab at the bottom of ArcMap’s Table of Contents. When you click this tab, a list of layers with check boxes to their left appears. Now you can check which layers should or should not be included in your next selection.

Introduction to ArcGIS I 4-11Querying your database
4-11Introduction to ArcGIS ICopyright © 2000–2004 ESRI. All rights reserved.
Selection methodsSpecify from Selection menu
Create new selection
Remove from the selection
Add to the selection
Select from selection
Interactive selection methodFour methods are available:
Create New SelectionAll features are available at the onset, and you select four countries: France, Poland, Bulgaria, and Greece.
Add to Current SelectionNow you want to add more countries to the first four selected. You select Denmark and Italy.
Remove From Current SelectionHere, you decide to remove Bulgaria and Greece from the current selection.
Select from Current SelectionThis time you decide to select only France from the current selection.

Introduction to ArcGIS I 4-12Querying your database
4-12Introduction to ArcGIS ICopyright © 2000–2004 ESRI. All rights reserved.
Interactive selection options
Options from Selection menuSelect features partially or completely within the box or graphic(s)
Select features completely within the box or graphic(s)
Select features that the box or graphic are completely within
Interactive selection optionsThe Selection dropdown list offers three additional selection options depending on how you want the features to be selected when you create a selection box:
1. Select features partially or completely within the box or graphic: Complete features are selected, whether they fall completely within the selection box or fall partially within the selection box.
2. Select features completely within the box or graphic: Complete features are selected only if they fall completely within the selection box.
3. Select features that the box or graphic are completely within: The selection box must fall completely within the feature to get selected. This technique is useful if the selected feature is multipart or an irregular shape.

Introduction to ArcGIS I 4-13Querying your database
4-13Introduction to ArcGIS ICopyright © 2000–2004 ESRI. All rights reserved.
Attribute selectionUse a SQL ‘where’ clause to select featuresSave and reload selection expressions
For current selection:Add toRemove fromSelect from
FieldFieldOperatorOperator
ValueValue
Attribute selectionArcMap lets you select features using a ‘where clause’ from Structured Query Language (SQL) in the Selection menu’s Select By Attributes dialog. SQL is a powerful language you use to define one or more criteria by which you want to select features or rows. You define the criteria by creating expressions consisting of attributes, operators, and values. For example, imagine you have a customer database, and you want to find those customers who spent more than $50,000 last year and whose business type is Restaurant. You could select the customers with this expression: Sales > 50000 AND Business_type = 'Restaurant'.To create an attribute selection, you need to do the following:1. From the Selection dropdown list, click Select By Attributes.2. On the Select By Attribute window, choose the layer from which you want to select
features.3. Write a selection statement (otherwise known as an SQL statement). You can type this
yourself, or you can create it by clicking a field and an operator button, followed by a value. You can also write more complicated expressions using connectors, such as “And”, “Or”, and so on. Clicking the Verify button helps you ensure that the syntax of the expression is correct.
4. When you are convinced the syntax is correct, click OK.You can build expressions to select features directly from your map or to select records from atable. Selecting records in an attribute table also highlights features in the map, so you can see where the associated features are.You can save selection expressions and reload them with the Save and Load buttons at the bottom of the Select By Attributes dialog. This saves time when you are working with complex query expressions. Simply load the expression back into the Select By Attributes dialog to easily regenerate a set of selected records.

Introduction to ArcGIS I 4-14Querying your database
4-14Introduction to ArcGIS ICopyright © 2000–2004 ESRI. All rights reserved.
Select by location (spatial query)Use features in one layer to select features in another
Cities
Result
Countries
Cities intersected by selected countries
Select by location (spatial query)You will often need to find features based on their geographic, or spatial, relationship to other features. Instead of using the cursor or geometric shapes to select features, you use features from one layer to select features in another layer. For this reason, Select By Location is called spatial query.When selecting features with spatial queries, you use the Select By Location dialog, available from ArcMap’s Selection menu, to create a statement about what you want to select. Your selection procedures include:• Select features from• Add to the currently selected features• Remove from the currently selected features• Select from the currently selected featuresThe selected features depend on the mode used. These modes are discussed on the next slide.Regardless of the mode you use, you have the option of narrowing your selection to a specific layer by checking off all the layers that you want to exclude. You can also select features using a certain buffer distance.You recall the introduction of the concept of topology in Lesson 2. The Select by Location dialog is where you can easily query your data using the topological relationships, which exist between features and layers.

Introduction to ArcGIS I 4-15Querying your database
4-15Introduction to ArcGIS ICopyright © 2000–2004 ESRI. All rights reserved.
Select by location offers many selection methodsIntersectContainAre contained by Share a line segmentTouch boundaryWithin a distanceAre identicalAre centered inMore…
Location selection methods
Animal sightings within a distance
of 2 km from rivers
Sightings
Result
River 2 km
Counties
Polluted areas completely withinselected counties
Pollution
Result
Location selection methodsWith the Select By Location dialog, you can select features based on their location relative to other features. Suppose you want to know how many homes were affected by a recent flood. Answering this question—and others like it—involves forming a spatial query. You want to find features based on where they are in relation to other features. For instance, if you mapped the flood boundary, you could then select all the homes that are within this area. By combining queries, you can perform more complex searches. For example, suppose you want to find all the customers who live within a 20-mile radius of your store and who made a recent purchase so you can send them a promotional mailing. You would first select the customers within this radius (select by location) and then refine the selection by finding those customers who have made a purchase within the last six months according to a date-of-last-purchase attribute. You can use a variety of selection methods to select the point, line, or polygon features in one layer that are near or overlap the features in the same or another layer.

Introduction to ArcGIS I 4-16Querying your database
4-16Introduction to ArcGIS ICopyright © 2000–2004 ESRI. All rights reserved.
Select by graphicsDraw a graphic to select features
Works with interactive selection methods1) Draw graphic 2) Select Method
Select by graphicsYou may use the tools on the Drawing toolbar to add graphics to the ArcMap display. For example, you may want to digitize a polygon around a group of islands that you want to select. Once the graphic has been added to the display, the Select by Graphics option is activated on the Selection menu.

Introduction to ArcGIS I 4-17Querying your database
4-17Introduction to ArcGIS ICopyright © 2000–2004 ESRI. All rights reserved.
Calculating summary statisticsSelect
Features
Layer
Field
Calculating summary statisticsAfter making a spatial or attribute selection, you may want to calculate a simple statistics summary. This can be done by clicking the Statistics option from the Selection dropdown list. This operation invokes the Selection Statistics dialog. Here you need to select the layer, as well as the field in the feature attribute table, that you want the statistics to be calculated for. Once these are selected, a numeric statistics summary, as well as a frequency distribution chart, appears in that window.

Introduction to ArcGIS I 4-18Querying your database
4-18Introduction to ArcGIS ICopyright © 2000–2004 ESRI. All rights reserved.
Exercise 4 overviewExplore tools for interactively querying data
MapTipsIdentify and Find toolsMeasure tool
Select features by attribute value and locationCalculate statistics for your selectionSave selected features as a separate layerExplore other spatial selection optionsSave your layer in another format

Introduction to ArcGIS I 4-19Querying your database
4-19Introduction to ArcGIS ICopyright © 2000–2004 ESRI. All rights reserved.
Lesson 4 reviewWhat is a hyperlink?
What does the Identify tool do?
How do you access the context menu in the Find tool? What options are located on this context menu?
What are the four ways a feature can be selected in ArcMap?
What are the selection methods available in the Select by Attribute dialog?
What extent options can be set for interactive spatial selections?

Introduction to ArcGIS I 4-20Querying your database
4-20Introduction to ArcGIS ICopyright © 2000–2004 ESRI. All rights reserved.
Lesson 4 reviewWhat type of statement does the the Select by Attribute function use to select features?
If you do not know where a certain feature is but you know some of its attributes, how would you locate it?

����
����
�������������������� ��������������������������������
������� ���������������
��������������� �� �������������������������� ��������������������������� ����������������������������� ��������������������� �� !��������������������� ��"#���������������������������� ��$!������������������� ��%&����������������������� ��'(&���������������������� ��'')#*��������������� ��'�+������������������������������������� ��'�,���������������� ��'�-����!������.�/���������� ��'
-����#�)������ ��'"+������.������������� ��'$+���)����������� ��'%)�������������������� �� (+���0�������� �� '������������������ �� +���,����������� �� �)������������������ �� �#������������������������������ �� �#��������������������������� �� #�)�������1����� �� "#������������.���� �� $&2������������� �� %������������� ���(


Introduction to ArcGIS I 5-1Working with spatial data
Copyright © 2000–2004 ESRI. All rights reserved. Introduction to ArcGIS I
Working with spatial data

Introduction to ArcGIS I 5-2Working with spatial data
5-2Introduction to ArcGIS ICopyright © 2000–2004 ESRI. All rights reserved.
Lesson 5 overviewGeographic data reviewLinking features and attributesData formatsWorking with ArcCatalog
Options
Metadata

Introduction to ArcGIS I 5-3Working with spatial data
5-3Introduction to ArcGIS ICopyright © 2000–2004 ESRI. All rights reserved.
Vector
Raster
Data has
Representing geographic features
X,YX,Y
X,YX,Y X,Y
X,Y
X,Y
Row
Column
Behavior rulesBehavior rulesGeometryGeometry
AttributesAttributes
Representing geographic featuresThe two basic models for digitally storing geographic data are vector and raster. The vector model uses discrete coordinates (commonly known as x,y coordinate pairs) to represent geographic features as points, lines, or polygons. The raster model uses equally sized square cells to represent features; the level of detail depends on the size of the cells. Each data model has pros and cons: vector data is cheap to store but expensive to process; raster data is cheap to process but expensive to store. Also, different physical phenomena may be more suited to one data type versus the other (e.g., rainfall is more suited to a raster data model, surveyed lines are more suited to the vector data model).GIS data is made up of three basic components: geography (the spatial representation of the features), attributes (the descriptive characteristics of the features), and behavior rules (instructions that govern what the features can and cannot do).
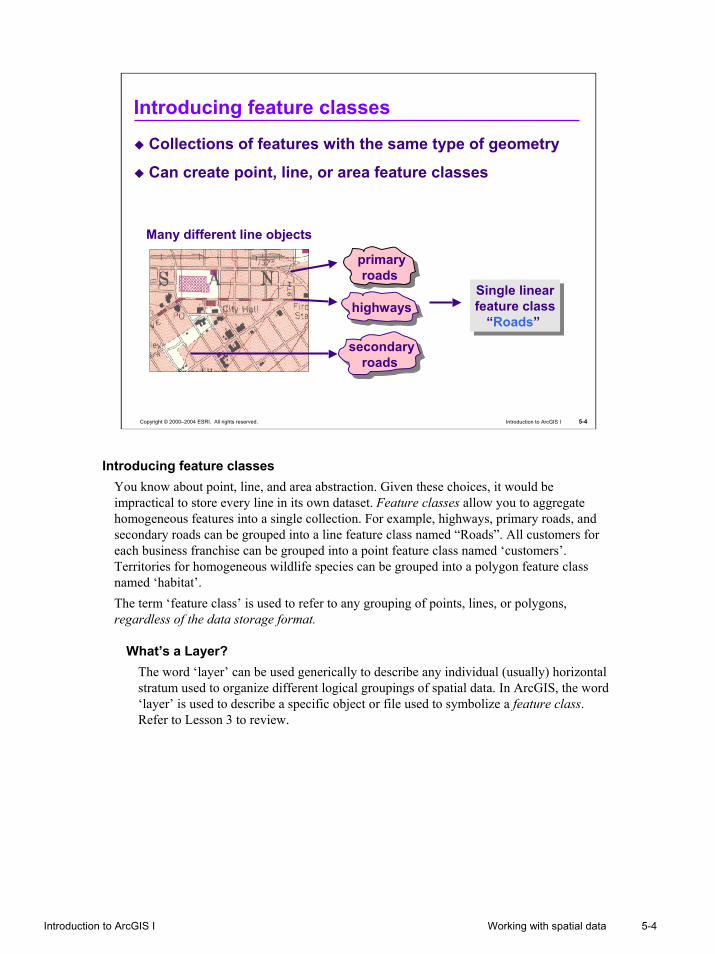
Introduction to ArcGIS I 5-4Working with spatial data
5-4Introduction to ArcGIS ICopyright © 2000–2004 ESRI. All rights reserved.
Introducing feature classes
Collections of features with the same type of geometry
Can create point, line, or area feature classes
Many different line objects
primaryroads
Single linearfeature class
“Roads”
Single linearfeature class
“Roads”
secondaryroads
highways
Introducing feature classesYou know about point, line, and area abstraction. Given these choices, it would be impractical to store every line in its own dataset. Feature classes allow you to aggregate homogeneous features into a single collection. For example, highways, primary roads, and secondary roads can be grouped into a line feature class named “Roads”. All customers for each business franchise can be grouped into a point feature class named ‘customers’. Territories for homogeneous wildlife species can be grouped into a polygon feature class named ‘habitat’.The term ‘feature class’ is used to refer to any grouping of points, lines, or polygons, regardless of the data storage format.
What’s a Layer?The word ‘layer’ can be used generically to describe any individual (usually) horizontal stratum used to organize different logical groupings of spatial data. In ArcGIS, the word ‘layer’ is used to describe a specific object or file used to symbolize a feature class. Refer to Lesson 3 to review.

Introduction to ArcGIS I 5-5Working with spatial data
5-5Introduction to ArcGIS ICopyright © 2000–2004 ESRI. All rights reserved.
Linking features and attributes
Feature classes are tables that store spatial data
Each feature has a record in the tableUnique identifier links feature and attributes
FID = 5052FID = 5052Feature Identifier
Linking features and attributesFor geographic objects stored in a feature class, each individual feature is assigned a unique numerical identifier and is characterized by a unique location in space and corresponding record in an attribute table. While the exact name of the numerical identifier may differ by the data format, it is important to understand this one-to-one relationship between feature, identifier, and attribute record.

Introduction to ArcGIS I 5-6Working with spatial data
5-6Introduction to ArcGIS ICopyright © 2000–2004 ESRI. All rights reserved.
Spatial data formats
ArcGIS can work with spatial data in multiple formats
CADCAD
CoverageCoverageGeodatabaseGeodatabaseShapefileShapefile
RasterRaster TablesTables
ArcGISArcGIS
Internet Map Service
Internet Map Service
Spatial data formatsCurrently, there is not a standard format for GIS data. Various GIS software manufacturers and other organizations, such as government agencies, have continually searched for more efficient and versatile digital formats to store geographic information. ArcGIS has the advantage of seamlessly supporting all of the ESRI formats: shapefiles, coverages, GRIDs, the geodatabase, and data served over the Internet by ArcIMS. ArcGIS also supports the three most common CAD file formats (DXF, DWG, and DGN), as well as a variety of common image formats. Having the ability to work with so many different formats without needing to convert them is a tremendous advantage.More information describing all of the data types supported by ArcGIS can be found in the ArcGIS Desktop Help files by entering the keywords ‘data types’ under the Index tab.

Introduction to ArcGIS I 5-7Working with spatial data
5-7Introduction to ArcGIS ICopyright © 2000–2004 ESRI. All rights reserved.
Geodatabase data format
Stores spatial features and their attributes in the same RDBMSFeature datasets model spatial relationshipsStand-alone feature classes
Shape field accesses separate
coordinate table
Shape field accesses separate
coordinate table
RDBMS table
Coffee pointfeature class
Data format: GeodatabaseIn contrast to file-based formats like coverages and shapefiles, which store feature coordinate and attribute information in separate files, the geodatabase has the ability to store the two types of information in one database. This centralization of storage offers many advantages.Each geodatabase feature class can only store a single feature type, but you can easily group them into a feature class collection called a feature dataset as long as they have the same coordinate system. Note: The term geodatabase is used to refer to a storage format. You should be aware that ArcGIS supports two physical implementations of the geodatabase: a personal geodatabase and an ArcSDE geodatabase. The personal geodatabase is designed for smaller-scale projects and is stored in MDB format. You do not need to purchase any additional software programs to access and manage personal geodatabases. The ArcSDE geodatabase is designed for larger enterprise GIS applications and databases and is stored in one of the supported RDBMS formats (Oracle, SQL Server, DB2, Informix). These applications require you to purchase the supported RDBMS software for data storage. ArcGIS provides the necessary interface between your chosen RDBMS and the desktop applications. Regardless of the physical implementation, you can perform the same display, query, and analysis operations on both types of geodatabases. Note that there are some differences in functionality due to physical storage issues. Read the online documentation for more information. The geodatabase is a native data format for all ArcGIS applications. It stores point, line, and area data in an RDBMS table (e.g., Access, Oracle, DB2 and SQL Server). The ArcEditor and ArcInfo levels of ArcGIS allow you to create, edit, and delete ArcSDE and personal geodatabase feature classes. The ArcView level allows you to create, edit, and delete personal geodatabase features and use ArcSDE geodatabase features for various processes,such as queries, joins, and relates.

Introduction to ArcGIS I 5-8Working with spatial data
5-8Introduction to ArcGIS ICopyright © 2000–2004 ESRI. All rights reserved.
Advantages of the geodatabaseA relational database management system (RDBMS) for spatial and attribute data
Multiuser editingMultiuser editing
Custom featuresCustom features
Spatial and Attribute validation
Spatial and Attribute validation
Single storagelocation
Single storagelocation
RelationshipsRelationships
Scalable storage solutions
Scalable storage solutions
Geodatabase
Manage raster and vector data
Manage raster and vector data
Advantages of the geodatabaseThe geodatabase provides:
• Centralized spatial and attribute storage• Easy to use standard behavior rules• Multiple customization options• Multiuser editing (ArcSDE geodatabase only)
The geodatabase supports a variety of modeling, management, and analysis functions. One of its key benefits is that its implementation of tables, feature classes, feature datasets, and rules allows you to model reality more closely than was possible with other data models.The geodatabase data model can minimize the differences between logical and physical models of reality by incorporating more intuitive data objects. For example, a coverage or shapefile provides a mechanism to store a generic point feature that may require ARC Macro Language (AML) or Avenue programs to maintain its attribute validation rules and other behavior. The geodatabase lets you store an electrical transformer feature instead of just a generic point feature and then apply subtypes, attribute domains, and relationship rules and/or topological rules. Because your datasets are smarter, it is easier to create and maintain your data. The ability to model simple and complex relationships through the graphical user interface (GUI) means that no external programming is needed for most customization. An added bonus for ArcSDE geodatabases is the ability to support multiuser editing through versioned geodatabases.

Introduction to ArcGIS I 5-9Working with spatial data
5-9Introduction to ArcGIS ICopyright © 2000–2004 ESRI. All rights reserved.
Geodatabase validation
Attribute validationAttribute validation
Relationship classesRelationship classes
DomainsDomains
SubtypesSubtypes
Spatial validationSpatial validation
Geometric networkGeometric network
TopologyTopology
Automate spatial feature and attribute behavior Speeds up data entry Enforces quality control
Validation means that geographic features can be made to allow certain types of editing, display, or analysis behavior, depending on circumstances that the user defines. Feature behavior is most easily implemented in the geodatabase. In the geodatabase, you can set two types of validations: spatial and attribute.
Spatial validationSpatial validation can be used in two ways: topology or geometric networks. Both of these spatial validation types require a feature dataset, where dedicated feature classes participate in either the topology rules or the geometric network rules. A single feature class cannot participate in both. Both of these spatial validations are available in ArcEditor and ArcInfo.
Attribute validationAttribute validation are of three types: subtypes, domains, and relationship classes. These types of validations are necessarily used with tabular data. Both of these validations are required for maintaining data integrity and efficiency during management, display, and editing operations on the geodatabase. ArcView and above can create and edit domains; subtypes can only be created with ArcEditor and ArcInfo.
More information regarding any of these topics can be found in a variety of sources:•ArcGIS Desktop Help•Online at http://support.esri.com•Instructor-led courses (e.g., Introduction to ArcGIS II, Building Geodatabases I and II)•Virtual Campus courses (e.g., Basics of the Geodatabase Data Model; Creating, Editing, and Managing Geodatabases for ArcGIS 8.3)

Introduction to ArcGIS I 5-10Working with spatial data
5-10Introduction to ArcGIS ICopyright © 2000–2004 ESRI. All rights reserved.
ESRI shapefile data formatShapefile
Single feature classAttributes stored in dBASE tableMade up of separate filesCan create and edit with ArcGIS or ArcView 3.x
Use only ArcCatalog to manage shapefiles
Data format: ShapefileShapefiles can only contain one feature class. Therefore, a donut shop point feature class (representing the building’s point location) must be stored in a different shapefile as a donut shop polygon feature class (representing the building’s footprint).Regardless of feature type, a shapefile’s default attribute table is stored in dBASE format and is named shapefile.dbf (e.g., donut.dbf). You can access this table in ArcGIS applications or dBASE. Additionally, shapefiles are the native format for ArcView 3.x, so you can view, display, and edit both the spatial and attribute data in ArcView 3.x.Shapefiles are a vector file structure for storing the location and attribute information of points, lines, or areas. Each shapefile consists of at least three files: <name>.shp, <name>.shx, and <name>.dbf (e.g., donut.shp, donut.shx, and donut.dbf). However, there may be other files associated with the shapefile, which you might not recognize and therefore miss if you tried to copy or move the shapefile using your computer operating system. This is why you should only use ArcCatalog to copy, move, or rename shapefiles.

Introduction to ArcGIS I 5-11Working with spatial data
5-11Introduction to ArcGIS ICopyright © 2000–2004 ESRI. All rights reserved.
ESRI coverage data formatCoverage
Multiple feature classesAttributes stored in INFO tableCan only be stored in an ArcGIS WorkspaceEdited only with ArcInfo Workstation
Use only ArcCatalog to manage coverages
Data format: CoverageA coverage is the ArcInfo Workstation native vector format. It is stored as a folder containing both the locational data files and the descriptive data files for features in a given geographic area. It is a collection mechanism that may contain one or more feature classes. For example, a landuse coverage may contain both an area feature class representing contiguous landuse boundaries and a line feature class used to model the exact transitional location between landuse types. Area and line feature classes have separate attribute tables, but it is important to note that they share the same geometry. You can have points and lines (with attributes) in the same coverage, but they do not share the same geometry. The only limitation is that you cannot have both point and polygon attributes within the same coverage.
ArcInfo coverage organizationAn ArcInfo workspace is simply an operating system folder with a subfolder named info. The info folder stores and manages the info format attribute tables for the coverages in the workspace. In addition to coverages, workspaces may also store any other type of geographic data (e.g., shapefiles, geodatabases, GRIDs), as well as related files, such as documentation or graphics files.It is very important to use only ArcGIS tools to manage and manipulate coverages and workspaces. ArcGIS tools are designed to preserve the link between the files stored in the coverage directory and the files stored in the info directory. Operating system file management tools are unaware of this link.Coverage files are stored in two folders: the coverage folder and the INFO folder. Files in both folders are required to reconstruct a coverage’s spatial and attribute information.

Introduction to ArcGIS I 5-12Working with spatial data
Topological data structureUnlike shapefiles, coverages explicitly store the topological information (length, area, perimeter, adjacency, and connectivity) as part of the feature attribute table. For example, coverages containing line feature classes have length and connectivity properties defined in the <cover>.aat; polygon feature classes contain area and perimeter in the <cover>.pat; and coverages containing both line and polygon feature classes have adjacency information defined in the <cover>.aat. For more information, consult the online documentation. ArcInfo coverages have the ability to store a variety of feature classes. The graphic in the slide illustrates the different kinds of coverage feature classes. A coverage’s attribute table is stored in INFO format, and you can access this table anywhere in ArcGIS. The INFO table has a feature identifier named <cover># (e.g., landuse#) that links the geometric feature with the associated record in the attribute table. INFO attribute tables associated to polygon or point feature classes are named <cover>.pat (e.g., landuse.pat or wells.pat). INFO attribute tables associated to line feature classes are named <cover>.aat(e.g., streets.aat). Coverages can be displayed and queried in all ArcGIS applications, but they can only be edited using the ArcEdit module of ArcInfo Workstation.

Introduction to ArcGIS I 5-13Working with spatial data
5-13Introduction to ArcGIS ICopyright © 2000–2004 ESRI. All rights reserved.
CAD file data formatComputer Aided Design files (DXF, DWG, DGN)Logical collection
Display one or all feature classes
Edit after converting to geodatabase FC or shapefileCAD file (read-only attribute tables)
Shape field accesses read-only
coordinates
Shape field accesses read-only
coordinates
Data format: CAD filesAccessing CAD sources may be done individually by choosing the feature class to display and/or query, or you can view the entire CAD file feature class collection all at once. If you view all feature classes at once, you cannot change the symbology, and you cannot view the associated attribute table.
CAD attribute tablesYour geographic database may include GIS data stored in CAD format. ArcGIS supports DXF, DWG, and DGN formats. You can display and query the data as it exists in its native CAD file format, or you can convert it to a geodatabase feature class or shapefile if you want to edit the spatial features or attribute records.Each individual feature class within the CAD file has an associated attribute table, usually a .dxf file. This table displays the original attributes from the CAD file.The ability to display and query native CAD files is incredibly useful. For example, suppose you work for an organization where one or more departments create spatial data with CAD systems. Rather than re-creating the data to put in your GIS database, you can leverage the existing data.
Converting CAD filesThe ArcToolbox Conversion Tools support both the import and export of DWG, DXF and DGN files to geodatabase and shapefile formats. The export to CAD functionality is new with ArcGIS 9. ArcMap supports the export of CAD data to shapefile or geodatabase feature class formats through the layer Data > Export Data function. ArcCatalog supports the export of CAD feature classes into coverage, shapefile, or geodatabase feature class formats. This is accessed through the layer context menu in the catalog tree.

Introduction to ArcGIS I 5-14Working with spatial data
5-14Introduction to ArcGIS ICopyright © 2000–2004 ESRI. All rights reserved.
Tabular locations to a point feature class
Table with raw coordinatesTable with raw coordinates New feature classNew feature class
Table with addressesTable with addresses New feature classNew feature class
Tabular locationsYou can add tabular data that contains geographic locations in the form of x,y coordinates to your map.x,y coordinates describe discrete locations on the earth’s surface, such as the location of fire hydrants in a city or the points where soil samples were collected. You can easily collect x,y coordinate data using a global positioning system (GPS) device. In order to add a table of x,y coordinates to your map, the table must contain two fields, one for the x coordinate and one for the y coordinate (these fields might also be named ‘northing’ and ‘easting’, or ‘latitude’ and ‘longitude’). The values in the fields may represent any coordinate system and units, such as latitude and longitude or meters. Once you have added the data to your map, the layer behaves just like any other feature layer. You may also create point features from a table of address locations through the process of geocoding or address matching to reference address data. Geocoding is covered in more detail in the Introduction to ArcGIS II course.

Introduction to ArcGIS I 5-15Working with spatial data
5-15Introduction to ArcGIS ICopyright © 2000–2004 ESRI. All rights reserved.
Managing raster data
Rows and columns of equal-sized cells Each cell stores a value
Detail depends on cell size
GRID (the ESRI native raster format)
Images (TIFF, BMP, SID, JPEG, ERDAS)
Data format: Images and GridsRaster data files use rows and columns of equally spaced cells to model reality. There is a trade-off between file size and how closely you want to model reality. If you assume a given spatial extent, a small cell size (e.g., 6-inch pixel) captures more detail, but the raster file size is larger than a large raster cell size (e.g., 50-meter pixel), which captures less detail. It is not uncommon for a single high-resolution (i.e., small cell) image to be many gigabytes in size.
Raster collection mechanismsA raster data source can be composed of a single layer or a collection of multiple layers, which appear to act as one (composite). ArcGIS supports many raster image formats, and these may be monochrome (black and white) or multispectral (many bands, or layers, representing many colors). ArcCatalog allows you to manage individual raster data sources in two ways: a Raster Dataset represents a single source of raster information; a Raster Catalog represents a number of individual raster data sources, which are displayed and managed as one. ArcGIS also uses an ESRI raster format called GRID. GRIDs may use a collection mechanism called a grid stack, which is used for certain types of analysis. There are several different types of GRIDs, so you should read the online documentation for more information about their formats and capabilities.
Raster management in ArcGISIf you only want to manage the storage or display of rasters in ArcGIS, you can use ArcCatalog. However, if you need to use ArcGIS to create, edit, manipulate, or analyze raster datasets, you will need the Spatial Analyst extension.

Introduction to ArcGIS I 5-16Working with spatial data
5-16Introduction to ArcGIS ICopyright © 2000–2004 ESRI. All rights reserved.
Using Geography Network dataMap or Data services Data clearinghousesGeoservices and solutions
Using Geography Network dataThe Geography Network is based on the collaboration of public and private organizations that publish and share GIS information on the Internet. It provides access to a wide variety of geographic content including static map images, dynamic map services, downloadable data, and data clearinghouses. The Geography Network is an evolving Internet platform, based on ArcIMS software technology, for both users and publishers of spatial data.There are two types of map services: Image Services and Feature Services. When you use an Image Service, the map image is generated for you by the map server in JPEG, GIF, or PNG format and does not require any special processing on your computer. With a Feature Service, the map server bundles the data and ships it to you through a process called streaming. This requires that you have the necessary Java applet or application, like ArcExplorer or ArcGIS, to interpret the data stream. With Feature Services, you are actually working directly with the data over the Internet.A data service lets you download geographic data files, or it can be a collection of links to data clearinghouses. When you download geographic files, you are getting a static copy of the data from the data provider’s computer—not a live map as in the Image or Feature Map Services described previously. Data clearinghouses are usually Web sites maintained by organizations and companies that handle specific types of information. The data may be categorized by geographic region, department, project, content, or by the digital characteristics of the data itself. Geoservices are Internet services that perform basic geoprocessing tasks such as geocoding, buffering, or routing. As a solutions developer, you would use geoservices to perform real time geoprocessing on the computer where the geoservices are located and pass back the results to your custom application, all over the Internet. In other words, you would not have to maintain the basic geoprocessing application tools or the associated geographic data on your computers in order to use them with your custom map service.

Introduction to ArcGIS I 5-17Working with spatial data
5-17Introduction to ArcGIS ICopyright © 2000–2004 ESRI. All rights reserved.
Provides a uniform view of all your data
Define or modify table and feature class definitions
Manage data: Copy, Rename, DeleteAdditional data management tools with the ArcToolbox window
Using ArcCatalog
Using ArcCatalogArcCatalog is the application where you create and manage connections to all the data you need to use. When you create a connection, you access the data to which it is linked, whether it is located on a local disk or a database on the network. Together, your connections create a ‘catalog’ of geographic data sources. Within ArcCatalog, you can move, copy, rename, and delete geographic data. You can create, manage, and edit associated metadata, and you can perform some modifications to the data, such as adding fields to tables, defining subtypes, creating domains, and building table relationships.By adding the ArcToolbox window, you can also access all of the data management tools contained within the various toolboxes.

Introduction to ArcGIS I 5-18Working with spatial data
5-18Introduction to ArcGIS ICopyright © 2000–2004 ESRI. All rights reserved.
Three ways to view data
Contents
Preview
Metadata
Three ways to view dataIn ArcCatalog, you can browse your data holdings three ways using three tabs:
Contents tabThe Contents tab shows what a selected item (e.g., folder, geodatabase, or feature dataset) in the catalog tree contains. There are four ways to view the contents of the item: as large icons, in list form, showing details (like data type), and in thumbnail view.
Preview tabThe Preview tab previews the selected item’s geographic or tabular data. Geography view is the default preview mode. For items containing both geographic data and tabular attributes, you can toggle between the two preview types using the dropdown list at the bottom left corner of the Preview view.The available previews are not limited to Geography and Table. Developers can create their own custom previews and add them to the list. For example, an AML view might let you preview the contents of an AML file that has been added to the database.
Metadata tabThe Metadata tab shows a selected item’s metadata. By default, when you first try to view an item’s metadata, ArcCatalog automatically generates it if it does not already exist. Upon creation, ArcCatalog adds several of the data source’s properties to the metadata. The next time you view or edit the metadata, ArcCatalog will automatically update these properties with the current information.

Introduction to ArcGIS I 5-19Working with spatial data
5-19Introduction to ArcGIS ICopyright © 2000–2004 ESRI. All rights reserved.
The Contents tab
Large icons
List
Details
ThumbnailsData
Layers
Maps
The Contents tabThe Contents tab lists the items contained in any item you select in the catalog tree, such as folders, geodatabases, or feature datasets. In the Contents tab, you can look at the data listed in four different ways:
•Large icons: All items are represented by a large icon graphic in the main display window.
•List: The items are shown in a simple list with small icons to the left of the file names.
•Details: The items are shown in a simple list with small icons to the left of the file names (similar to the list view option), but additional information is also given, such as each file’s data type.
•Thumbnails: All items are represented by thumbnail images in the main display window. The thumbnails are snapshots of the data at the time the thumbnail was created. Therefore, the thumbnail images can quickly become outdated and should be updated frequently.
By default, thumbnails are automatically generated for map documents. For other items, a thumbnail must be created manually. If a thumbnail has not been created for an item, an icon describing the data type and name of the item appears in place of the thumbnail.

Introduction to ArcGIS I 5-20Working with spatial data
5-20Introduction to ArcGIS ICopyright © 2000–2004 ESRI. All rights reserved.
Creating thumbnail images
Used by Contents thumbnail view
Choose an object
Zoom and Pan (optional)
Click Create Thumbnail icon Click the
Preview tab
Creating thumbnail imagesTo create a thumbnail image in ArcCatalog, you must have the Geography toolbar displayed on the ArcCatalog interface. To access the toolbar, click View > Toolbars > Geography. To create a thumbnail, simply select the layer in the Catalog tree, click the Preview tab, and then click the Create Thumbnail tool in the Geography toolbar.In order to view the created thumbnail, click on the folder/geodatabase/feature dataset that contains the layer, click the Contents tab, and click the Show Contents As Thumbnail Images button on the standard ArcCatalog toolbar. You now see the thumbnail you created.

Introduction to ArcGIS I 5-21Working with spatial data
5-21Introduction to ArcGIS ICopyright © 2000–2004 ESRI. All rights reserved.
The Preview tab
Geography or Table viewChoose from dropdown list
Build custom views
The Preview tabWhen an item is selected in the Catalog tree, the Preview tab previews the selected item’s geographic or tabular data. At the bottom of the tab, there is a dropdown list that allows users to select which view they would like to see (either geography or table). Geography is the default view, where the data is displayed with a random color and/or symbol set. The table view option displays the attribute data associated with the selected feature class in tabular form. A third preview option, 3D view, is also possible if the 3D Analyst Extension has been added. You can build your own custom views if these three options do not meet the needs of your organization.

Introduction to ArcGIS I 5-22Working with spatial data
5-22Introduction to ArcGIS ICopyright © 2000–2004 ESRI. All rights reserved.
Introducing metadata
Descriptive information about data sourceMetadata tab
Description
Spatial
Attributes
Metadata toolbarCreate and edit contentConvert between different file formats
Introducing metadataOften the definition given for metadata is ‘data about data’. While this definition is not incorrect, it is not very informative. More precisely, metadata supports descriptive information about data. Text written on the back of a photograph telling you the photograph’s date and subject and nutrition labels on food containers are common examples of everyday metadata. For spatial data, metadata includes descriptive information such as date, creator, geographic extent, coordinate system, and attribute domains. Metadata gives your data credibility, and in many situations, your data may be impossible to interpret or use without it.The Metadata tab in ArcCatalog displays the metadata for a selected dataset. If metadata does not exist for the selected dataset, ArcCatalog creates as much metadata as it can from the existing information. For the FGDC ESRI stylesheet, the Metadata tab is divided into three categories, each with an active tab:
•Description—contains the basic narrative information about the dataset, including source, organization, date, uses, and restrictions.
•Spatial—contains the coordinate information and geographic extent of the dataset.
•Attributes—includes fields, attribute domains, and related tabular information.You can create, edit, import, and export the metadata for any given dataset. Because metadata information is stored in XML format, you can use it with other software that can read XML documents.

Introduction to ArcGIS I 5-23Working with spatial data
5-23Introduction to ArcGIS ICopyright © 2000–2004 ESRI. All rights reserved.
The Metadata tab
Create and display metadata in a variety of ways
XMLXML ISOISO
FGDC ClassicFGDC Classic FGDC_ESRIFGDC_ESRI
Viewing metadataYou can view metadata in ArcCatalog by selecting an item in the catalog tree and then clicking the Metadata tab in the display area. There are a number of stylesheets available in ArcCatalog to view metadata. Stylesheets format data from a database and present the results as a report. Metadata is stored as an Extensible Markup Language (XML) file, and the stylesheets define how XML data is presented. Stylesheets are written using Extended Stylesheet Language (XSL). The stylesheets in ArcCatalog represent common standards for metadata. However, you can create your own customized stylesheet for displaying metadata in ArcCatalog using XSL.The Federal Geographic Data Committee (FGDC) is an organization established by the United States Federal Office of Management and Budget responsible for the coordination of development, use, sharing, and dissemination of surveying, mapping, and related spatial data. It is composed of representatives from several federal agencies and GIS vendors. The FGDC defines spatial metadata standards in its Content Standards for Spatial Metadata, and it coordinates the development of the National Spatial Data Infrastructure (NSDI).The International Organization for Standardization (ISO) is another common standard for collecting metadata on spatial data.

Introduction to ArcGIS I 5-24Working with spatial data
5-24Introduction to ArcGIS ICopyright © 2000–2004 ESRI. All rights reserved.
Connect to any folder in your network
Connect through Network Neighborhood to store a Uniform Naming Convention (UNC) path
Example \\servername\foldername\filename.extUse UNC in layer files or map documents
Disconnect from folders
Connecting to folders
Connecting to foldersUnlike Windows Explorer, ArcCatalog does not list all files stored on disk; so when you look in a folder, it might appear to be empty. By default, ArcCatalog only lists geographic data files. By default, ArcCatalog can access several types of geographic data (e.g., shapefiles, coverages). To enable ArcCatalog to access a new type of data, both spatial and nonspatial types, you need to specify the data type in the File Types list in the Options dialog. When you first start ArcCatalog, it contains folder connections that let you access your local computer’s hard disks along with other folders called ‘top level’ directories (e.g., Coordinate Systems, Address Locators). You can add additional folder connections that access specific folders or directories on a local disk, shared folders on the network, or the contents of a floppy or CD-ROM drive when needed. You can also connect through Network Neighborhood to store a Uniform Naming Convention (UNC) path. You can use UNC for layer files or map documents to reference a layer’s source data. Lastly, you can remove folder connections and hide other folders that you do not need.

Introduction to ArcGIS I 5-25Working with spatial data
5-25Introduction to ArcGIS ICopyright © 2000–2004 ESRI. All rights reserved.
Adding tables from other databases
Access diverse data sources OLE DB connection
Connecting to Microsoft Excel?Refer to ESRI Knowledge Base for step-by-step instructions
Accessing existing databasesYou may access existing Info, dBASE, or comma delimited text files simply by connecting to the folder that holds them. To access tabular data in other formats, you can use Object Linking and Embedding Database (OLE DB) providers. ArcCatalog communicates through an OLE DB provider, which then communicates with a different database. This standard lets you work with data from any database in the catalog in the same way. Looking in an OLE DB connection in the catalog, you will see a list of tables in the database. Microsoft’s OLE DB providers come with ArcCatalog. They let you access Jet (Microsoft Access), SQL Server, and Oracle databases. Another provider communicates with Open Database Communication (ODBC) drivers.
Connecting to an Excel spreadsheet in ArcCatalogA common request is to view data in a Microsoft Excel spreadsheet in ArcGIS. Though Excel is a spreadsheet application and not a database, information in Excel can be accessed through a connection by using the Microsoft OLE DB Provider for OBDC Drivers. The data in Excel can then be viewed as a table in ArcCatalog or added to ArcMap. Step-by-step instructions for connecting to an Excel spreadsheet can be found in the ESRI Knowledge Base. Go to http://support.esri.com and search for either “Excel” or for Article ID 15380.

Introduction to ArcGIS I 5-26Working with spatial data
5-26Introduction to ArcGIS ICopyright © 2000–2004 ESRI. All rights reserved.
Accessing data on the Internet
Connect to an Internet Map Server Example: Geography Network
Connecting to an Internet server To access services provided by an ArcIMS Internet Server, add an Internet server connection to the catalog. To establish the connection, provide the Universal Resource Locator (URL), which uniquely identifies the server on the Internet. Your connection can access all the services provided, or you can choose to have it access only the specific services in which you are interested.

Introduction to ArcGIS I 5-27Working with spatial data
5-27Introduction to ArcGIS ICopyright © 2000–2004 ESRI. All rights reserved.
ArcCatalog Options
Turn default data types on or off
Add new file types
Define Contents columns
Choose Metadata default style
Define Table appearance
Raster display defaults
Geoprocessor environment settings
Check files for CAD DGN format compliance
ArcCatalog Options TabsThe Options tabs allow you to redefine ArcCatalog’s default parameters for various functions.
•General—select which top level entries (i.e., entries in the catalog tree such as Search Results or GIS servers) are displayed by default and which types of data you want the catalog to show.
•File Types—add new file types, which are not contained within the list supplied in the General tab.
•Contents—define which standard and/or metadata columns are displayed with data rows within the Contents view.
•Metadata—define the default metadata stylesheet, Metadata Editor, and toggle on/off whether ArcCatalog automatically creates and/or updates metadata files.
•Geoprocessing—set default global environment settings such as preferred location for storing new feature classes
•Tables—choose how tables appear by default.
•Raster—select which raster formats ArcCatalog recognizes, define how various raster formats are displayed, and ArcCatalog builds pyramids to facilitate faster raster display.
•CAD—you can choose whether ArcCatalog does or does not check all file extensions for DGN compliance. It is recommended that users leave this off, in order to speed up ArcCatalog initialization and searches.

Introduction to ArcGIS I 5-28Working with spatial data
5-28Introduction to ArcGIS ICopyright © 2000–2004 ESRI. All rights reserved.
Add new file types
New file types displayed in catalog treeAdd nonspatial data formats
Import file types from Windows registry
Add new types not in registry
Add new file typesWhen you click the File Types tab, you can add any data type to be recognized and visible in your catalog tree. There are two methods available to add a new file type: manually, where you define the file extension and description, and ‘Import File Type From Registry’, which gives you the option of choosing a file type from all of the types already registered with your operating system. This second method automatically populates the extension, description, and the icon, if available. When you double-click a file type in ArcCatalog that you have imported from the registry, the operating system launches the appropriate application registered to that file.One significant benefit of adding new file types is that ArcCatalog—if you have set this function as active—automatically creates metadata files for any file types it recognizes.

Introduction to ArcGIS I 5-29Working with spatial data
5-29Introduction to ArcGIS ICopyright © 2000–2004 ESRI. All rights reserved.
Exercise 5 overviewUse ArcCatalog to browse data
Work with the Contents, Preview and Metadata views
Explore spatial data types:GeodatabasesShapefilesCoveragesCADRaster
Convert a shapefile to a geodatabase feature classChallenge: Create a thumbnailChallenge: Add another file type to ArcCatalog

Introduction to ArcGIS I 5-30Working with spatial data
5-30Introduction to ArcGIS ICopyright © 2000–2004 ESRI. All rights reserved.
Lesson 5 reviewArcGIS can work with spatial data in multiple formats. (T/F)
A shapefile is a folder containing multiple feature classes. (T/F)
Both shapefile and coverage formats are composed of multiple files. (T/F)
What two types of validation are available for the geodatabase?
You can store point and line geometries within a single feature class. (T/F)
What are three ways you can view data within ArcCatalog?
What are thumbnails?

����
����
�������������������� ��������������������������������
������� ����������
��������������� �� ������ ���������������������������� ������������������������� ������������������� ����� !"�������������� ��#���������������� ��$�������������%�� ��&'�������������� ��()*������������������%�+��� ��((*������������������%������� ��( ��%� ��(� ��%������� ��(�,����� ��(���-���,�����.�� ��(�
*������,����� ��(#/0�������������� ��($/0������1������� ��(&������������� �� )


Introduction to ArcGIS I 6-1Working with tables
Copyright © 2000–2004 ESRI. All rights reserved. Introduction to ArcGIS I
Working with tables
Introduction to ArcGIS I 6-2Working with tables
6-2Introduction to ArcGIS ICopyright © 2000–2004 ESRI. All rights reserved.
Lesson 6 overviewTable structureData typesTable manipulation Connecting tablesWorking with graphs and reports

Introduction to ArcGIS I 6-3Working with tables
6-3Introduction to ArcGIS ICopyright © 2000–2004 ESRI. All rights reserved.
TablesDescriptive information about featuresEach feature class has an associated tableOne row for each geographic feature
Right-click
TablesA table contains formatted descriptive information. In ArcGIS, the information in a table is generally associated with spatial data, such as a feature attribute table but can also be independent of any spatial data (e.g., nonspatial statistical data). For the purposes of this course, you will consider only tables that contain information related to spatial datasets.The feature attribute table contains descriptive information about the features in a feature class. To open a feature attribute table in ArcMap, right-click the layer and then click Open Attribute Table. In ArcCatalog, you select the table and view it using the Preview tab. The feature attribute table consists of fields (also known as columns or items). Each field represents one type of descriptive information. Each row (also known as a record) contains the attributes of one feature in the dataset.

Introduction to ArcGIS I 6-4Working with tables
6-4Introduction to ArcGIS ICopyright © 2000–2004 ESRI. All rights reserved.
Understanding table anatomyBasic table properties
Records/rows and fields/columns
Column types can store numbers, text, dates
Unique column names
Columns (fields)
Rows(records)
Attributevalues
Understanding table anatomyEach table has the same basic format: an array of rows and columns. With a table of spatial data, each row corresponds to a single feature. The intersection of a row and a column represents a specific attribute for a single feature. Different table formats have different numbers of preset default columns, but ANY table which stores spatial data must have at least two columns: a column, which stores a unique row identifier (e.g., ROWID, ObjectID), and a column, which stores the feature geometry (SHAPE).

Introduction to ArcGIS I 6-5Working with tables
6-5Introduction to ArcGIS ICopyright © 2000–2004 ESRI. All rights reserved.
Tabular data field typesDifferent field types store different kinds of valuesChoose the right field type for the right valueField types vary according to table format
Name: JupiterMoons: 16Diameter: 142,984 kmDate of Comet Shoemaker-Levy impact: 7/16/1994Rotation period: 9.8 hr
Text Date Short Long BLOB Float
Jupiter 7/16/1994 16 142984 9.8
A
Tabular data field typesTables are capable of storing date, number, and text values, but most tabular formats have several different field types to store this information. Choosing the best field type for the values to be stored is an important consideration. In addition, the available field types can vary between tabular formats (e.g., Is the date field stored as dd/mm/yy, mm/dd/yyyy, or dd/mm/yyyy/hh:mm:ss?). Supported formats in ArcCatalog include short integer, long integer, float, double, text, date, and blob. Consult the online documentation for more information about these column types.

Introduction to ArcGIS I 6-6Working with tables
6-6Introduction to ArcGIS ICopyright © 2000–2004 ESRI. All rights reserved.
Table manipulationOpen table in ArcMap or preview in ArcCatalog
Sort ascending or descending
Freeze/Unfreeze columns
Statistics
In ArcMapSelect recordsModify table values
Table manipulationArcGIS can perform many table operations, such as sort, find, select, and freeze. In ArcCatalog, you can create new tables as well as create and delete fields for existing tables. In ArcMap, you can add fields (outside of an edit session) and add new or edit existing table record values.

Introduction to ArcGIS I 6-7Working with tables
6-7Introduction to ArcGIS ICopyright © 2000–2004 ESRI. All rights reserved.
ArcGIS tabular formats
Each ArcGIS spatial format has a native tabular formatCoverage: INFO
Shapefile: .dbf
Geodatabase: RDBMS tables
Create a link between related tables in ArcMapUse ArcCatalog to connect to external tables
ArcGIS can convert between formats
ArcGIS tabular formatsArcGIS supports the use of multiple formats for the storage and management of tabular information. Each of ArcInfo’s primary spatial formats has its own native format. Coverages use INFO formatted tables; shapefiles store their attributes in dBase (.dbf) format; geodatabases rely on the format of their supporting RDBMS (e.g., Access or Oracle).Deciding on the proper format to store attribute information is an important part of database design and can affect how efficiently you access tabular information. To facilitate sharing of data in different formats, ArcGIS contains tools to convert between the various tabular formats. In addition, you can use ArcCatalog to connect to external tabular data sources by using the OLE DB connection option.

Introduction to ArcGIS I 6-8Working with tables
6-8Introduction to ArcGIS ICopyright © 2000–2004 ESRI. All rights reserved.
Associating tablesCan store attributes in feature table or separate tableAssociate tables with common column key values
Must be same data field types
Must know table relationships (cardinality)
Additional attribute tableFeature attribute table
Associating tablesTwo tables can be connected, or associated, if there is a similar field in each table containing common values. In the example, the tables are linked by the common field called ZONE_CODE. Once the tables are connected, the description of what each zone code means (from the DESCRIPTION field) can be accessed from the feature attribute table by looking up the value in the associated table. Often features have many attributes, so most database design guidelines promote organizing your database into multiple tables—each focused on a specific topic—instead of one large table containing all the necessary fields. This scheme prevents duplicate information in the database because you store the information only once in one table. Tables can be connected so that when you need information that is not in the current table, you can access it from an associated table.

Introduction to ArcGIS I 6-9Working with tables
6-9Introduction to ArcGIS ICopyright © 2000–2004 ESRI. All rights reserved.
Table relationshipsHow many A objects are related to B objects?Types of cardinality
One-to-one, one-to-many or many-to-one, and many-to-many
Must know cardinality before connecting tables
or
One parcel has one ownerOne parcel
has one ownerOne parcel
has many ownersOne parcel
has many ownersMany parcels
have one ownerMany parcels
have one ownerMany parcels
have many ownersMany parcels
have many owners
Table relationshipsWhen you associate two tables together, you need to know how the individual record values relate to each other. The record relationships (cardinality) are: one-to-one, one-to-many (many-to-one), and many-to-many. Knowing which relationship type you have prevents potential record omission errors. For instance, if you have a one-to-many association and you connect the tables as if they were a one-to-one association, you omit needed information from the connected table because one-to-one record searches stop looking for more matches after they find the first match. You can avoid these types of problems by becoming familiar with tabular database management strategies—strategies that also make you a better GIS user. Read the sections about tabular management in the online documentation.

Introduction to ArcGIS I 6-10Working with tables
6-10Introduction to ArcGIS ICopyright © 2000–2004 ESRI. All rights reserved.
Joins and relates
Two methods to associate tables in ArcMap based on a common field
Join appends the attributes from one onto the other
Label or symbolize features using joined attributes
Relate defines a relationship between two tables
Joins and relatesArcMap provides two methods to associate data stored in tables with geographic features: joins and relates. When you join two tables, you append the attributes from one onto the other, based on a field common to both tables. When you relate tables, you define a relationship between the two tables—also based on a common field—but do not append the attributes of one to the other. Instead, you can access the related data when necessary.You join two tables when the data in the tables has a one-to-one or a many-to-one relationship (e.g., you have a layer showing store locations, and you want to join a table of the latest monthly sales figures to it). You relate two tables when the data in the tables has a one-to-many or many-to-many relationship (e.g., your map displays a parcel database, and you have a table of owners; a parcel may have more than one owner, and an owner may own more than one parcel). Joins and relates are reconnected whenever you open the map. This way, if the underlying data in your tables changes, it is reflected in the join or relate.
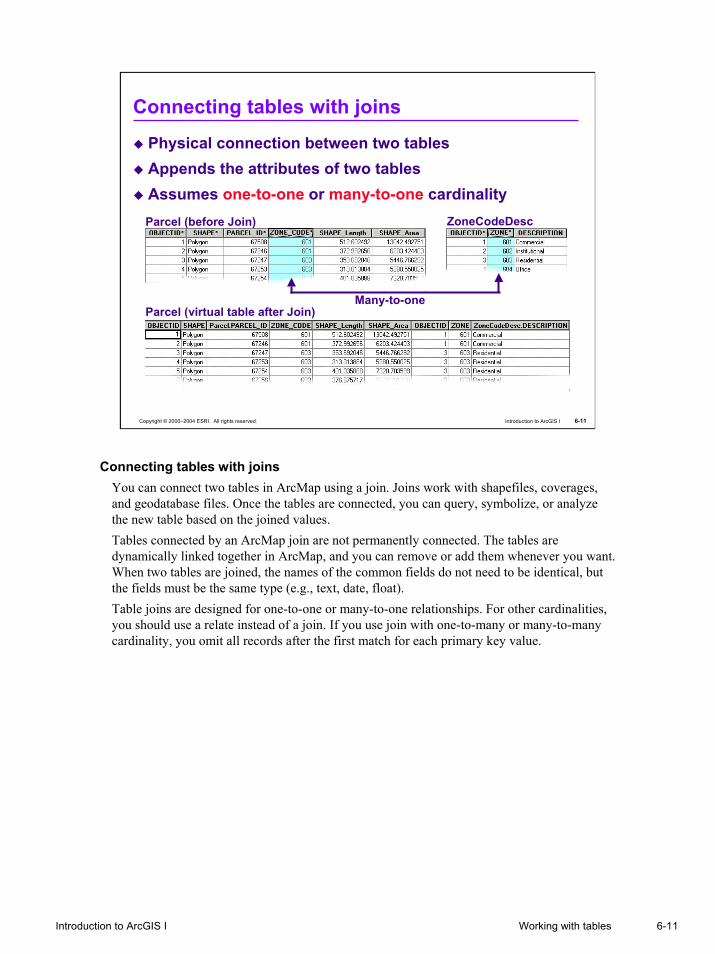
Introduction to ArcGIS I 6-11Working with tables
6-11Introduction to ArcGIS ICopyright © 2000–2004 ESRI. All rights reserved.
Connecting tables with joinsPhysical connection between two tablesAppends the attributes of two tablesAssumes one-to-one or many-to-one cardinalityParcel (before Join) ZoneCodeDesc
Parcel
Parcel (virtual table after Join)Many-to-one
Connecting tables with joinsYou can connect two tables in ArcMap using a join. Joins work with shapefiles, coverages, and geodatabase files. Once the tables are connected, you can query, symbolize, or analyze the new table based on the joined values.Tables connected by an ArcMap join are not permanently connected. The tables are dynamically linked together in ArcMap, and you can remove or add them whenever you want. When two tables are joined, the names of the common fields do not need to be identical, but the fields must be the same type (e.g., text, date, float).Table joins are designed for one-to-one or many-to-one relationships. For other cardinalities, you should use a relate instead of a join. If you use join with one-to-many or many-to-many cardinality, you omit all records after the first match for each primary key value.

Introduction to ArcGIS I 6-12Working with tables
6-12Introduction to ArcGIS ICopyright © 2000–2004 ESRI. All rights reserved.
Connecting tables with relatesDefine relationship between two tablesTables remain independent Additional cardinality choices
One-to-many, many-to-many
Discovers any related rows
2) Open related table1) Make selection
Connecting tables with relatesAnother way to connect tables in ArcMap is by creating a relate. Like joining tables, relating tables defines a relationship between two tables and is also based upon a common field. Unlike joining tables, a relate does not append the fields of one table to the other. Instead, the two tables remain as independent tables in ArcMap. ArcMap knows the two tables are connected, and you can access data in the related tables when you need it.You relate tables instead of joining them when there is a one-to-many or many-to-many relationship between the tables or when you need to maintain the information in the related table independent of the feature attribute table.

Introduction to ArcGIS I 6-13Working with tables
6-13Introduction to ArcGIS ICopyright © 2000–2004 ESRI. All rights reserved.
GraphsSummarize tabular informationA variety of graph formatsSet display propertiesAdd to a map
GraphsBy displaying data values graphically, graphs simplify the often difficult task of interpreting the large amount of quantitative (numerical) attribute data associated with layers.You can represent your data and analysis results using many styles of graphs including two-dimensional and 3D graphs. ArcGIS uses graphics server software that provides a variety of chart types so you can represent your data in the clearest and most efficient manner. Values for ArcGIS graphs come directly from feature attribute tables. Some graphs are better than others at presenting certain kinds of information. Carefully consider the information you want to present before choosing a graph style.You can control most visual aspects of the graph in order to create an effective display of your data. For example, you can add titles, label axes, change the color of graph markers, or change the color and font of the chart’s text.Once you have created a graph, you can add it to a map in ArcMap’s Layout View. When placed on the layout, a graph becomes a graphic element that you can size and position as desired.

Introduction to ArcGIS I 6-14Working with tables
6-14Introduction to ArcGIS ICopyright © 2000–2004 ESRI. All rights reserved.
Graph creation
Graph Wizard is a high-end professional graphing and plotting utility
Graph creationThe graphing tool in ArcMap can be activated in the Tools menu using the Graphs option. You can then create, manage, or load a graph. A series of wizard panels guides you through the process of creating a graph.Graphs present information about map features—and the relationship(s) between them—in an attractive, easy-to-understand graphic. They may show trends and/or patterns that are not easily visible in the attribute tables of the map features. They can show additional information about the features on the map or show the same information in a different way. The information displayed on a graph comes directly from the attribute information stored with your geographic data. Once a graph is created, adding it to your map is easy.

Introduction to ArcGIS I 6-15Working with tables
6-15Introduction to ArcGIS ICopyright © 2000–2004 ESRI. All rights reserved.
ReportsOrganize and display tabular dataGroup and format dataSave and exportTwo reporting tools
Report Writer
Crystal Reports
ReportsDisplaying your data in a report allows you to organize your data. You can sort records based on the values in one or more field. For example, given a list of countries, you can sort them by total population or alphabetically by their name. Then you can easily see which country has the largest population. You can group records and calculate summary statistics (sum, average, count, standard deviation, minimum, and maximum values). Reports can be divided into a series of sections; each one identifies a particular area on the report. You control how a report looks by manipulating the contents of a section and by setting properties, such as size and color. For example, the section at the top of the report typically contains the title and subtitle of the report; however, you do not have to include either of these report elements if you do not need them.You can save a report to a file on disk and use it with another map or in other software products. (When you save a simple report to a file, you are creating a static copy that is not linked to the actual data from which the report was created; therefore, you will not be able to modify the report.) You can export reports to different file types including Adobe’s Portable Document Format (PDF), Rich Text Format (RTF), or plain text (TXT). If you repeatedly use a consistent report design, you can build report templates that you can use to display information from different sources in a consistent manner.ArcGIS provides two tools for creating professional-looking reports from your tabular data. The Report Writer is an easy-to-use application available directly from ArcMap. It allows you to quickly produce reports for one table at a time. ArcGIS also comes with Crystal Reports. Crystal Reports has more advanced reporting tools available.

Introduction to ArcGIS I 6-16Working with tables
6-16Introduction to ArcGIS ICopyright © 2000–2004 ESRI. All rights reserved.
ArcMap Report Writer
Quick, easy, professional report creation
TitleTitle
Date and page numbers
Date and page numbers
Displayrecords
Displayrecords
Add bordersAdd bordersAdd an imageAdd an image
Choose fields
Choose fields
Calculate summary statistics
Calculate summary statistics
ArcMap Report WriterUsing the built-in ArcMap reporting tool, you can create reports that are stored directly with your map. Once created, you can add the report to your map layout and print it out.

Introduction to ArcGIS I 6-17Working with tables
6-17Introduction to ArcGIS ICopyright © 2000–2004 ESRI. All rights reserved.
Crystal ReportsA more powerful reporting toolExport to Crystal Reports formatWizard aids report creation
Crystal ReportsThe ESRI Crystal Reports Wizard is available with ArcGIS. Crystal Reports is an advanced reporting application that provides you with tools for creating sophisticated reports. You can use the ESRI Crystal Report Wizard to lead you through the process of creating dynamic, customized reports for your spatial data, or you can access Crystal Reports directly from your computer’s Start menu.Note: Crystal Reports 9 Standard Edition is distributed with ArcGIS. In order to access the reporting tools, you must first have Crystal Reports installed on your machine. This is an installation option you need to select when you first load ArcGIS.
Introduction to ArcGIS I 6-18Working with tables
6-18Introduction to ArcGIS ICopyright © 2000–2004 ESRI. All rights reserved.
Exercise 6A overviewExamine tables in ArcCatalogCreate a join between two tablesModify the appearance of the joined tableCreate a relate between two tablesMake a selection and examine the related tableLabel features with joined attributesChallenge: Format labels

Introduction to ArcGIS I 6-19Working with tables
6-19Introduction to ArcGIS ICopyright © 2000–2004 ESRI. All rights reserved.
Exercise 6B overviewCreate a graph and set display properties Export the graphGenerate the report
Display report properties and specify fieldsSet the sorting and summary options
Embed the graph in the reportAdd the report to the layout

Introduction to ArcGIS I 6-20Working with tables
6-20Introduction to ArcGIS ICopyright © 2000–2004 ESRI. All rights reserved.
Lesson 6 review
There are different field types for different data formats. (T/F)Each field in a table must have a unique name. (T/F)Attributes and features are linked by ____________ .Coverages store attributes in an ____________ file, shapefiles store attributes in a ___________ file, and the geodatabase stores attributes in a ___________ .What is table cardinality, and why is it important?What are the main differences between joins and relates in ArcMap?
Introduction to ArcGIS I 6-21Working with tables
6-21Introduction to ArcGIS ICopyright © 2000–2004 ESRI. All rights reserved.
Lesson 6 review
How do you access a layer’s feature attribute table in ArcMap?How many records in a feature attribute table are associated with a feature?What is the difference between the default and user-defined fields in an attribute table?

Introduction to ArcGIS I 6-22Working with tables
6-22Introduction to ArcGIS ICopyright © 2000–2004 ESRI. All rights reserved.

����
����
�������������������� ��������������������������������
���������
��������������� � ��������������������������� � ����������������� � ����� �� �������������� � !�������� �����"�� � #���$��������� ��"������� � �%�&�� �������&������ � '(��� ����$$�� � )��������&� � *+,�����-���.���"�����& � **�����/�.���"������0����$��.���"� � *��1����2����.���"�������,"��3��/ �� � *��"�� ,��$�����3��/ �� � *�,����� ������1���$���� � *!����� ��"�� � *#
��������� � *��&����������1�����"� � *'�����/�� ��1����� �����"�� � *),�������&������������� � �+�1�������������� � �*��������4������ � �������� ������"������������������������"�� � �������� ������"�����������$�������� � ����&�� ������������ �� � �!����������� ����������$ � �#����� �������������������,����� � ������������� ����������������1 � �',�����-���.���"��,���� � �)
�1�������4������ � �+������������� � �*


Introduction to ArcGIS I 7-1Editing data
Copyright © 2000–2004 ESRI. All rights reserved. Introduction to ArcGIS I
Editing data
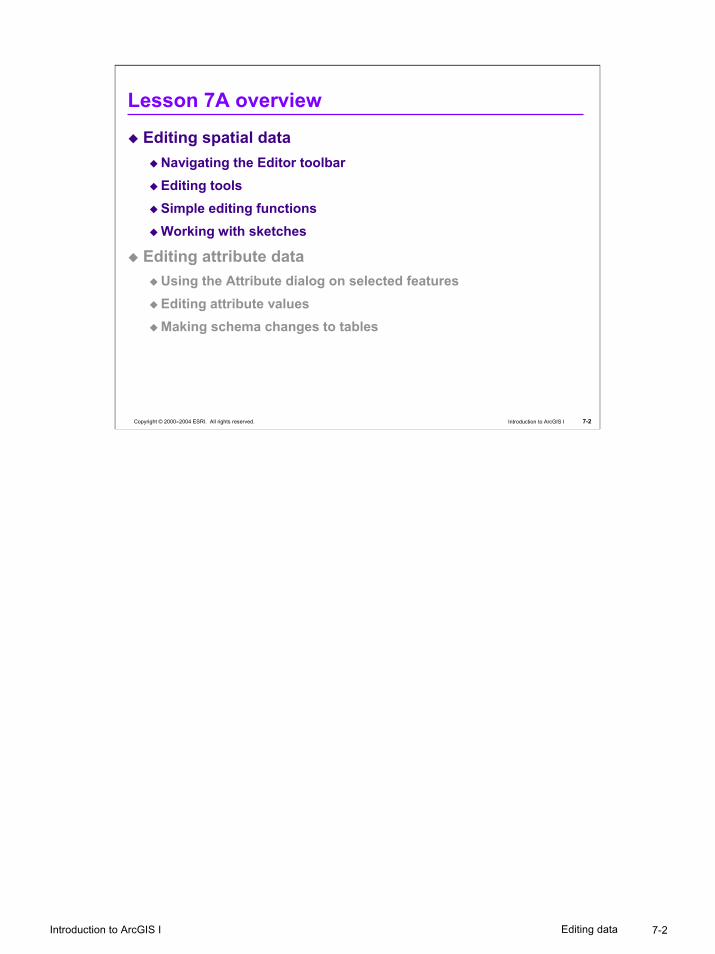
Introduction to ArcGIS I 7-2Editing data
7-2Introduction to ArcGIS ICopyright © 2000–2004 ESRI. All rights reserved.
Lesson 7A overviewEditing spatial data
Navigating the Editor toolbarEditing toolsSimple editing functionsWorking with sketches
Editing attribute dataUsing the Attribute dialog on selected featuresEditing attribute valuesMaking schema changes to tables

Introduction to ArcGIS I 7-3Editing data
7-3Introduction to ArcGIS ICopyright © 2000–2004 ESRI. All rights reserved.
ArcGIS editable data formatsShapefiles
Personal geodatabase feature classes
ArcEditor, ArcInfo to edit Enterprise geodatabase
Editable data formatsAll license levels of ArcGIS (ArcView, ArcEditor, and ArcInfo) allow you to edit shapefiles and feature classes in a personal geodatabase. An ArcEditor or ArcInfo license, along with ArcSDE, also allows you to edit an Enterprise geodatabase. Whether you are using ArcView, ArcEditor, or ArcInfo, you use the same editing tools in ArcMap to work on your geographic data. Data that is in the coverage format can only be edited using ArcInfo Workstation.

Introduction to ArcGIS I 7-4Editing data
7-4Introduction to ArcGIS ICopyright © 2000–2004 ESRI. All rights reserved.
The Editor toolbarAll editing functions are controlled through the toolbarEdit ToolEdit Tool Sketch ToolSketch Tool
Target layerTarget layer
Edit sessioncommands
Edit sessioncommands
Split ToolSplit Tool Rotate ToolRotate Tool
Attributedialog
Attributedialog
Sketch PropertiesSketch
Properties
Task listTask list
Navigating the Editor toolbarIn ArcMap, editing operations are controlled through the Editor toolbar. The toolbar contains several important controls:
• Editor menu: This menu contains the commands for beginning, ending, and saving edit sessions. It also provides access to several editing operations, snapping controls, and editing options.
• Edit Tool: This tool is used to select features for editing.
• Sketch Tool: This is the primary tool for editing spatial features. It allows you to digitize in new features or modify the shape of existing features. The actual operation the tool performs is controlled by the Task list.
• Task list: You choose your desired editing operation from this dropdown list.
• Target layer: This control allows you to select the layer you want to edit.
• Split tool: Allows you to divide a select feature into two features.
Rotate tool: Allows you to interactively rotate selected features using the mouse or anangular measurement.
• Attribute dialog: This window allows you to edit the attribute values of selected features.
• Sketch Properties: Allows you to edit the vertices of a sketch.

Introduction to ArcGIS I 7-5Editing data
7-5Introduction to ArcGIS ICopyright © 2000–2004 ESRI. All rights reserved.
Managing edit sessionsStarting a session
Within one data frame at a time
Within one geodatabase at a time
Within one directory at a time
Saving editsDuring the edit session
At the end of the edit session
Ending a session
Starting an edit sessionIf you have started an edit session in a map document, where the layers come from more than one storage location (i.e., more than one personal geodatabase or network file directory), you are prompted to select the single data source, which will be edited. A personal geodatabase may only have one editor at a time; this does not mean one user but rather one application. For example, if you have started an edit session in ArcMap and move to ArcCatalog to delete or add fields to a table or feature class within the same personal geodatabase, you are not allowed to make your changes. This is because the first application to access the personal geodatabase puts a schema lock on the entire geodatabase.
Managing edit sessionsIn ArcMap, you begin, end, and save edit sessions using the Editor menu on the Editor toolbar. When ending an edit session, ArcMap prompts you to save your edits. If you do not save, your edits are not committed back to the edit layer.
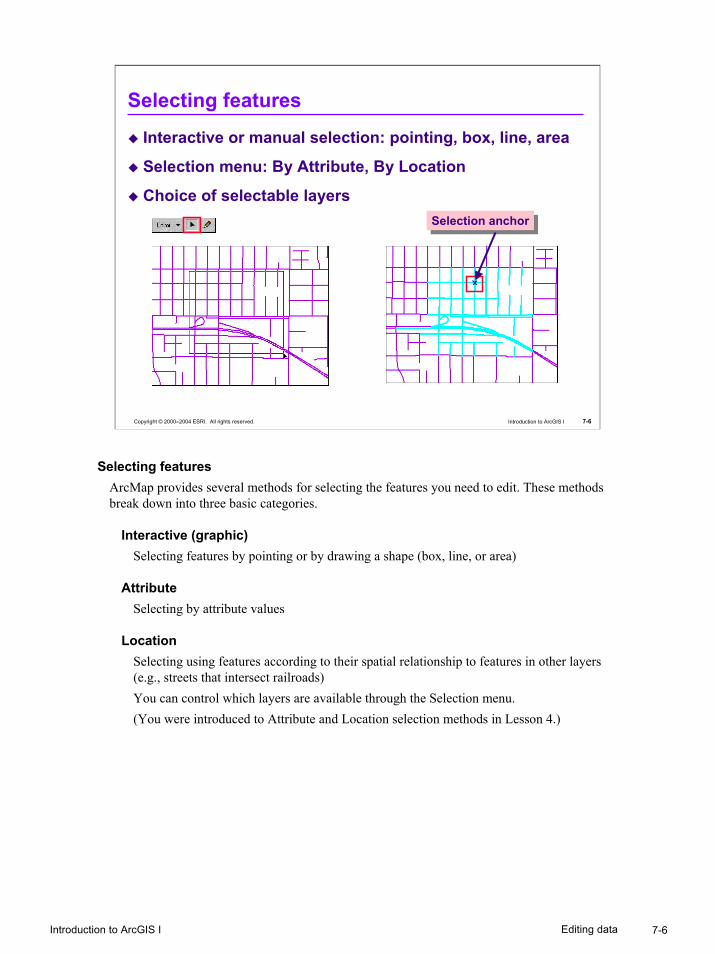
Introduction to ArcGIS I 7-6Editing data
7-6Introduction to ArcGIS ICopyright © 2000–2004 ESRI. All rights reserved.
Selecting featuresInteractive or manual selection: pointing, box, line, area
Selection menu: By Attribute, By Location
Choice of selectable layersSelection anchorSelection anchor
Selecting featuresArcMap provides several methods for selecting the features you need to edit. These methods break down into three basic categories.
Interactive (graphic)Selecting features by pointing or by drawing a shape (box, line, or area)
AttributeSelecting by attribute values
LocationSelecting using features according to their spatial relationship to features in other layers (e.g., streets that intersect railroads) You can control which layers are available through the Selection menu.(You were introduced to Attribute and Location selection methods in Lesson 4.)

Introduction to ArcGIS I 7-7Editing data
7-7Introduction to ArcGIS ICopyright © 2000–2004 ESRI. All rights reserved.
Delete
Cut
Copy
Paste
Undo/Redo
Simple editing functionsMoving
Click and drag
Delta x,y coordinates
Set sticky move tolerance
Rotating
Others
Editing functionsArcMap contains several simple functions for editing spatial features. You can select features and move them by dragging or by using discrete coordinates. Features can also be rotated interactively around their selection anchor. The anchor can be moved anywhere on the page to achieve the desired result. In addition, you can use the generic Windows OS delete, cut, copy, and paste tools and their associated default shortcut keys (Ctrl+X, Ctrl+V, and so on). The Undo button steps back until your previous save. If you hover your cursor over the Undo or Redo button, a ToolTip appears, which tells you which operation is next.
Sticky move toleranceThe Sticky move tolerance is an option that can be set to prevent features from inadvertently being moved during an edit session. The default value for this option is 0. For example, if a value of 30 pixels is entered, the selected feature does not move at all until the mouse has been moved 30 pixels. The feature then jumps to the location of the mouse. This function works independently of the snapping environment with a number of editing tools but is set in the same Options dialog General tab as the snapping tolerance.

Introduction to ArcGIS I 7-8Editing data
7-8Introduction to ArcGIS ICopyright © 2000–2004 ESRI. All rights reserved.
Working with sketchesUse to create, modify, reshape features
Temporary graphic represents feature geometryLeft mouse button adds vertices or points
Double-click or F2 key to finish sketchRight-click to access context menu
Sketch ToolsSketch Tools
Working with sketchesIn ArcMap, every feature’s geometry is represented by a sketch. A sketch consists of vertices (the end points of line segments, which normally indicate a change in direction) and segments (the lines that connect the vertices). When you edit a feature in ArcMap, you are working with its sketch, not the original features. ArcMap allows you to edit existing features or to create new ones in an existing feature class. To create a new feature, you must first create a sketch. Likewise, to edit a feature, you must edit its sketch. When you save, the feature is updated with the changes you made to its sketch. You can create only line and polygon sketches because points have neither vertices nor segments.The Sketch Tool is the primary editing device in ArcMap. It lets you add new features by digitizing or lets you modify existing features by performing an editing task from the Edit task list.When using the Sketch Tool, the left mouse button adds features, and the right mouse button accesses the Sketch Tool context menu. You can double-click to finish your sketch or by right-clicking to access the context menu and choosing to Finish Sketch. From the context menu, you also have the option to Finish Part. This allows you to create multipart features (e.g., many islands that belong to one country).
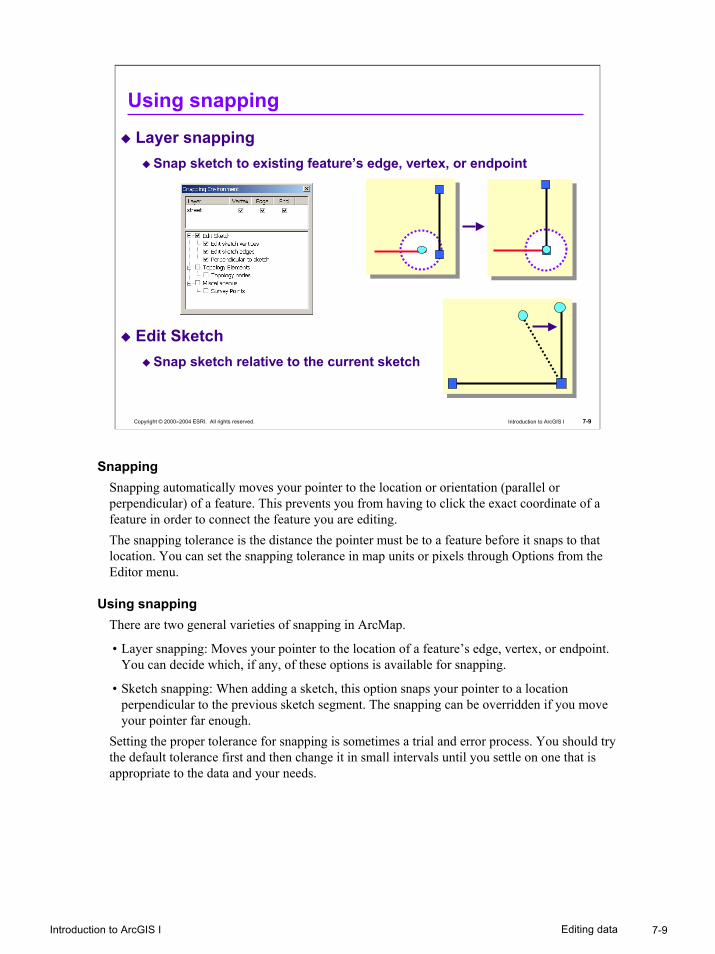
Introduction to ArcGIS I 7-9Editing data
7-9Introduction to ArcGIS ICopyright © 2000–2004 ESRI. All rights reserved.
Layer snappingSnap sketch to existing feature’s edge, vertex, or endpoint
Edit SketchSnap sketch relative to the current sketch
Using snapping
SnappingSnapping automatically moves your pointer to the location or orientation (parallel or perpendicular) of a feature. This prevents you from having to click the exact coordinate of a feature in order to connect the feature you are editing.The snapping tolerance is the distance the pointer must be to a feature before it snaps to that location. You can set the snapping tolerance in map units or pixels through Options from the Editor menu.
Using snappingThere are two general varieties of snapping in ArcMap.
• Layer snapping: Moves your pointer to the location of a feature’s edge, vertex, or endpoint. You can decide which, if any, of these options is available for snapping.
• Sketch snapping: When adding a sketch, this option snaps your pointer to a location perpendicular to the previous sketch segment. The snapping can be overridden if you move your pointer far enough.
Setting the proper tolerance for snapping is sometimes a trial and error process. You should try the default tolerance first and then change it in small intervals until you settle on one that is appropriate to the data and your needs.

Introduction to ArcGIS I 7-10Editing data
7-10Introduction to ArcGIS ICopyright © 2000–2004 ESRI. All rights reserved.
Sketch tool works with the current task
Task examples:Create New Feature
Modify Feature
Reshape Feature
Extend/Trim Features
Cut Polygon Features
Auto-Complete Polygon
Edit tasks
Current taskCurrent task
Edit tasksMany different edit tasks are available in ArcMap. These different tasks work in conjunction with the Sketch Tool. Some of these tasks may automatically be selected depending upon the geometry being edited and whether you are editing a new sketch or existing features. A sample of these edit tools is discussed in the next few pages.

Introduction to ArcGIS I 7-11Editing data
7-11Introduction to ArcGIS ICopyright © 2000–2004 ESRI. All rights reserved.
Sketch is used to add new features to the Target layer
Editor toolbar menu operations also create new features
Create New Feature task
Finished Sketch
Target layerTarget layerSketch ToolSketch Tool
Create New Feature taskYou can create a sketch by creating the vertices and segments that make up the features. Vertices are marked in green, with the last vertex added marked in red.The Sketch Tool is the tool you use most often to create a sketch. It has an accompanying context menu that helps you place vertices and segments more accurately.
Other operationsYou can create new features by using a basic Copy/Paste operation between target layers. Additional functionality and control can be found under the Editor toolbar dropdown list. Depending upon the geometry of your selected features and the target layer, you will have access to one of a number of editing operations, which create new features. These functions are: Move, Split, Divide, Buffer, Copy Parallel, Merge, Union, Intersect, and Clip. More information regarding these functions can be found in the ArcGIS Desktop Help or in the Introduction to ArcGIS II course.

Introduction to ArcGIS I 7-12Editing data
7-12Introduction to ArcGIS ICopyright © 2000–2004 ESRI. All rights reserved.
Modify Feature and Reshape FeatureModify Feature Task
Edit the vertices of an existing feature
Modify one feature at a time
Shortcut: Double-click with the Edit Tool
Reshape Feature TaskFeature takes the shape of the intersecting sketch
Modify Feature taskThe Modify Feature task allows you to edit the vertices of an existing feature to change its shape. While using the Modify Feature task, you may only modify one feature at a time. Hover your mouse pointer over the vertex you want to modify. You notice that the cursor icon changes. Click on the vertex and drag it to a new location.
Reshape Feature taskThe Reshape Feature task can be used to digitize a sketch that becomes part of the feature you are reshaping. You start by sketching the new shape of the feature, ensuring that your sketch intersects with the existing feature.

Introduction to ArcGIS I 7-13Editing data
7-13Introduction to ArcGIS ICopyright © 2000–2004 ESRI. All rights reserved.
Extend/Trim Features and Cut PolygonExtend/Trim Features
Cut Polygon Features
Extend to sketchExtend to sketch Trim to right of sketchTrim to right of sketch
Cut into two partsCut into two parts
Extend/Trim Features taskOften when creating new features, you may end up with features that are either too short or too long. There are tools in ArcMap to remedy these undershoots or overshoots.
Extend feature to the sketchYou can fix an undershoot with the Extend/Trim Features task. First you need to select the feature to be extended. Then sketch a short line to where you want to extend it (most likely another line). Once you sketch the second vertex, the selected feature extends to meet your sketch.
Trim features on the right side of the sketchYou can also fix an overshoot with the Extend/Trim Features task. First you need to select the feature to be trimmed. Then sketch a short line to where you want to trim it to (most likely another line). Once you digitize the second vertex, the selected feature trims to the right of where it meets your sketch. The sketch disappears from the screen.
Cut Polygon Features taskThe Cut Polygon Features task can be used to sketch a line that splits one polygon into two. This tool is especially useful for parcel management. The sketched line must intersect both sides of the polygon feature to cut it.

Introduction to ArcGIS I 7-14Editing data
7-14Introduction to ArcGIS ICopyright © 2000–2004 ESRI. All rights reserved.
Auto-Complete PolygonAutomatically maintain coincidence
Align new polygon with existing features
Auto-Complete PolygonThe Auto-Complete Polygon task allows you to add a new polygon to the edge of existing polygon features without having to sketch in a duplicate boundary between them. Using this task, you sketch in all the polygon boundaries except the one common to the other adjacent polygon(s). This task is extremely useful for maintaining data quality; by using this task, you eliminate the potential for creating small ‘sliver’ polygons when digitizing.

Introduction to ArcGIS I 7-15Editing data
7-15Introduction to ArcGIS ICopyright © 2000–2004 ESRI. All rights reserved.
IntersectionAdds a vertex at the implied intersection of two segments
Distance-DistanceAdds a vertex at given distances from two points
Absolute X,Y
Creating a vertex or point
Radius = 40
Radius = 55
New pointNew point
Intersection toolThe Intersection tool creates a point or vertex at the implied intersection of two segments based on existing features. Implied means that the segments do not have to actually intersect on the map. The Intersection tool creates a point or vertex at the place where the segments would intersect if extended far enough.
Distance-Distance toolSuppose you want to install a pole at a certain location. If you do not have the exact coordinate location but know that it is at the intersection of 40 meters from the corner of one building and 55 meters from the corner of another, you can use the Distance-Distance tool to place the point. The Distance-Distance tool allows you to create a vertex or point at the intersection of two distances from two other points.
Absolute X,YYou access this function through the Sketch Tool context menu. If your target layer is a point feature class, a new point can be created at an explicit location based on map units. If your target layer is a line or polygon feature class, the coordinates are used as an insertion point for a new vertex from which you start a new sketch.
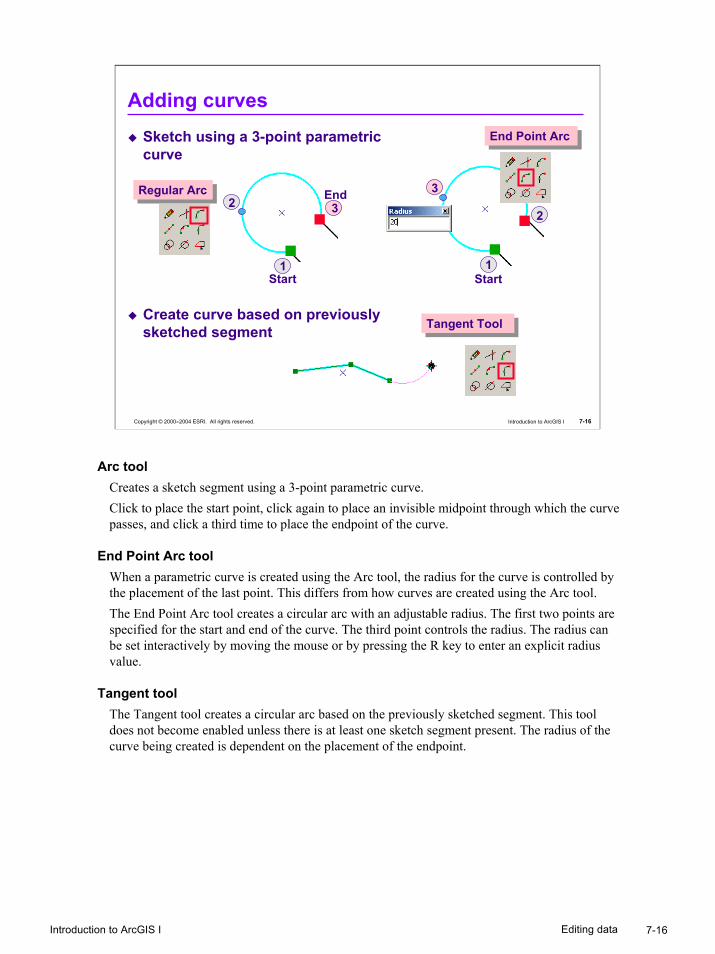
Introduction to ArcGIS I 7-16Editing data
7-16Introduction to ArcGIS ICopyright © 2000–2004 ESRI. All rights reserved.
Adding curvesSketch using a 3-point parametric curve
Create curve based on previously sketched segment
2
1Start
3End 3
1Start
2
End Point ArcEnd Point Arc
Regular Arc Regular Arc
Tangent ToolTangent Tool
Arc tool Creates a sketch segment using a 3-point parametric curve.Click to place the start point, click again to place an invisible midpoint through which the curve passes, and click a third time to place the endpoint of the curve.
End Point Arc toolWhen a parametric curve is created using the Arc tool, the radius for the curve is controlled by the placement of the last point. This differs from how curves are created using the Arc tool.The End Point Arc tool creates a circular arc with an adjustable radius. The first two points are specified for the start and end of the curve. The third point controls the radius. The radius can be set interactively by moving the mouse or by pressing the R key to enter an explicit radius value.
Tangent toolThe Tangent tool creates a circular arc based on the previously sketched segment. This tool does not become enabled unless there is at least one sketch segment present. The radius of the curve being created is dependent on the placement of the endpoint.

Introduction to ArcGIS I 7-17Editing data
7-17Introduction to ArcGIS ICopyright © 2000–2004 ESRI. All rights reserved.
Trace toolTrace along selected features
Select features
Click to start and stop the trace
Press O to specify an offset
Trace toolYou can create segments by tracing over the segments of selected features using the Trace tool. Suppose you want to create a new water main that is offset five meters from the parcel boundaries. Using the Trace tool, you can create new segments in the sketch that are at the same angle as the selected parcel boundaries but constructed at an offset value of five meters.

Introduction to ArcGIS I 7-18Editing data
7-18Introduction to ArcGIS ICopyright © 2000–2004 ESRI. All rights reserved.
Sketch context menus
Right-click is location sensitive
Sketch context menu
Sketch context menu
Cursor directly overlast vertex
Cursor directly overlast vertex Cursor
away fromlast vertex
Cursor away fromlast vertex
Sketch Tool context menuSketch Tool
context menu
Context menus for editingA context menu is a floating menu that pops up at the location of the pointer when you press the right mouse button. There are two types of context menus related to sketches: a Sketch Tool context menu and a Sketch context menu.
Sketch ToolWhen using the Sketch Tool, you access the Sketch Tool context menu by right-clicking the mouse away from the sketch you are creating. The menu contains options for placing the vertices and segments specifically where you want them. For example, you can set a segment to be a certain length or angle or create a vertex at a specific x,y coordinate location.
SketchThe Sketch context menu works with both new sketches and sketch elements, as well as sketches derived from existing features. You expose the sketch for existing features by first selecting the feature(s) with the Edit Tool and double-clicking. You see that the original feature remains selected (highlighted with the default cyan color), but the sketch has now been added for you to edit.

Introduction to ArcGIS I 7-19Editing data
7-19Introduction to ArcGIS ICopyright © 2000–2004 ESRI. All rights reserved.
Modifying existing featuresDouble-click feature to expose sketch elements
Insert Vertex
Delete Vertex
Move vertices delta x,y or exact x,y
Editing verticesThe Sketch context menu allows you to manipulate existing vertices; use the Edit Tool to select and double-click a feature to expose the sketch. You can insert a vertex by right-clicking on a sketch at the location where you want to insert a vertex. You can also delete and move vertices. You can move a vertex to a specific x,y location by clicking Move To, or you can click Move and specify a distance to move the vertex in the x and y direction. Note the difference between the selected feature and the sketch as illustrated in the slide (most obvious with the Delete Vertex example). Until you click Finish Sketch, you have only manipulated the sketch, not the underlying feature’s geometry.

Introduction to ArcGIS I 7-20Editing data
7-20Introduction to ArcGIS ICopyright © 2000–2004 ESRI. All rights reserved.
Next sketch segmentDirection/Length
Directions based on existing featuresParallel
Control sketch elements
Direction = 30°Length = 25 mDirection = 30°Length = 25 m
Parallel toParallel to
LengthsThere are two ways you can specify length using the Sketch Tool context menu.
Specify a length constraint from the last vertexYou can choose Length from the context menu when your next vertex will be at a certain distance from the current vertex. This creates a line segment of a specific length.
Change the length of the last segmentThe Change Length option allows you to change the length of the last segment created.
Specifying directionSometimes features are required to be entered with specific directions between their component segments. ArcMap is equipped with specific direction measurement tools for data entry. Right-clicking on a point slightly away from the last vertex entered brings up the Sketch Tool context menu with several choices of how to enter directional data.
Angles based on other featuresAngles can also be measured based on the direction of other features. The Sketch Tool context menu shows three such options: Parallel, Perpendicular, and Segment Deflection. Hold the pointer on the segment you want to base your angle on, and right-click to select the option from the context menu. The Segment Deflection option can be used to create a segment at an angle from another segment. Here you are maintaining the angle of the new segment to be the same as the deflection angle of an existing segment. Parallel constrains a new segment to be parallel to an existing feature. Perpendicular constrains a new segment to be perpendicular to an existing feature.

Introduction to ArcGIS I 7-21Editing data
7-21Introduction to ArcGIS ICopyright © 2000–2004 ESRI. All rights reserved.
Exercise 7A overviewAdd the Editor toolbar and start an edit sessionExplore the editing environment
Set snapping environment and tolerances
Select, move, rotate, and delete featuresEdit vertices on existing featuresCreate features using the Sketch ToolsCreate a new feature class in a geodatabase

Introduction to ArcGIS I 7-22Editing data
7-22Introduction to ArcGIS ICopyright © 2000–2004 ESRI. All rights reserved.
Lesson 7B overviewEditing spatial data
Navigating the Editor toolbarEditing toolsSimple editing functionsWorking with sketches
Editing attribute dataUsing the Attribute dialog on selected featuresEditing attribute valuesMaking schema changes to tables

Introduction to ArcGIS I 7-23Editing data
7-23Introduction to ArcGIS ICopyright © 2000–2004 ESRI. All rights reserved.
Attribute dialog allows viewing and editing of selected feature attributes
Add or copy/cut and paste values for single or multiple selected features
Editing attribute data for selected features
Selected featurelayer name
Selected featurelayer name
PrimaryattributePrimaryattribute
Attributevalues
Attributevalues
Click to highlight selected feature
Click to highlight selected feature
Right-click opens context menu
Right-click opens context menu
Editing attribute dataThe Attributes dialog lets you view attributes of features you have selected in your map. The left side of the dialog contains a list of the features you have selected. Features are listed by their primary display field and grouped by layer name. The right side of the Attributes dialog contains two columns: the attribute properties of the layer you are viewing, such as Type or Owner, and the values of those attribute properties.You can copy individual attributes or all the attributes of a feature. Attributes can be pasted to a single feature or to all selected features in a layer. To copy an attribute value to a layer, copy the value and right-click on the layer name. Click Paste, and the attribute value is copied to every selected feature in the layer. You can cut and paste attributes just like you copy and paste attributes by choosing Cut from the context menu. Cut removes the attribute value you are copying from the Attributes dialog.

Introduction to ArcGIS I 7-24Editing data
7-24Introduction to ArcGIS ICopyright © 2000–2004 ESRI. All rights reserved.
Editing attributes on an open tableDirect edits to a single cell
Use the Field CalculatorCalculate field values for an open table
Simple calculations or advanced functions
In or out of an ArcMap edit session
Field CalculatorBy accessing the Field Calculator, you can edit attribute values directly on the attribute table. Open the calculator by right-clicking the field you want to edit values for. The Field Calculator menu lets you perform simple calculations and complex logical expressions that can include other fields in the table. You can use this functionality in ArcMap at any time, but if outside an edit session, you do not have the ability to undo your operation should an error occur.

Introduction to ArcGIS I 7-25Editing data
7-25Introduction to ArcGIS ICopyright © 2000–2004 ESRI. All rights reserved.
Making schema changesSometimes the database structure must be updated
Add table fields
Delete table fields
Create new feature classes and feature datasets
Create new personal geodatabases
Even good database designs cannot predict everything
ArcCatalog is the schema editor
Schema“Schema” is the term used to describe the structure of data layers (tables, feature classes, and so on) and geodatabases. Schematic design may include more than just table column structures. Schema may also describe such objects as permanent, database-level relationships between tables, attribute validation structures, feature datasets, geometric networks, and more. ArcCatalog is the schema editor for ArcGIS and provides you with all of the tools necessary to create and maintain spatial and attribute data structures.
Licenses and data typesWith ArcView, you are able to edit only geodatabase tables and shapefile dBase (.dbf) files. ArcEditor gives you additional editing functionality with Enterprise geodatabase tables (i.e., SDE Layers); ArcInfo provides you with additional tools to manipulate coverage table files.

Introduction to ArcGIS I 7-26Editing data
7-26Introduction to ArcGIS ICopyright © 2000–2004 ESRI. All rights reserved.
Schema changes in ArcMapAdd fields
Must be outside edit session
Export data
Tables in ArcMapThe relationship between ArcGIS applications is: ArcCatalog is the schema editor, and ArcMap is the feature and attribute editor. ArcMap provides you with many tools to edit, manipulate and create attribute values. However, you can perform some limited schema editing with ArcMap; specifically, you can add a new field to a table. In order to do this, you need to be outside of an edit session. This is due to the fact that once you start an ArcMap edit session, ArcGIS puts a schema lock on any feature classes that are being edited.Another method for making schema changes in ArcMap is to export data. ArcMap gives you the option of creating a new shapefile or geodatabase feature class from all or selected features. This necessarily creates new schema, as the existing feature attributes are transferred to the new feature class.

Introduction to ArcGIS I 7-27Editing data
7-27Introduction to ArcGIS ICopyright © 2000–2004 ESRI. All rights reserved.
Adding table fields in ArcCatalog
Choose the field type
Choose the field type
Type in new field name
Type in new field name
Set the field properties
Set the field properties
Adding fieldsTo add a new field to an existing table in ArcCatalog, first access the table Properties dialog and click the Fields tab. Click the first empty cell under the Field Name and type in the name of the new field. Under Data Type, click the down triangle to get a listing of possible data types to select from. Once selected, the Field Properties panel expands so you can set additional properties for the new field. Set an appropriate length for the field.
Deleting fieldsIn the same Feature Class Properties tab, select the field and push the delete key. Keep in mind that there is no undo function in ArcCatalog, and once deleted, you will not be able to retrieve any lost information.

Introduction to ArcGIS I 7-28Editing data
7-28Introduction to ArcGIS ICopyright © 2000–2004 ESRI. All rights reserved.
Schema changes with ArcToolboxCopy rows
Create table
Create feature class
Convert data
ArcToolbox ToolsArcToolbox contains a number of tools, which involve schema edits. Some examples:
• Conversion Tools—import existing table structures
• Data Management Tools—allow you to create new tables, copy rows, drop fields, and more
• Layers and Table Views—provide the option of creating new tables from a number of source tables, as well as virtual table views

Introduction to ArcGIS I 7-29Editing data
7-29Introduction to ArcGIS ICopyright © 2000–2004 ESRI. All rights reserved.
Create New Feature ClassSimilar to table but with geometry data type
Define Geometry Type
Define Spatial Reference
Create New Feature ClassWhen creating a new empty feature class, you use ArcCatalog to define the schema. You are presented with a number of interface panels, which prompt you to define various parameters of the new feature class. The most important of these parameters, Geometry Type and Spatial Reference, are defined for the SHAPE field, which stores the geometry of the features.

Introduction to ArcGIS I 7-30Editing data
7-30Introduction to ArcGIS ICopyright © 2000–2004 ESRI. All rights reserved.
Exercise 7B overviewUse the Field Calculator to update values for a new fieldUse the Attribute editor to update feature attributes

Introduction to ArcGIS I 7-31Editing data
7-31Introduction to ArcGIS ICopyright © 2000–2004 ESRI. All rights reserved.
Lesson 7 reviewYou must be in an edit session in order to use the Field Calculator. (T/F)Before you can edit a feature, you must first select it with the Sketch Tool. (T/F)The Task list controls what function the Sketch Tool can perform. (T/F)You can save your edits while editing or at the end of the edit session. (T/F)When editing a sketch, you are also altering the source data. (T/F)All editing functions are controlled by the Tools toolbar. (T/F)What is a sketch?

Introduction to ArcGIS I 7-32Editing data
7-32Introduction to ArcGIS ICopyright © 2000–2004 ESRI. All rights reserved.
Lesson 7 reviewHow do you invoke the Sketch context menu?Why is setting the snapping environment important?You can add a field to your attribute table in ArcCatalog while the table is active in ArcMap. (T/F)

����
����
�������������������� ��������������������������������
������� �������������������
��������������� �� ������������������� ������������������� ���������������������������� ������������� ������� ��!"�#�#�$������ ��%&�$������������� ���'�#������#�$������ ��(�������������������#������ ��)*+�����#�$�������������� ��)),�����#�$�������������� ��) -�"�#�����#�$������ ��)���������#�$������ ��)�./������������� ��)�������������� ��)!


Introduction to ArcGIS I 8-1Working with georeferenced data
Copyright © 2000–2004 ESRI. All rights reserved. Introduction to ArcGIS I
Working with georeferenced data
Introduction to ArcGIS I 8-2Working with georeferenced data
8-2Introduction to ArcGIS ICopyright © 2000–2004 ESRI. All rights reserved.
Lesson 8 overviewGeoreferencingCoordinate systemsDatums Projections and distortionProjecting your data

Introduction to ArcGIS I 8-3Working with georeferenced data
8-3Introduction to ArcGIS ICopyright © 2000–2004 ESRI. All rights reserved.
What is georeferencing?Data is referenced to a location on the earth’s surface
Geographic coordinate systems
Projected coordinate systems
What is georeferencing?People working with a GIS are interested in analyzing relationships among real-world objects. It is important to recognize that a GIS only depicts abstractions of reality. Therefore it is crucial to depict the real world as accurately as you can if you want accurate analysis results.When representing real-world features in a GIS, you need to reference the data describing them to the correct location on the earth’s surface. This is called georeferencing. If features are not located precisely or if their shapes are represented incorrectly, using a map or GIS to analyze their spatial relationships yields inaccurate results. Georeferencing is the process of establishing a relationship between the data displayed in your GIS software and its real-world location. This is accomplished by using a coordinate system.To get accurate analysis results from your GIS database, you need to understand and determine your coordinate system. An ellipsoid, datum, a projection, and units make up a coordinate system.

Introduction to ArcGIS I 8-4Working with georeferenced data
8-4Introduction to ArcGIS ICopyright © 2000–2004 ESRI. All rights reserved.
Coordinate systems
Geographic coordinate system
Latitude and longitude are not uniform across the earth’ssurface
Cartesian coordinate system
Measures of length and angleare uniform
- X+ Y
- X- Y
+ X- Y
X
+ X+ Y
Data
usually here
Y
Geographic The most common locational reference system is the spherical coordinate system measured in latitude and longitude. This system can be used to identify point locations anywhere on the earth’s surface. Because of its ability to reference locations, the spherical coordinate system is usually referred to as the Geographic Coordinate System, also known as the Global Reference System. Longitude and latitude are angles measured from the earth’s center to a point on the earth’s surface. Longitude is measured east and west, while latitude is measured north and south. Longitude lines, also called meridians, stretch between the north and south poles. Latitude lines, also called parallels, encircle the globe with parallel rings. Latitude and longitude are traditionally measured in degrees, minutes, and seconds (DMS). Longitude values range from 0° at the Prime Meridian (the meridian that passes through Greenwich, England) to 180° when traveling east and from 0° to –180° when traveling west from the Prime Meridian.
PlanarBecause it is difficult to make measurements in spherical coordinates, geographic data is projected into planar coordinate systems (often called Cartesian coordinates systems). On a flat surface, locations are identified by x,y coordinates on a grid, with the origin at the center of the grid. Each position has two values that reference it to that central location; one specifies its horizontal position and the other its vertical position. These two values are called the x coordinate and the y coordinate.

Introduction to ArcGIS I 8-5Working with georeferenced data
8-5Introduction to ArcGIS ICopyright © 2000–2004 ESRI. All rights reserved.
Datums and datum conversionA frame of reference for measuring locations on the surface of the earth
Measurements are referenced to a geodetic origin and an ellipsoid model
Earth’s surface Earth’s surface
Local datum NAD27Ellipsoid CLARKE 1866 Local datum NAD27
Ellipsoid CLARKE 1866 Earth-centered datum NAD83
Ellipsoid GRS80Earth-centered datum NAD83
Ellipsoid GRS80
Meades Ranch Kansas
Meades Ranch Kansas
Earth’s centerEarth’s center
++
Datums and datum conversionA horizontal datum is a reference frame used to locate features on the earth’s surface. It is defined by an ellipsoid and that ellipsoid’s position relative to the earth. There are two types of datums: earth-centered and local. An earth-centered datum has its origin placed at the earth’s currently known center of mass and is more accurate overall. A local datum is aligned so that it closely corresponds to the earth’s surface for a particular area and can be more accurate for that particular area. Within both of the basic types of datums, you can have several global and local datums. Because datums establish reference points to measure surface locations, they also enable us to calculate planar coordinate values when applying a projection to a particular area.
EllipsoidThe earth is often treated as a sphere to make mathematical calculations easier; however, its shape is actually an ellipsoid. Rotating an ellipse about an axis forms an ellipsoid. An ellipsoid is like a flattened circle with radius lengths along its major and minor axes of length a and b, respectively. The diagram shows that the ellipsoid is symmetric when divided at the equator (i.e., the southern hemisphere and the northern hemisphere are identical in shape). This is not strictly correct, because the earth is slightly pear-shaped; however, the difference in shape between the hemispheres is very slight.

Introduction to ArcGIS I 8-6Working with georeferenced data
8-6Introduction to ArcGIS ICopyright © 2000–2004 ESRI. All rights reserved.
Referencing locationsLocations on the earth are referenced to the datum
Different datums have different coordinate values for the same location
I-10 through Redlands, CA
UTM NAD27UTM NAD27
UTM NAD83UTM NAD83
Referencing locationsTwo maps using the same map projection but different datums can have very different coordinate values for the same location on the earth’s surface. The above graphic shows data for Interstate 10 through Redlands, California, using two different datums. Although both datasets are in UTM projections, the datums used to reference those projections are different. In this case, the difference equals about 175 meters. Checking the datum, as well as the projected coordinate system of a dataset, is vital for matching different data sources in the same coordinate space.

Introduction to ArcGIS I 8-7Working with georeferenced data
8-7Introduction to ArcGIS ICopyright © 2000–2004 ESRI. All rights reserved.
Map projectionsMap projections convert curved surface to flat surface
Cylinder PlaneCone
Map projectionsA map projection is a method for converting the earth’s 3D surface to a map’s two-dimensional surface. A map projection can represent the earth’s entire surface or only a portion of it, depending on your needs. The term map projection was coined by early cartographers, who employed the concept of projecting light from a source through the earth’s surface and onto a two-dimensional surface. Although maps are created using mathematical formulas rather than projected light, the concept is valid, and cartographers use the term projection to describe the mathematical process.Today, all projections use formulas: mathematical expressions that convert data from a geographic location (latitude and longitude) on the earth to a representative location on a flat surface.
Projection surfacesThe selection of a suitable map projection is important if you are going to calculate areas, distances, or directions from coordinates. To help us understand map projections better, you can group them into classifications. One way to group them is by their distortion characteristics such as shape, area, distance, and direction. Another way is to classify them by the developable surface used to make the projection equations. There are three developable surfaces: cylinders, cones, and planes, each giving a distinctive shape to the parallels. With cylinders, parallels are straight; with cones, concentric circles are formed; with planes, eccentric circles are formed. Most common map projections may be conceptually or geometrically projected onto one of these surfaces touching or intersecting the globe. In most cases a projection has already been chosen by others for your area, and no selection is necessary.
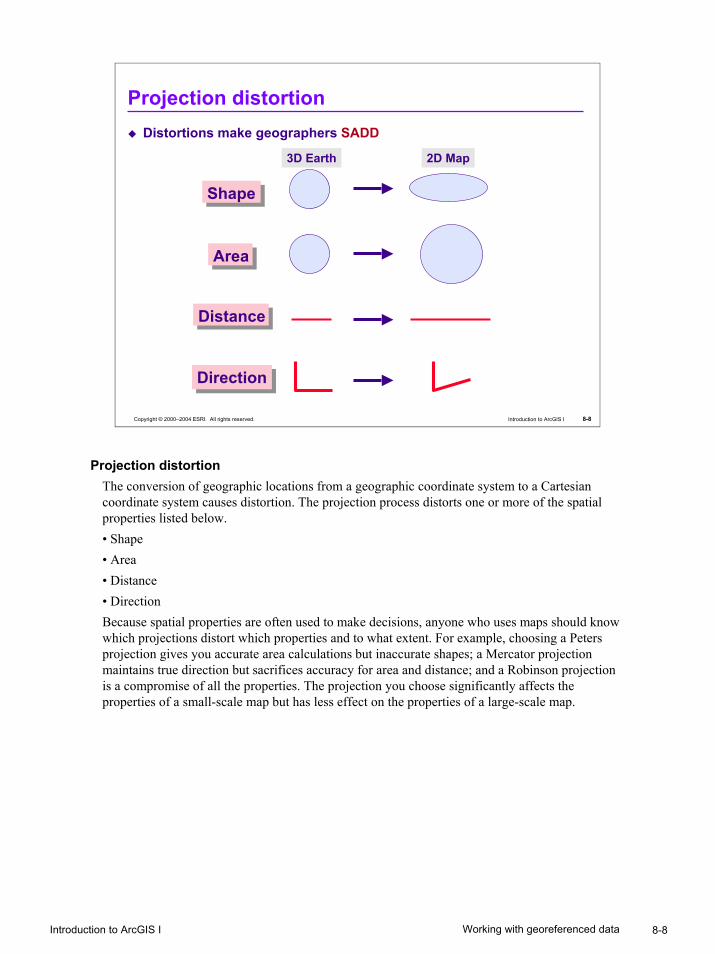
Introduction to ArcGIS I 8-8Working with georeferenced data
8-8Introduction to ArcGIS ICopyright © 2000–2004 ESRI. All rights reserved.
Projection distortionDistortions make geographers SADD
ShapeShape
AreaArea
DistanceDistance
DirectionDirection
3D Earth 2D Map
Projection distortionThe conversion of geographic locations from a geographic coordinate system to a Cartesian coordinate system causes distortion. The projection process distorts one or more of the spatial properties listed below.• Shape• Area• Distance• DirectionBecause spatial properties are often used to make decisions, anyone who uses maps should know which projections distort which properties and to what extent. For example, choosing a Peters projection gives you accurate area calculations but inaccurate shapes; a Mercator projection maintains true direction but sacrifices accuracy for area and distance; and a Robinson projection is a compromise of all the properties. The projection you choose significantly affects the properties of a small-scale map but has less effect on the properties of a large-scale map.
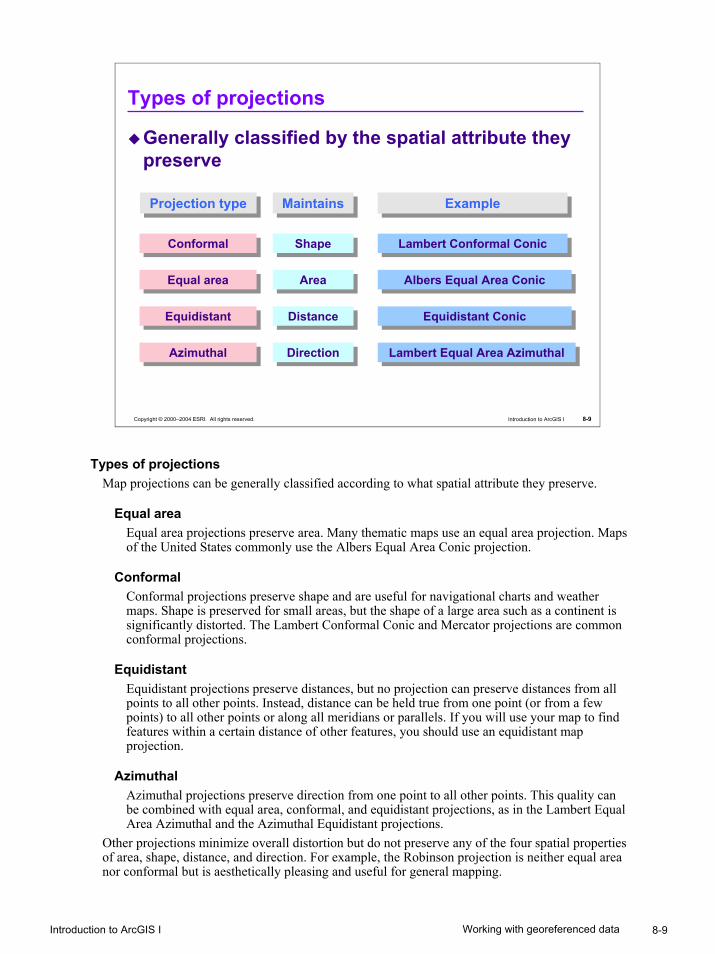
Introduction to ArcGIS I 8-9Working with georeferenced data
8-9Introduction to ArcGIS ICopyright © 2000–2004 ESRI. All rights reserved.
Types of projections
Generally classified by the spatial attribute they preserve
ConformalConformal
Equal areaEqual area
EquidistantEquidistant
AzimuthalAzimuthal
ShapeShape
AreaArea
DistanceDistance
DirectionDirection
Lambert Conformal ConicLambert Conformal Conic
Albers Equal Area ConicAlbers Equal Area Conic
Equidistant ConicEquidistant Conic
Lambert Equal Area AzimuthalLambert Equal Area Azimuthal
Projection typeProjection type MaintainsMaintains ExampleExample
Types of projectionsMap projections can be generally classified according to what spatial attribute they preserve.
Equal areaEqual area projections preserve area. Many thematic maps use an equal area projection. Maps of the United States commonly use the Albers Equal Area Conic projection.
ConformalConformal projections preserve shape and are useful for navigational charts and weather maps. Shape is preserved for small areas, but the shape of a large area such as a continent is significantly distorted. The Lambert Conformal Conic and Mercator projections are common conformal projections.
EquidistantEquidistant projections preserve distances, but no projection can preserve distances from all points to all other points. Instead, distance can be held true from one point (or from a few points) to all other points or along all meridians or parallels. If you will use your map to find features within a certain distance of other features, you should use an equidistant map projection.
AzimuthalAzimuthal projections preserve direction from one point to all other points. This quality can be combined with equal area, conformal, and equidistant projections, as in the Lambert Equal Area Azimuthal and the Azimuthal Equidistant projections.
Other projections minimize overall distortion but do not preserve any of the four spatial properties of area, shape, distance, and direction. For example, the Robinson projection is neither equal area nor conformal but is aesthetically pleasing and useful for general mapping.

Introduction to ArcGIS I 8-10Working with georeferenced data
8-10Introduction to ArcGIS ICopyright © 2000–2004 ESRI. All rights reserved.
Coordinate system components
DatumEllipsoidDatum
Ellipsoid
ProjectedCoordinate System
ProjectedCoordinate System
EquationsParametersEquations
Parameters
GeographicCoordinate System
GeographicCoordinate System
Projected dataProjected data
Coordinate system componentsInformation about the coordinate systems for your data is sometimes referred to as the spatial reference. The spatial reference is composed of all of these components, the geographic coordinate system and the projected coordinate system. The ellipsoid that models the shape of the earth and the datum that references the ellipsoid make up the geographic coordinate system. Spatial data referenced with a geographic coordinate system can be projected into a planar or projected coordinate system so that measurement units are uniform throughout the data. The projected coordinate system is composed of the projection itself plus additional defining parameters. These parameters include the units, (e.g., meters or feet), the central meridian, possibly a zone depending on the projection, and sometimes a false easting or northing. False eastings or northings may be applied to the coordinate values so that spatial data is referenced by positive units.Information on all these components is stored with the projection information for the spatial data.

Introduction to ArcGIS I 8-11Working with georeferenced data
8-11Introduction to ArcGIS ICopyright © 2000–2004 ESRI. All rights reserved.
Storing projection informationMany spatial data formats store the projection details along with the dataProjected Coordinate System: Name: PCS_Transverse_Mercator
Alias: Abbreviation: Remarks:
Projection: Transverse_MercatorParameters:
False_Easting: 500000.000000False_Northing: 0.000000Central_Meridian: -117.000000Scale_Factor: 0.999600Latitude_Of_Origin: 0.000000
Linear Unit: Meter (1.000000)Geographic Coordinate System:
Name: GCS_North_American_1983
Projected Coordinate System: Name: PCS_Transverse_Mercator
Alias: Abbreviation: Remarks:
Projection: Transverse_MercatorParameters:
False_Easting: 500000.000000False_Northing: 0.000000Central_Meridian: -117.000000Scale_Factor: 0.999600Latitude_Of_Origin: 0.000000
Linear Unit: Meter (1.000000)Geographic Coordinate System:
Name: GCS_North_American_1983
PRJ fileShapefiles
Coverages
World file CAD files
Images
RDBMS table Geodatabase
AUX file
Storing projection informationWith many spatial data formats, it is possible to store the details of a dataset’s projection as a part of the dataset. Most data formats accomplish this with a separate text file that is associated with the dataset. In shapefiles and coverages, this is called a projection file (PRJ extension). In CAD datasets, it is called a world file. Images store this information in an auxiliary file (AUX extension).The geodatabase is unique in that it can store the spatial reference information within the database. This alleviates the need for a separate file.Storing the projection and spatial reference information with a particular dataset is helpful because it provides users easy access to this key information and allows ArcMap to instantly recognize the projection of a data source.
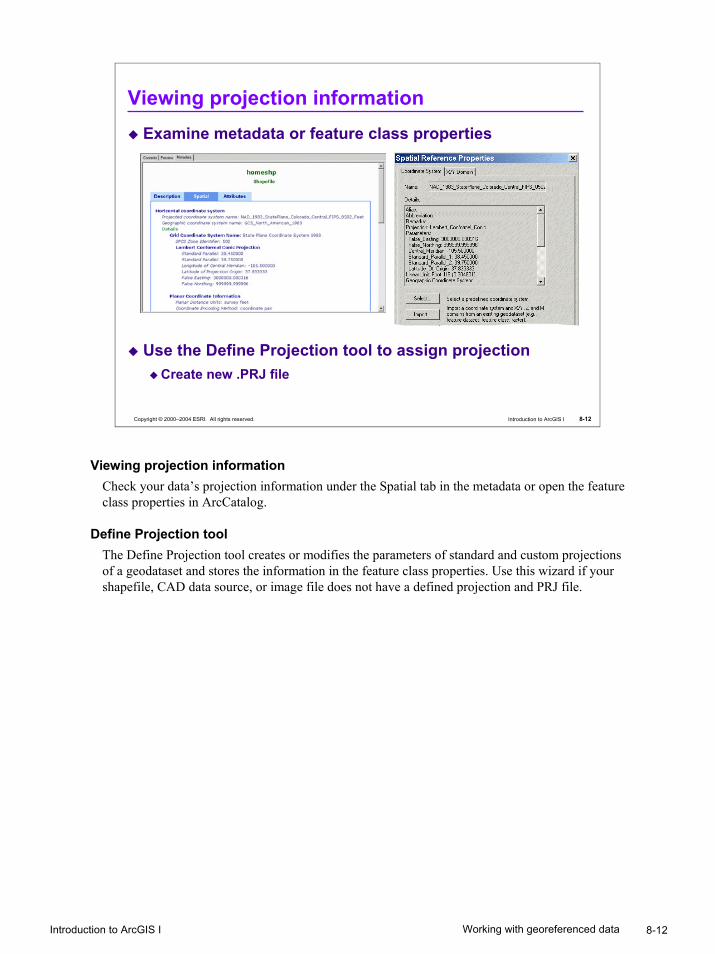
Introduction to ArcGIS I 8-12Working with georeferenced data
8-12Introduction to ArcGIS ICopyright © 2000–2004 ESRI. All rights reserved.
Viewing projection informationExamine metadata or feature class properties
Use the Define Projection tool to assign projectionCreate new .PRJ file
Viewing projection informationCheck your data’s projection information under the Spatial tab in the metadata or open the feature class properties in ArcCatalog.
Define Projection toolThe Define Projection tool creates or modifies the parameters of standard and custom projections of a geodataset and stores the information in the feature class properties. Use this wizard if your shapefile, CAD data source, or image file does not have a defined projection and PRJ file.

Introduction to ArcGIS I 8-13Working with georeferenced data
8-13Introduction to ArcGIS ICopyright © 2000–2004 ESRI. All rights reserved.
MollweideMollweide
ArcMap and projectionsMany supported projections
Predefined projection files
Support on-the-fly projection in ArcMap
North Pole StereographicNorth Pole Stereographic
Fuller (World)Fuller (World)
ArcMap and projectionsArcMap supports many standard projections and has hundreds of projection files predefined for specific zones and regions. A data frame’s projection can either be explicitly set by the user, or ArcMap defaults to the projection of the first layer added. When subsequent layers are added to the map, they are automatically projected into the default map projection.When ArcMap performs an on-the-fly projection on a map layer, it is not changing the original projection of the data source. Therefore, it is usually not necessary to physically change a dataset’s projection in order to perform display, query, or even analysis with datasets of a different projection. However, if a permanent projection change is needed, ArcToolbox contains the tools necessary to perform the operation.

Introduction to ArcGIS I 8-14Working with georeferenced data
8-14Introduction to ArcGIS ICopyright © 2000–2004 ESRI. All rights reserved.
Change the way features (or coordinates) are projected
Use Project tool in ArcToolbox Data Management toolsInput projection must be defined
Select from predefined coordinate systems
Import the coordinate system from an existing dataset
Create your own projection
Changing projections
Changing projectionsHere are a few things to consider when choosing a projection:
• Which spatial properties do you want to preserve?
• Where is the area you are mapping? Is your data in a polar region? An equatorial region?
• What shape is the area you are mapping? Is it square? Is it wider in the east-west direction?
• How big is the area you are mapping? On large-scale maps, such as street maps, distortion may be negligible because your map covers only a small part of the earth’s surface. On small-scale maps, where a small distance on the map represents a considerable distance on the earth, distortion may have a bigger impact, especially if you use your map to compare or measure shape, area, or distance.
Answering these questions determines what map projection and, therefore, what projected coordinate system you will want to use to display your data.

Introduction to ArcGIS I 8-15Working with georeferenced data
8-15Introduction to ArcGIS ICopyright © 2000–2004 ESRI. All rights reserved.
Exercise 8 overviewRecognize and set map scale
Examine how a map’s projection can affect distance
Observe how a map’s projection can affect shape
Examine the Redlands data
Project a shapefile

Introduction to ArcGIS I 8-16Working with georeferenced data
8-16Introduction to ArcGIS ICopyright © 2000–2004 ESRI. All rights reserved.
Lesson 8 reviewThe choice of datum can have a great impact on the coordinate values of the features in a map. (T/F)
Measurements taken using a geographic coordinate system are uniform. (T/F)
Large scales depict small ground areas but show more detail thansmall scales. (T/F)
What is a projection?
Which of the following is not a basic type of map projection?a) cylindricalb) planarc) sphericald) conic
What spatial properties can be distorted by a projection?
����
����
�������������������� ��������������������������������
����������� �
��������������� �� ����������������������� ����������������������������������� ��������������������� ��� !�����"����� ��#$����������������������� ��%��������������&���� ��'(����������������� ���$����"!��������������� ��)*$������������������� ��))&���+�������"������������,������������� ��) &��������������������������� ��)�$�������������"�������!���� ��)�$���������+������"������ ��)�
��!��������� ��)#-����������� ��)%����������������������������� ��)',��������������������� ��)�.+����������� �� *.+������������� �� )������������� ��


Introduction to ArcGIS I 9-1Presenting data
Copyright © 2000–2004 ESRI. All rights reserved. Introduction to ArcGIS I
Presenting data

Introduction to ArcGIS I 9-2Presenting data
9-2Introduction to ArcGIS ICopyright © 2000–2004 ESRI. All rights reserved.
Lesson 9 overviewBasic cartographic concepts
Creating maps in ArcMap
Printing and plotting maps

Introduction to ArcGIS I 9-3Presenting data
9-3Introduction to ArcGIS ICopyright © 2000–2004 ESRI. All rights reserved.
Map and design objectives
Map objectivesShare information
Highlight relationships
Illustrate analysis results
Decision support
Design objectivesManipulate the graphic characteristics
Fulfill the intended purpose
Map and design objectivesA map conveys geographic information, highlights important geographic relationships, and presents analysis results. Because most GIS users have to present their spatial data graphically to a wide variety of readers, they have also become map designers or cartographers.Any GIS analysis ends with some results that need to be communicated. You can help fulfill the purpose of your map by using proper placement of map elements and choosing symbols and cartographic elements that are tailored for the message you want to communicate. How you design a map depends on your particular objective (i.e., why you want to create a map in the first place). One obvious objective for creating a map is to show the results of your analysis. Other map objectives may be to simply share information, guide people, or highlight relationships. Your primary objective is usually not to create a beautiful map but to create a product that communicates effectively, efficiently, and clearly.

Introduction to ArcGIS I 9-4Presenting data
9-4Introduction to ArcGIS ICopyright © 2000–2004 ESRI. All rights reserved.
Factors controlling cartographic design
FinaldesignFinal design
Mode of use?Mode
of use?
Technical limits?
Technical limits?
Objective?Objective?
Audience?Audience?
Need togeneralize?
Need togeneralize?
Scale?Scale?
Reality?Reality?
Several factors control your map design and can limit your creativity and flexibility.Map objective
You may be asked to design a map for a book or for a wall, folded or flat, black and white or colored, square or rectangular, and so on. Each of these would control how you design the map.
AudienceIs your map for a highly technical committee or the general public? Your design must match the level of your audience. This controls the complexity of your map design.
Reality and the need to generalizeA detailed coastline is important for ecological studies. Your map must be detailed if you are addressing ecologists because they make deductions based on the way the coastline is shaped. A meandering river is important for city planners. You cannot generalize these complex shaped lines extensively (e.g., into a straight or large curved line) when going into a smaller-scale map.
Scale and technical limitsScale dictates how much detail you are able to place on a limited piece of paper. At a scale of 1:1,000,000, a 10-meter road should appear on the map using a line width of 0.01 mm. The smallest practical drafting pen is 0.1 mm (similarly a typical inkjet technology output device can render a line as thin as 0.1 mm). If you used the 0.1 mm pen, which is inevitable, you have just exaggerated the road width by ten times. Another example of a technical limitation is that your monitor may have a color palette of 256 colors (i.e., addressed by 8-bit pixel values), where each color can be chosen from a total of 16.7 million colors (i.e., eight bits output for each of red, green, and blue); however, you may have a very limited, low-end color plotter or printer. So, regardless of how sophisticated your design on the screen may be, you are limited by the quality of your printing and plotting hardware.
Mode of useDifferent map design treatment should be considered when you design a map to be used in a well-lit place or static location compared to one that is designed for use while driving or at low-light conditions.

Introduction to ArcGIS I 9-5Presenting data
9-5Introduction to ArcGIS ICopyright © 2000–2004 ESRI. All rights reserved.
Communication in maps
Map
Map
Mental image of reality
Mental image of reality
RealityReality
Map userMap user
Cartographer / GIS specialist
Cartographer / GIS specialist
Compile
Imagine
RecognizeSelect
ClassifySimplify
Symbolize
ReadAnalyze
Interpret
MapMap
The cartographer or GIS or CAD specialistThis person compiles the data from several sources. Perhaps they have visited the place they are about to map. After recognizing what data is necessary for the map, they select only the data necessary to fulfill the map objective. The cartographer or GIS or CAD specialist takes what is selected, classifies the data into fewer categories, simplifies it, and finally selects the proper symbology for displaying the information on the map.
The map userThis person takes the map, reads the symbology, analyzes the relationships, and interprets the information depicted, whether through conclusion or inference. They acquire a mental image of the area that they may not have seen before. Their conclusions or inferences are based solely on the symbology presented in the map. As a cartographer or GIS or CAD specialist, this makes your symbology selection and map design critical issues in the communication process between you and the map user.
The communication channelImagine giving directions on the phone for someone who has never been to your area. You tell that person to go on this highway and use that exit, then turn left on such a street, and finally the house is the fifth one on the left. You have selected only what you consider important in giving directions. You have excluded all other details or landmarks. While listening to you, and perhaps taking notes, the other person on the phone is building a mental image of your description. That person will never re-create the same exact mental image as yours.

Introduction to ArcGIS I 9-6Presenting data
9-6Introduction to ArcGIS ICopyright © 2000–2004 ESRI. All rights reserved.
General mapsLocational/positional
Variety of features and uses
Thematic mapsDistribution of an attribute
Single attribute or relationship
Different objectives, different cartographic designsQualitative
Soils
Quantitative
Population
Types of maps
Classifying mapsClassifying maps is a difficult task, but you can generally divide maps into two categories: general and thematic.
General mapsGeneral maps show locational or positional types of data. They depict a variety of features and are used by many disciplines. This is why they are considered ‘general’. Examples of such maps include atlas maps or topographic maps produced by the United States Geological Survey.
Thematic mapsThere are two types of thematic maps: qualitative and quantitative. Both show the distribution of an attribute, and both generally depict a single attribute or relationship. It is not unusual, however, for more complicated thematic maps to have several attributes or relationships.
Qualitative thematic mapsThese maps depict data such as different soil types and different types of features with equal importance at a nominal scale. Some qualitative maps change to a quantitative classification if you change the scale from nominal to ordinal (e.g., showing a relative fertility index or a water retention index for different soil types).
Quantitative thematic mapsHere you are deliberately showing differences in quantitative characteristics. You are using an interval or ratio scale to show such things as population density per square kilometers or variation in temperature or humidity.

Introduction to ArcGIS I 9-7Presenting data
9-7Introduction to ArcGIS ICopyright © 2000–2004 ESRI. All rights reserved.
Issues in cartographic design
Colors, shade patterns, and textPerception of colors and symbols
Legibility of features and text
Visual contrast and hierarchy
Visual balance
Size Value
Eyes have limitationsNumber of colors and shades: Research has shown that the human eye is limited in its ability to decipher differences between colors if more than twelve colors appear together. Additionally, if you decide to use different shades of the same color, you need to realize that the human eye can decipher no more than seven or eight distinct shades.
LegibilityLegibility is defined as the smallest symbol that can be easily read at a certain distance. Many maps fail to relay useful information because the text, point, or line symbols are too small.
Visual contrast and hierarchyMap reading can be enhanced by increasing the visual contrast among symbols or between the symbol and its background. Variations in size or graytone value can also create a quantitative visual hierarchy. Visual contrast and hierarchy can be used in map design to lead the map reader to focus on the most important areas first and proceed next to the less important areas.
Visual balanceAs you start displaying symbology on your map, the different treatment of graphic characteristics may result in symbols that vary in their visual weight. Strive to achieve a visual balance that enhances the purpose of the map.
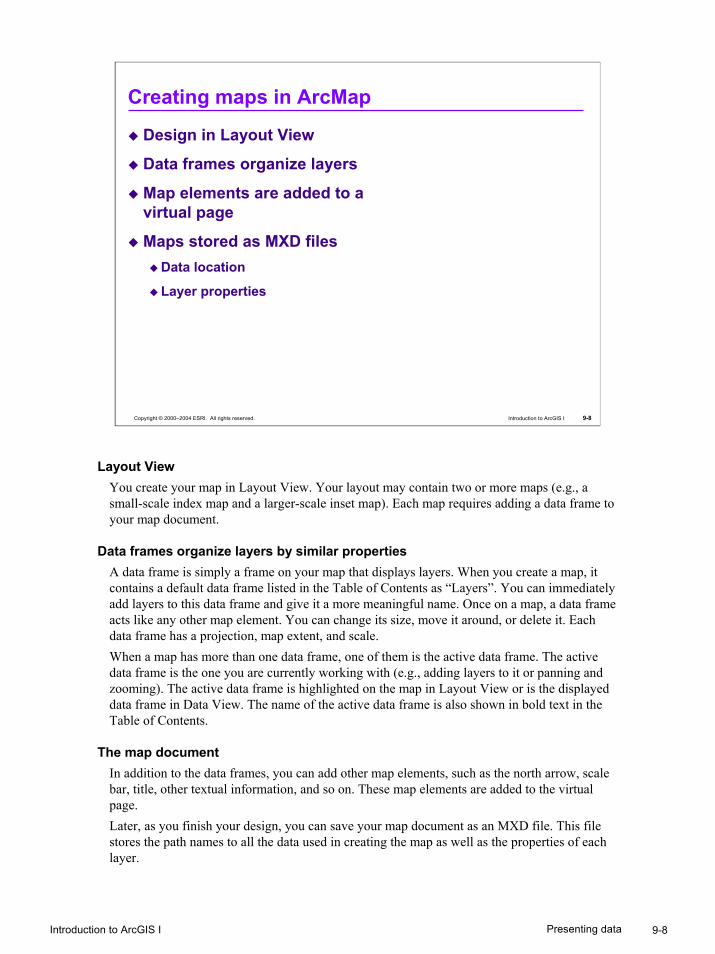
Introduction to ArcGIS I 9-8Presenting data
9-8Introduction to ArcGIS ICopyright © 2000–2004 ESRI. All rights reserved.
Creating maps in ArcMap
Design in Layout View
Data frames organize layers
Map elements are added to a virtual page
Maps stored as MXD filesData location
Layer properties
Layout ViewYou create your map in Layout View. Your layout may contain two or more maps (e.g., a small-scale index map and a larger-scale inset map). Each map requires adding a data frame to your map document.
Data frames organize layers by similar propertiesA data frame is simply a frame on your map that displays layers. When you create a map, it contains a default data frame listed in the Table of Contents as “Layers”. You can immediately add layers to this data frame and give it a more meaningful name. Once on a map, a data frame acts like any other map element. You can change its size, move it around, or delete it. Each data frame has a projection, map extent, and scale. When a map has more than one data frame, one of them is the active data frame. The active data frame is the one you are currently working with (e.g., adding layers to it or panning and zooming). The active data frame is highlighted on the map in Layout View or is the displayed data frame in Data View. The name of the active data frame is also shown in bold text in the Table of Contents.
The map documentIn addition to the data frames, you can add other map elements, such as the north arrow, scale bar, title, other textual information, and so on. These map elements are added to the virtual page.Later, as you finish your design, you can save your map document as an MXD file. This file stores the path names to all the data used in creating the map as well as the properties of each layer.

Introduction to ArcGIS I 9-9Presenting data
9-9Introduction to ArcGIS ICopyright © 2000–2004 ESRI. All rights reserved.
Setting up the page
Remember the purposeWill the map be viewed up close or at a distance?
What is the best page size?
Landscape or portrait?
What printer will I be using, and what are my printer size limitations?
Setting up the pagePage setup is an important consideration when designing maps because you are creating the canvas on which you arrange all of the map elements in your design. The page is your compositional space, and it affects most of your design decisions. Will the map be viewed up close or at a distance?The answers to the questions on the slide help you determine the size of features, symbols, labels, and other text, as well as all the other map elements that will be included in your composition.The size of your map is tied directly to its purpose. It is best to set up the page size before you begin creating the map. Keep in mind that you are working on a virtual page in Layout View. The virtual page represents the dimensions and orientation of your workspace, and eventually, your final product. By defining the size of the page first, you can visualize the composition as a whole. ArcMap lets you resize the page and, if you choose, rescale the map elements accordingly. When you right-click on the virtual page and click Page Setup, the Page Setup dialog appears. In the Page Setup dialog, you specify the dimensions and orientation of the map page, as well as printer information.

Introduction to ArcGIS I 9-10Presenting data
9-10Introduction to ArcGIS ICopyright © 2000–2004 ESRI. All rights reserved.
Identifying map elements
Title
Map body
North arrowLegend
Scale bar Designed by Committee 2004
Other textWhat is missing?
What other map elements are missing?
• Scale text (1:100,000)
• Other text (author name, disclaimers, projection information, date of data, date of map, and so on)
• Logos
Are all these map elements really necessary?Some map elements can be ignored if other map elements or features can substitute for it. For example, a north arrow is redundant if you have neatlines shown with coordinate labels such as latitude and longitude; a north arrow and a scale bar are both redundant if you are depicting the population of the United States in a book on United States demographic statistics; a scale bar can be redundant if neatlines are shown with the proper coordinate system and units.Avoid placing any information that does not comply with the map’s objectives. These are considered ‘visual noise’ and distract from effective map communication.

Introduction to ArcGIS I 9-11Presenting data
9-11Introduction to ArcGIS ICopyright © 2000–2004 ESRI. All rights reserved.
Inserting map elements
Choose typeChoose type
4
(map)
Drag
Legend appears
ModifyModify
From the Insert menu, click the element you want to add. Depending on which element you select, a dialog may appear, and you can choose the element’s style, color, font, and so on. Once you have made a selection, the map element is dropped, by default, in the center of the layout page. You can then use your mouse to drag and drop it to a new position on the page and resize it, if necessary. Double-clicking on an element accesses its properties and allows you tomake modifications.

Introduction to ArcGIS I 9-12Presenting data
9-12Introduction to ArcGIS ICopyright © 2000–2004 ESRI. All rights reserved.
An example of the Legend Properties dialog
ModifyModify
Double-click Double-click
Legend tabIn the Legend tab, you can change the legend title to something more meaningful or explicit (e.g., “Density per square kilometer” instead of the redundant “Legend”). The Show check box controls whether or not a legend title appears. The title can be placed above or below the legend or to its right or left. The title properties (e.g., color, font, size) can be changed using the Symbol button. The legend symbols can be displayed using your choice of a symbol type and outline. You may choose from some predefined symbols like rectangular, elliptical, or diamond shapes, or you may create your own custom symbol. The default spacings between the individual components of the legend are set as optimum; however, you can manipulate these spacings to suit your preference.
Items tabUse the Items tab to specify which legend items you want to have appear. By default, items from all map layers appear.You can also specify how you want the legend to be connected to the map: only display the legend items that have data visible on the map, add a new item to the legend when a new layer is added to the map, or reorder the legend items when the map layers are reordered. These are all set by default, but you can switch them off.
Frame tabUse the Frame tab if you want to add a background shade behind the legend.
Size and Position tabUse the Size and Position tab to adjust the size and location of the legend.
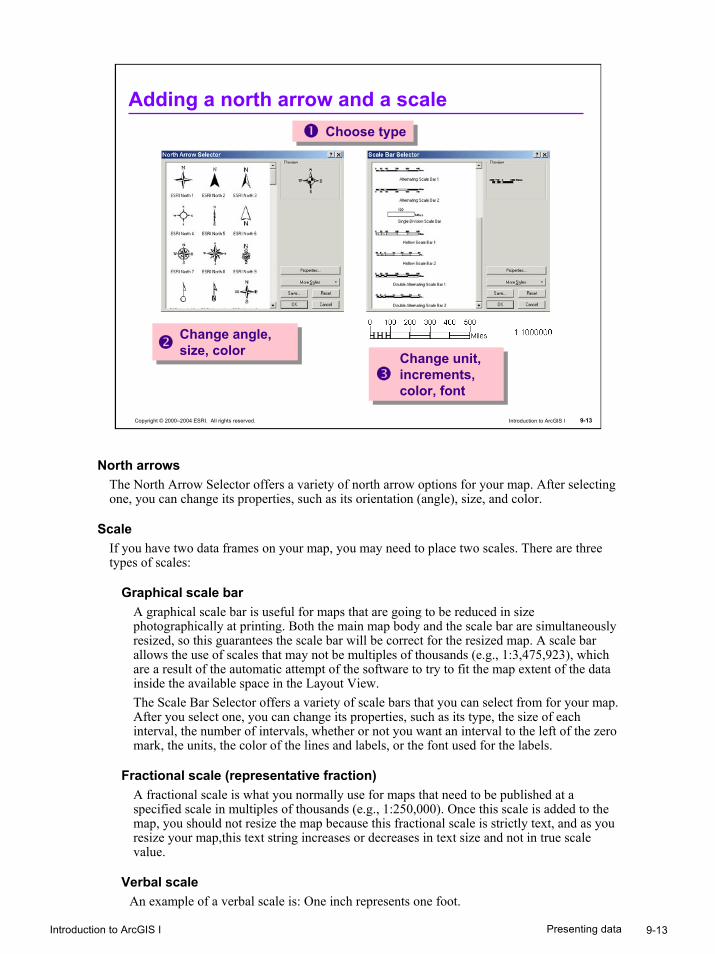
Introduction to ArcGIS I 9-13Presenting data
9-13Introduction to ArcGIS ICopyright © 2000–2004 ESRI. All rights reserved.
Adding a north arrow and a scale
Change angle, size, color
Change angle, size, color
Change unit, increments, color, font
Change unit, increments, color, font
Choose typeChoose type
North arrowsThe North Arrow Selector offers a variety of north arrow options for your map. After selecting one, you can change its properties, such as its orientation (angle), size, and color.
ScaleIf you have two data frames on your map, you may need to place two scales. There are three types of scales:
Graphical scale barA graphical scale bar is useful for maps that are going to be reduced in size photographically at printing. Both the main map body and the scale bar are simultaneously resized, so this guarantees the scale bar will be correct for the resized map. A scale bar allows the use of scales that may not be multiples of thousands (e.g., 1:3,475,923), which are a result of the automatic attempt of the software to try to fit the map extent of the data inside the available space in the Layout View. The Scale Bar Selector offers a variety of scale bars that you can select from for your map. After you select one, you can change its properties, such as its type, the size of each interval, the number of intervals, whether or not you want an interval to the left of the zero mark, the units, the color of the lines and labels, or the font used for the labels.
Fractional scale (representative fraction)A fractional scale is what you normally use for maps that need to be published at a specified scale in multiples of thousands (e.g., 1:250,000). Once this scale is added to the map, you should not resize the map because this fractional scale is strictly text, and as you resize your map,this text string increases or decreases in text size and not in true scale value.
Verbal scaleAn example of a verbal scale is: One inch represents one foot.

Introduction to ArcGIS I 9-14Presenting data
9-14Introduction to ArcGIS ICopyright © 2000–2004 ESRI. All rights reserved.
Incorporating a reference system
Display reference positions on maps
Available reference systems:
Different graticule or grid types on the same mapLatitude/LongitudeLatitude/Longitude ABC/123ABC/123
GraticuleGraticule Reference GridReference Grid
Map UnitsMap Units
Measured GridMeasured Grid
Incorporating a reference systemGraticules and grids are useful for locating features or places on a map, as both offer a reference structure. Graticules and grids are properties of the entire data frame. You can add a graticule or a grid by right-clicking on the data frame and clicking Properties. On the Data Frame Properties dialog, click the Grids tab. Then click the New Grid button, which displays the Grids and Graticules wizard.Several reference systems can be selected from the wizard. Once a reference system is selected, its properties can be changed, including changing the color of the lines and labels and the label font and orientation.You can place several different reference systems on the same map. Simply click the New Grid button, and select the reference system and its properties. This way your map can be used by many different disciplines, each using its preferred type of reference system.

Introduction to ArcGIS I 9-15Presenting data
9-15Introduction to ArcGIS ICopyright © 2000–2004 ESRI. All rights reserved.
same
Inserting textual informationTitle and author
Data source, date, projection
Date of map and of data
Disclosures and acknowledgements
What textual information should a map have?A map may be incomplete without the following information:
1. A map title
2. The name of the author or authors
3. Projection information
4. Date of the map and date of the data
5. Sources of the data used and method of collection
6. Disclosures on whether or not you have displaced some of the spatial features for the sake of clarity
7. Acknowledgement statement, if necessaryThe above textual information should not necessarily appear in the same level of importance (e.g., the map title text should be larger than the projection information).
Available toolsIn the ArcMap application, you can add text from the Drawing toolbar or from the Insert dropdown list.

Introduction to ArcGIS I 9-16Presenting data
9-16Introduction to ArcGIS ICopyright © 2000–2004 ESRI. All rights reserved.
Layout tools
Zoom and pan the layout page
Additional layout settings from Tools > Options
27% 100%50%Scale remains
the sameScale remains
the same
Layout View toolsWhen you move from Data View to Layout View, another toolbar named “Layout” appears. The Layout toolbar has its own Zoom In and Zoom Out buttons, as well as a display of percent reduction or enlargement window (shown above in the Layout toolbar).Do not confuse the Layout toolbar’s Zoom In and Zoom Out buttons with the ones on the Tools toolbar. The buttons on the Layout toolbar enable zooming in and out in order to view how the map elements look at different percent reductions and enlargements. As the monitor screen cannot show the full size of the map (e.g., a 36-inch x 24-inch map size), these buttons allow you to look at a 100-percent map enlargement. This way you have more control over your map design because you know exactly how your symbology and other elements look at actual size.Notice that as you zoom in or zoom out at different percentages using the Layout toolbar, the actual scale of the view (as inherited from Data View or as set earlier in Layout View) remains the same (shown above with 1:10,000).

Introduction to ArcGIS I 9-17Presenting data
9-17Introduction to ArcGIS ICopyright © 2000–2004 ESRI. All rights reserved.
Grids and rulers
Determine the size of map elements
Use guides to arrange elements
Use grids to position elements at specific points
Use snapping for precision and efficiency
Grids and rulersHow large are your map elements relative to the page size of the map? As you compose your map, you can zoom in and out to view various elements, but this capability can prove deceptive, especially when translated to printed material. It is important to keep in mind that text and other elements like north arrows and scale bars may appear legible on a large-format virtual page, but when printed, it will be oversized. The opposite is true for smaller-format maps; elements become illegible once the map is printed. Use the rulers as a reality check.Manually positioning map elements on the virtual page can be an inexact and tedious process. Snapping map elements to a ruler, guide, or grid reference point can ensure precise positioning and improve your productivity. In ArcMap, you can choose which of these visual indicators elements snap to, and you can set the snapping tolerance. You can even choose the order in which map elements snap to rulers, guides, and grids. When snapping options are defined and engaged, map elements automatically move to the nearest guide or grid point.There may be times when you want a certain map element (e.g., a data frame) to be positioned at a specific point on the map page. A grid is a series of reference points in the layout that you can use to position map elements. You can control the spacing of the grid reference points, and you can turn the grid on or off.

Introduction to ArcGIS I 9-18Presenting data
9-18Introduction to ArcGIS ICopyright © 2000–2004 ESRI. All rights reserved.
Gives all maps in a series the same look
ArcMap templatesCreate your own
Creating and using map templates
Choose a standard template
Choose a standard template
Creating and using map templatesWhen you create a map series, all the maps in the series should have the same look and feel. One way to achieve this is to create a template to ensure that all the common elements in the map series (e.g., the font, background color, north arrow, legend, acknowledgements, and disclaimers) are consistent throughout each map in the series. Using a template can make you more productive and can help standardize the maps produced by your organization. Templates help maintain consistency throughout a map series.Map templates are ArcMap documents (with an MXT extension). You choose a template when you open a new map and add layers to it. ArcMap comes with a standard set of templates that you can use right away to create attractive, professional maps. You can modify the maps and the templates to suit your needs, or you can create your own templates. Like layer files, you can also share templates within your organization so that the layout of the map, the data sources, and even customization of the ArcMap interface are preserved. A standard set of templates is included with ArcGIS software.You can save a map template anywhere on your network. If you save the template in the ArcMap Templates folder, it appears in the list of templates displayed when you create a new map document. If you use a variety of templates in your organization, you can create subfolders in the ArcMap Templates folder and organize your templates accordingly. Your subfolders appear as tabs in the Select Template dialog. Creating folders in the ArcMap Templates folder automatically creates tabs on the Select Template dialog.

Introduction to ArcGIS I 9-19Presenting data
9-19Introduction to ArcGIS ICopyright © 2000–2004 ESRI. All rights reserved.
Printing and plotting maps
Choose a Printer EngineArcPressPostScriptWindows
ArcPress Printer Engine
ArcPress Printer Engine
Printing procedureFollow the steps below to print your map.1. From the File dropdown list, click Print.2. In the Print dialog, point to the available printer and select the Printer Engine by clicking the
Setup button. The PostScript and Windows Printer Engine drivers are available with your Windows operating system. The ArcPress Printer is a separate ESRI extension product specifically designed to facilitate high-quality map production. You choose between printer drivers in the Page Setup window.
3. On the Document Properties dialog of your printer or plotter, select the paper size and source, the number of copies, the orientation, and the color appearance. Depending on which printer engine was selected, the Document Properties dialog may be different from the graphic shown in the slide.
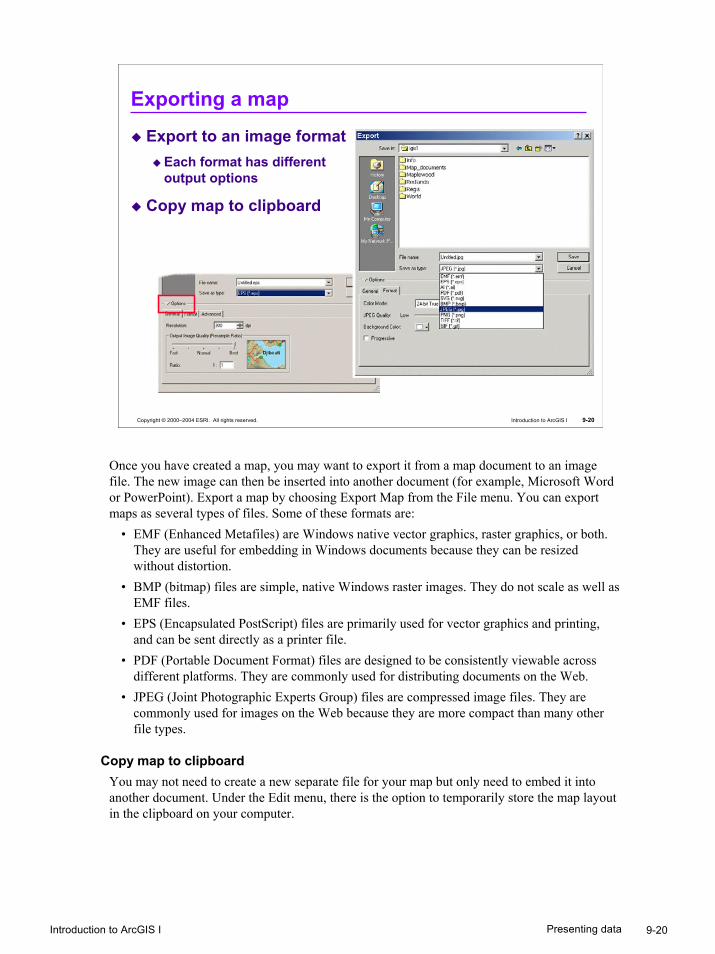
Introduction to ArcGIS I 9-20Presenting data
9-20Introduction to ArcGIS ICopyright © 2000–2004 ESRI. All rights reserved.
Export to an image formatEach format has different output options
Copy map to clipboard
Exporting a map
Once you have created a map, you may want to export it from a map document to an image file. The new image can then be inserted into another document (for example, Microsoft Word or PowerPoint). Export a map by choosing Export Map from the File menu. You can export maps as several types of files. Some of these formats are:
• EMF (Enhanced Metafiles) are Windows native vector graphics, raster graphics, or both. They are useful for embedding in Windows documents because they can be resized without distortion.
• BMP (bitmap) files are simple, native Windows raster images. They do not scale as well as EMF files.
• EPS (Encapsulated PostScript) files are primarily used for vector graphics and printing, and can be sent directly as a printer file.
• PDF (Portable Document Format) files are designed to be consistently viewable across different platforms. They are commonly used for distributing documents on the Web.
• JPEG (Joint Photographic Experts Group) files are compressed image files. They are commonly used for images on the Web because they are more compact than many other file types.
Copy map to clipboardYou may not need to create a new separate file for your map but only need to embed it into another document. Under the Edit menu, there is the option to temporarily store the map layout in the clipboard on your computer.

Introduction to ArcGIS I 9-21Presenting data
9-21Introduction to ArcGIS ICopyright © 2000–2004 ESRI. All rights reserved.
Exercise 9 overviewCreate a layout in ArcMapAdd a legend, scale bar, north arrowAdd a title and other textual informationAdd a border and a background shade to your mapMaintain visual balanceExport your map to an image formatChallenge: Add a reference grid to your map

Introduction to ArcGIS I 9-22Presenting data
9-22Introduction to ArcGIS ICopyright © 2000–2004 ESRI. All rights reserved.
Lesson 9 reviewName five factors that may control your cartographic design.
Maps are designed in the _____________________ view.
How do the zoom tools on the Layout toolbar differ from those on the Tools toolbar?
You cannot place more than one grid/graticule on a map. (T/F)
Why would you create or use a map template?
What map elements can be added to a map layout?