Embed Size (px)
Citation preview

AWS Educate:Graduating Students Ready for Cloud-Enabled Workforce
Ken Eisner – Global Lead, AWS Educate

Rapidly growing demand for cloud jobs

Investing in cloud evangelists speeds IT innovation
Startups
CorporationsResearch orgs
Nonprofits
Government


AWS Educate value proposition and goals
Labs and training on cloud topics and AWS
products
Open course content by leading
professors and AWS
Grants for free usage of AWS
services
Communities that share best practices
virtually and in person
• Positively impact many thousands of students
• Curriculum change
• Student app development and entrepreneurship
• Growth in AWS Certifications / Badges
• Accelerate hiring pipeline

Register at awseducate.com:Institutions, Educators, and Students

USGIF 2015 GEOINT HACKATHON
Dan Simon
Paul WarrenBriana Neuberger
Blair Mason

Hackathon
The goal was to bring together and introduce both non-GEOINT and GEOINT-savvy coders and data scientists to interesting problems requiring inventive coding solutions.

Data Sets
• Population Density Data
• Hospital Locations
• Streets and Railways
• Access to Water
• Poverty Level
• Humanitarian Aid Areas**All data is preferable on a 1km x 1km scale to maintain accuracy.

Required Sources
Country Outlines/Polygon Shapefiles - http://www.mapmakerdata.co.uk.s3-website-eu-west-1.amazonaws.com/library/stacks/Africa/index.htm
API Data Source (ESRI, DigitalGlobe, NGA)
Other Related Data
Vector
Raster
Database/ Dataset
Social Media
Poverty Data Analysis - http://povertydata.worldbank.org/poverty/region/SSA
Roads & Railways - http://opendata.arcgis.com/
Timeline of Ebola Spread - http://www.healthmap.org/ebola/#
Population Density - http://www.worldpop.org.uk/
Locations of Hospitals- http://nga.maps.arcgis.com/apps/PublicGallery/

Predictive Analysis of Ebola

Predict spread of Ebola in West Africa
Goal

12
3
Planning Phase
What’s been done?
What data is available?
What can we do?

Network Theory
Susceptible
Infected
Recovered

Create a Network Model
Develop a model that predicts where ebola will spread and how many people it will affect based on how contagious people travel.
Inputs Outputs End Product
Take in data regarding fatality rate, immunity rate, average travel distance, transmission rate, as well as geo-referenced statistics to determine virus movement.
Rasterize Data into 1km x 1km
Connect to Neighbors in
Cardinal Direction
Designate each Pixel as
a Node
Develop Data-driven Model of Infected Indv.
Model Travel, Infection Rate,
& Disease Progression
Output GeoTIFFs of
Infected Areas & Deceased
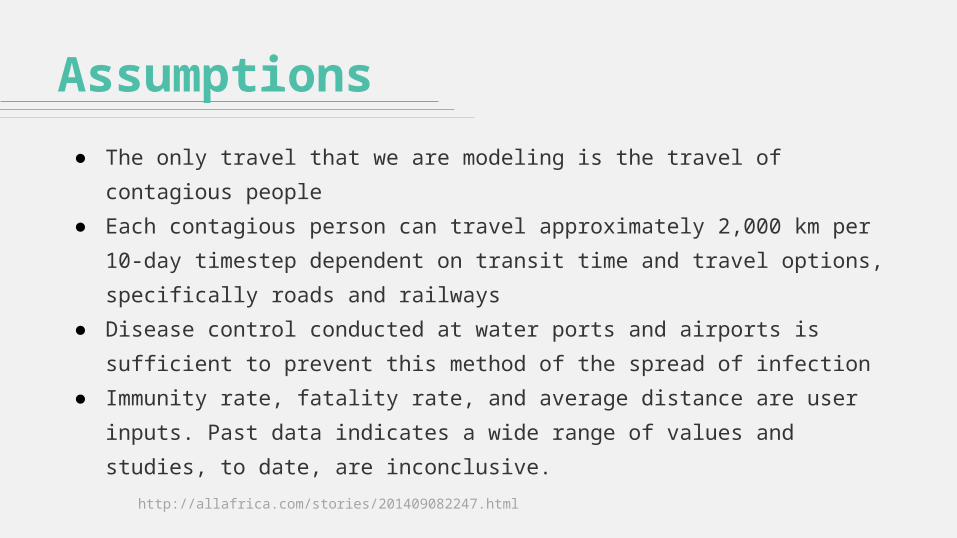
Assumptions● The only travel that we are modeling is the travel of contagious people● Each contagious person can travel approximately 2,000 km per 10-day timestep
dependent on transit time and travel options, specifically roads and railways● Disease control conducted at water ports and airports is sufficient to prevent this
method of the spread of infection● Immunity rate, fatality rate, and average distance are user inputs. Past data
indicates a wide range of values and studies, to date, are inconclusive.
http://allafrica.com/stories/201409082247.html

Population Density of Continental Africa
Highlight the area of interestClip to West Africa to reduce data quantity
Population Density of West Africa
Convert Raster to a 1km x 1km grid to represent each pixelEach pixel represents a node in a node & edge system
N
E
S
W
Travel paths are limited to the Von Neumann neighborhood
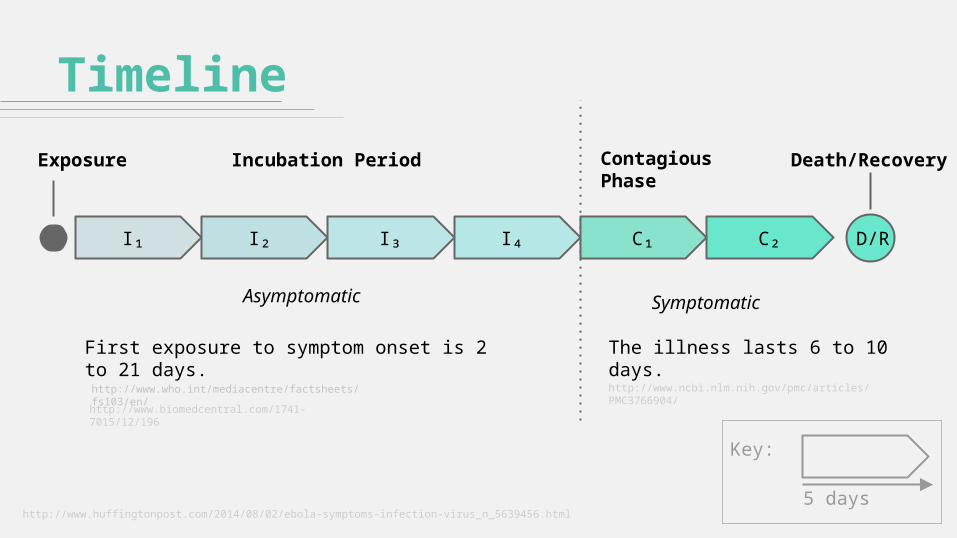
D/R
Exposure Incubation Period Death/Recovery
Asymptomatic Symptomatic
Contagious Phase
First exposure to symptom onset is 2 to 21 days.
http://www.biomedcentral.com/1741-7015/12/196
http://www.who.int/mediacentre/factsheets/fs103/en/
The illness lasts 6 to 10 days.
http://www.ncbi.nlm.nih.gov/pmc/articles/PMC3766904/
http://www.huffingtonpost.com/2014/08/02/ebola-symptoms-infection-virus_n_5639456.html
I₁ I₂ I₃ I₄ C₁ C₂
5 days
Key:
Timeline

Contagious
Leave Stay
Max travel is 2,050 km/10 days. Assume 34 km/hr (55miles/hr) traveling 6 hrs/day.
Psuedo-Random WalkDuring each 10-day timestep, members of the contagious population have the option of traveling up to 2,000km or staying in their current location.
Contagious travelers are more likely to go to areas with roads, higher population densities, closer proximities to hospitals, and closer proximities to cities.
North East South West

Weighting Algorithm𝑃𝑠𝑡𝑎𝑦=𝑝𝑟𝑜𝑏𝑎𝑏𝑖𝑙𝑖𝑡𝑦𝑚𝑒𝑚𝑏𝑒𝑟𝑠𝑜𝑓 𝑐𝑜𝑛𝑡𝑎𝑔𝑖𝑜𝑢𝑠𝑝𝑜𝑝𝑢𝑙𝑎𝑡𝑖𝑜𝑛 𝑠𝑡𝑎𝑦𝑃𝑔𝑜=𝑝𝑟𝑜𝑏𝑎𝑏𝑖𝑙𝑖𝑡𝑦𝑚𝑒𝑚𝑏𝑒𝑟𝑠𝑜𝑓 𝑐𝑜𝑛𝑡𝑎𝑔𝑖𝑜𝑢𝑠𝑝𝑜𝑝𝑢𝑙𝑎𝑡𝑖𝑜𝑛𝑙𝑒𝑎𝑣𝑒
𝐹𝑖𝑡𝑛𝑒𝑠𝑠 𝑓 𝑥=𝑄𝑢𝑎𝑛𝑡𝑖𝑡𝑎𝑡𝑖𝑣𝑒𝑎𝑡𝑡𝑟𝑎𝑐𝑡𝑖𝑣𝑒𝑛𝑒𝑠𝑠𝑜𝑓 𝑛𝑜𝑑𝑒𝑥
𝑃𝐷𝑐𝑢𝑟=𝑝𝑜𝑝𝑢𝑙𝑎𝑡𝑖𝑜𝑛𝑑𝑒𝑛𝑠𝑖𝑡𝑦𝑜𝑓 𝑐𝑢𝑟𝑟𝑒𝑛𝑡𝑛𝑜𝑑𝑒𝑃𝐷𝑚𝑎𝑥=𝑙𝑎𝑟𝑔𝑒𝑠𝑡 𝑝𝑜𝑝𝑢𝑙𝑎𝑡𝑖𝑜𝑛𝑑𝑒𝑛𝑠𝑖𝑡𝑦 𝑖𝑛𝑅𝑂𝐼𝑑𝑐𝑖𝑡𝑦= h𝑚𝑎𝑛 𝑎𝑡𝑡𝑎𝑛𝑑𝑖𝑠𝑡𝑎𝑛𝑐𝑒𝑡𝑜𝑐𝑙𝑜𝑠𝑒𝑠𝑡𝑐𝑖𝑡𝑦𝑑h𝑜𝑠𝑝= h𝑚𝑎𝑛 𝑎𝑡𝑡𝑎𝑛𝑑𝑖𝑠𝑡𝑎𝑛𝑐𝑒𝑡𝑜𝑐𝑙𝑜𝑠𝑒𝑠𝑡 h𝑜𝑠𝑝𝑖𝑡𝑎𝑙
𝑟=𝑟𝑜𝑎𝑑 𝑠𝑐𝑎𝑙𝑖𝑛𝑔 𝑓𝑎𝑐𝑡𝑜𝑟
𝑃𝑔𝑜=1− 𝑃𝑠𝑡𝑎𝑦
,
𝑃𝑥=𝑓 𝑥
∑ 𝑓∙𝑃𝑔𝑜
𝑃𝑠𝑡𝑎𝑦={0 .001
( 𝑝𝑑𝑐𝑢𝑟
𝑝𝑑𝑚𝑎𝑥 )2
12𝑑𝑐𝑖𝑡𝑦+1
12𝑝h𝑜𝑠𝑝+1
}Baseline
Global density ratio
City proximity
Hospital proximity
where r = 5 for tiles with roads r = 1 otherwise

6 Month Ebola Simulation
Dead: 0

Dead: 6

Dead: 14

Dead: 5,106

Dead: 13,995

Dead: 85,095

Dead: 165,069

Dead: 267,806

Dead: 379,311

Dead: 503,998

Dead: 637,248

Dead: 779,439

Dead: 936,422

Dead: 1,117,423

Dead: 1,365,257

Dead: 1,837,386

Dead: 2,387,654

Dead: 3,120,727

Dead: 4,059,713


Improvements● Threading input data processing, contagious travel, and output
visualization● Using HDF5 for data storage● Vectorizing code with Numpy to improve speed● Generalizing model for use with other data sources● Open source our modeling software:
https://github.com/pawarren/PyDemic

AcknowledgementsThank you to all of the judges for being here today as well as Hackathon sponsors and
data providers.

The Future