Embed Size (px)
Citation preview
Benchmarking
Hadoop & Big Data benchmarking
Dr. ir. ing. Bart Vandewoestyne
Sizing Servers Lab, Howest, Kortrijk
IWT TETRA User Group Meeting - November 28, 2014
1 / 62
Benchmarking
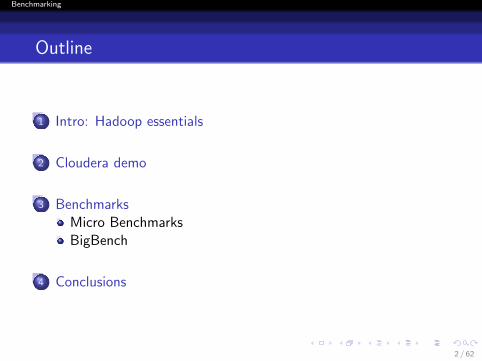
Outline
1 Intro: Hadoop essentials
2 Cloudera demo
3 BenchmarksMicro BenchmarksBigBench
4 Conclusions
2 / 62

Benchmarking
Intro: Hadoop essentials
Outline
1 Intro: Hadoop essentials
2 Cloudera demo
3 BenchmarksMicro BenchmarksBigBench
4 Conclusions
3 / 62

Benchmarking
Intro: Hadoop essentials
Hadoop
Hadoop is VMware, but the other way around.
4 / 62

Benchmarking
Intro: Hadoop essentials
Hadoop 1.0
Source: Apache Hadoop YARN : moving beyondMapReduce and batch processing with Apache Hadoop 2,Hortonworks, 2014)
MapReduce and HDFS are thecore components, while othercomponents are built around thecore.
5 / 62

Benchmarking
Intro: Hadoop essentials
Hadoop 2.0
Source: Apache Hadoop YARN : moving beyondMapReduce and batch processing with Apache Hadoop 2,Hortonworks, 2014)
YARN adds a more generalinterface to run non-MapReducejobs within the Hadoopframework.
6 / 62

Benchmarking
Intro: Hadoop essentials
HDFS
Hadoop Distributed File System
Source: http://www.cac.cornell.edu/vw/MapReduce/dfs.aspx
7 / 62

Benchmarking
Intro: Hadoop essentials
MapReduce
MapReduce = Programming Model
WordCount example:
Source: Optimizing Hadoop for MapReduce, Khaled Tannir
8 / 62

Benchmarking
Intro: Hadoop essentials
Hadoop distributions
9 / 62

Benchmarking
Cloudera demo
Outline
1 Intro: Hadoop essentials
2 Cloudera demo
3 BenchmarksMicro BenchmarksBigBench
4 Conclusions
10 / 62

Benchmarking
Cloudera demo
HDFS
11 / 62

Benchmarking
Cloudera demo
NameNode and DataNodes
12 / 62

Benchmarking
Cloudera demo
Hosts and their roles
13 / 62
Benchmarking
Cloudera demo
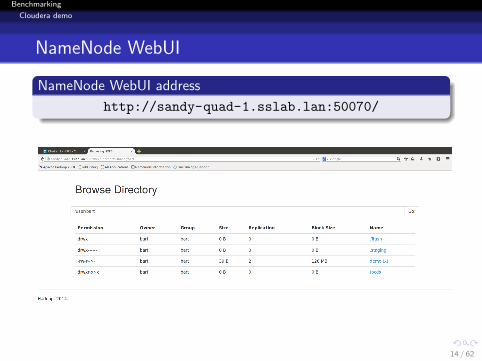
NameNode WebUI
NameNode WebUI address
http://sandy-quad-1.sslab.lan:50070/
14 / 62
Benchmarking
Cloudera demo
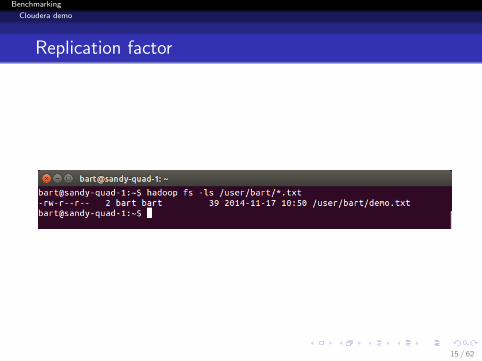
Replication factor
15 / 62

Benchmarking
Cloudera demo
HDFS Blocks
16 / 62
Benchmarking
Cloudera demo
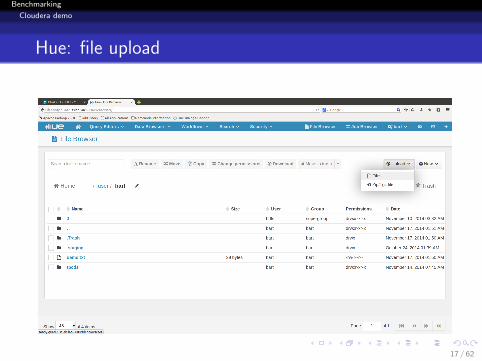
Hue: file upload
17 / 62

Benchmarking
Cloudera demo
Hadoop jobs: counters/metrics
18 / 62

Benchmarking
Benchmarks
Outline
1 Intro: Hadoop essentials
2 Cloudera demo
3 BenchmarksMicro BenchmarksBigBench
4 Conclusions
19 / 62
Benchmarking
Benchmarks
Why benchmark?
My three reasons for using benchmarks:
1 Evaluating the effect of a hardware/software upgrade:
OS, Java VM,. . .Hadoop, Cloudera CDH, Pig, Hive, Impala,. . .
2 Debugging:
Compare with other clusters or published results.
3 Performance tuning:
E.g. Cloudera CDH default config is defensive, not optimal.
20 / 62
Benchmarking
Benchmarks
Micro Benchmarks
Outline
1 Intro: Hadoop essentials
2 Cloudera demo
3 BenchmarksMicro BenchmarksBigBench
4 Conclusions
21 / 62
Benchmarking
Benchmarks
Micro Benchmarks
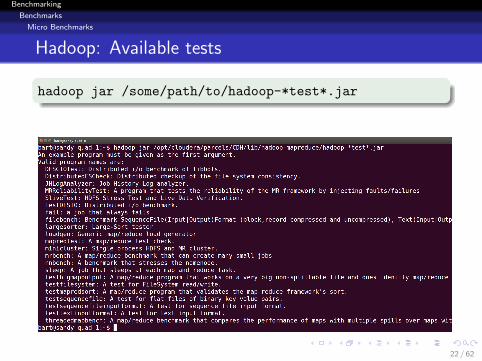
Hadoop: Available tests
hadoop jar /some/path/to/hadoop-*test*.jar
22 / 62

Benchmarking
Benchmarks
Micro Benchmarks
TestDFSIO
Read and write test for HDFS.
Helpful for
getting an idea of how fast your cluster is in terms of I/O,
stress testing HDFS,
discover network performance bottlenecks,
shake out the hardware, OS and Hadoop setup of your clustermachines (particularly the NameNode and the DataNodes).
23 / 62

Benchmarking
Benchmarks
Micro Benchmarks
TestDFSIO: write test
Generate 10 files of size 1 GB for a total of 10 GB:
$ hadoop jar hadoop-*test*.jar \
TestDFSIO -write -nrFiles 10 -fileSize 1000
TestDFSIO is designed to use 1 map task per file(1:1 mapping from files to map tasks)
24 / 62
Benchmarking
Benchmarks
Micro Benchmarks
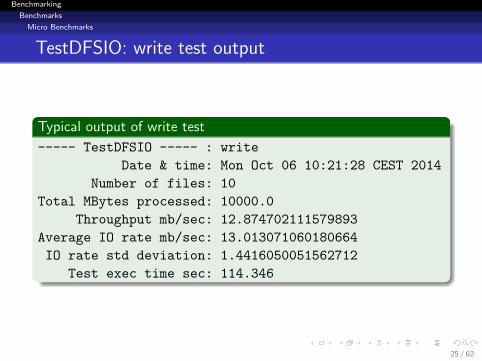
TestDFSIO: write test output
Typical output of write test
----- TestDFSIO ----- : write
Date & time: Mon Oct 06 10:21:28 CEST 2014
Number of files: 10
Total MBytes processed: 10000.0
Throughput mb/sec: 12.874702111579893
Average IO rate mb/sec: 13.013071060180664
IO rate std deviation: 1.4416050051562712
Test exec time sec: 114.346
25 / 62

Benchmarking
Benchmarks
Micro Benchmarks
Interpreting TestDFSIO results
Definition (Throughput)
Throughput(N) =
∑Ni=0 filesizei∑Ni=0 timei
Definition (Average IO rate)
Average IO rate(N) =
∑Ni=0 rateiN
=
∑Ni=0
filesizeitimei
N
Here, N is the number of map tasks.
26 / 62

Benchmarking
Benchmarks
Micro Benchmarks
TestDFSIO: read test
Read 10 input files, each of size 1 GB:
$ hadoop jar hadoop-*test*.jar \
TestDFSIO -read -nrFiles 10 -fileSize 1000
27 / 62

Benchmarking
Benchmarks
Micro Benchmarks
TestDFSIO: read test output
Typical output of read test
----- TestDFSIO ----- : read
Date & time: Mon Oct 06 10:56:15 CEST 2014
Number of files: 10
Total MBytes processed: 10000.0
Throughput mb/sec: 402.4306813151435
Average IO rate mb/sec: 492.8257751464844
IO rate std deviation: 196.51233829270575
Test exec time sec: 33.206
28 / 62
Benchmarking
Benchmarks
Micro Benchmarks
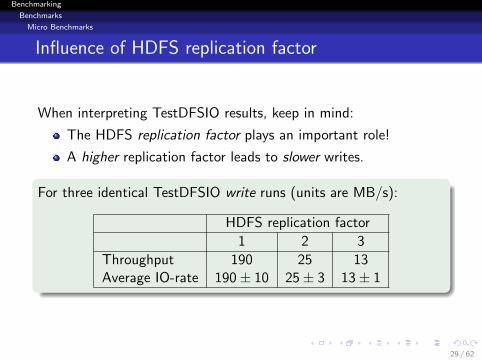
Influence of HDFS replication factor
When interpreting TestDFSIO results, keep in mind:
The HDFS replication factor plays an important role!
A higher replication factor leads to slower writes.
For three identical TestDFSIO write runs (units are MB/s):
HDFS replication factor
1 2 3
Throughput 190 25 13Average IO-rate 190± 10 25± 3 13± 1
29 / 62
Benchmarking
Benchmarks
Micro Benchmarks
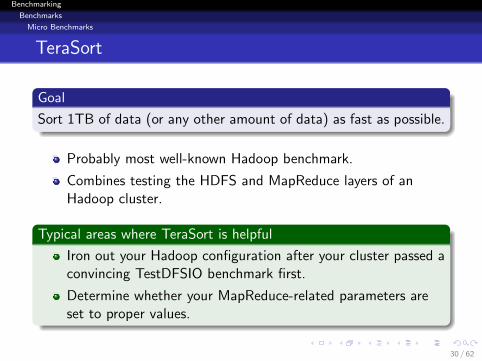
TeraSort
Goal
Sort 1TB of data (or any other amount of data) as fast as possible.
Probably most well-known Hadoop benchmark.
Combines testing the HDFS and MapReduce layers of anHadoop cluster.
Typical areas where TeraSort is helpful
Iron out your Hadoop configuration after your cluster passed aconvincing TestDFSIO benchmark first.
Determine whether your MapReduce-related parameters areset to proper values.
30 / 62
Benchmarking
Benchmarks
Micro Benchmarks
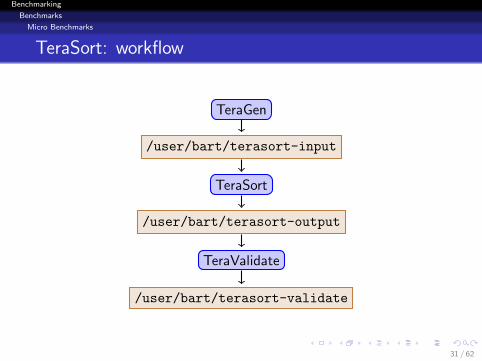
TeraSort: workflow
TeraGen
/user/bart/terasort-input
TeraSort
/user/bart/terasort-output
TeraValidate
/user/bart/terasort-validate
31 / 62

Benchmarking
Benchmarks
Micro Benchmarks
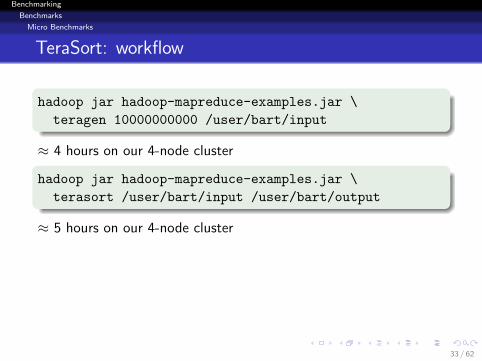
TeraSort: workflow
hadoop jar hadoop-mapreduce-examples.jar \
teragen 10000000000 /user/bart/input
≈ 4 hours on our 4-node cluster
hadoop jar hadoop-mapreduce-examples.jar \
terasort /user/bart/input /user/bart/output
≈ 5 hours on our 4-node cluster
hadoop jar hadoop-mapreduce-examples.jar \
teravalidate /user/bart/output /user/bart/validate
If something went wrong, TeraValidate’s output contains theproblem report.
32 / 62
Benchmarking
Benchmarks
Micro Benchmarks
TeraSort: workflow
hadoop jar hadoop-mapreduce-examples.jar \
teragen 10000000000 /user/bart/input
≈ 4 hours on our 4-node cluster
hadoop jar hadoop-mapreduce-examples.jar \
terasort /user/bart/input /user/bart/output
≈ 5 hours on our 4-node cluster
hadoop jar hadoop-mapreduce-examples.jar \
teravalidate /user/bart/output /user/bart/validate
If something went wrong, TeraValidate’s output contains theproblem report.
33 / 62

Benchmarking
Benchmarks
Micro Benchmarks
TeraSort: workflow
hadoop jar hadoop-mapreduce-examples.jar \
teragen 10000000000 /user/bart/input
≈ 4 hours on our 4-node cluster
hadoop jar hadoop-mapreduce-examples.jar \
terasort /user/bart/input /user/bart/output
≈ 5 hours on our 4-node cluster
hadoop jar hadoop-mapreduce-examples.jar \
teravalidate /user/bart/output /user/bart/validate
If something went wrong, TeraValidate’s output contains theproblem report.
34 / 62
Benchmarking
Benchmarks
Micro Benchmarks
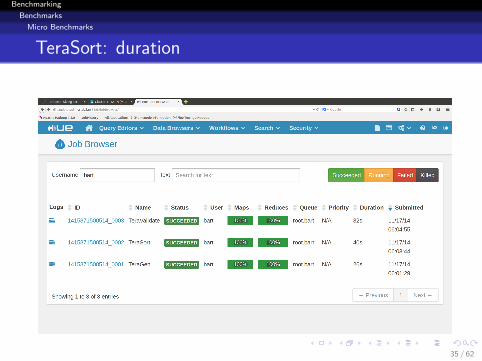
TeraSort: duration
35 / 62

Benchmarking
Benchmarks
Micro Benchmarks
TeraSort: counters
36 / 62

Benchmarking
Benchmarks
Micro Benchmarks
NNBench
Goal
Load test the NameNode hardware and software.
Generates a lot of HDFS-related requests with normally verysmall payloads.
Purpose: put a high HDFS management stress on theNameNode.
Can simulate requests for creating, reading, renaming anddeleting files on HDFS.
37 / 62

Benchmarking
Benchmarks
Micro Benchmarks
NNBench: example
Create 1000 files using 12 maps and 6 reducers:
$ hadoop jar hadoop-*test*.jar nnbench \
-operation create_write \
-maps 12 \
-reduces 6 \
-blockSize 1 \
-bytesToWrite 0 \
-numberOfFiles 1000 \
-replicationFactorPerFile 3 \
-readFileAfterOpen true \
-baseDir /user/bart/NNBench-‘hostname -s‘
38 / 62

Benchmarking
Benchmarks
Micro Benchmarks
MRBench
Goal
Loop a small job a number of times.
checks whether small job runs are responsive and runningefficiently on the cluster
complimentary to TeraSort
puts its focus on the MapReduce layer
impact on the HDFS layer is very limited
39 / 62

Benchmarking
Benchmarks
Micro Benchmarks
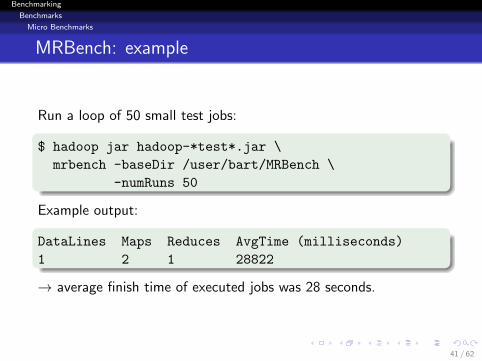
MRBench: example
Run a loop of 50 small test jobs:
$ hadoop jar hadoop-*test*.jar \
mrbench -baseDir /user/bart/MRBench \
-numRuns 50
Example output:
DataLines Maps Reduces AvgTime (milliseconds)
1 2 1 28822
→ average finish time of executed jobs was 28 seconds.
40 / 62
Benchmarking
Benchmarks
Micro Benchmarks
MRBench: example
Run a loop of 50 small test jobs:
$ hadoop jar hadoop-*test*.jar \
mrbench -baseDir /user/bart/MRBench \
-numRuns 50
Example output:
DataLines Maps Reduces AvgTime (milliseconds)
1 2 1 28822
→ average finish time of executed jobs was 28 seconds.
41 / 62
Benchmarking
Benchmarks
BigBench
Outline
1 Intro: Hadoop essentials
2 Cloudera demo
3 BenchmarksMicro BenchmarksBigBench
4 Conclusions
42 / 62

Benchmarking
Benchmarks
BigBench
BigBench
Source: http://mhpersonaltrainer.mhpersonaltrainer.com/mhpersonaltrainer/56616/index
43 / 62

Benchmarking
Benchmarks
BigBench
BigBench
Big Data benchmark based on TPC-DS.
Focus is mostly on MapReduce engines.
Collaboration between industry and academia.
https://github.com/intel-hadoop/Big-Bench/
History
Launched at First Workshop on Big Data Benchmarking(May 8-9, 2012).
Full kit at Fifth Workshop on Big Data Benchmarking(August 5-6, 2014).
44 / 62

Benchmarking
Benchmarks
BigBench
BigBench data model
Source: BigBench: Towards an Industry Standard Benchmark for Big Data Analytics, Ghazal et al., 2013.
45 / 62

Benchmarking
Benchmarks
BigBench
BigBench: Data Model - 3 V’s
Variety
BigBench data is
structured,
semi-structured,
unstructured.
Velocity
Periodic refreshes for all data.
Different velocity for different areas:
Vstructured < Vunstructured < Vsemistructured
Volume
TPC-DS: discrete scale factors(100, 300, 1000, 3000, 10000, 3000 and 100000).
BigBench: continuous scale factor.
46 / 62

Benchmarking
Benchmarks
BigBench
BigBench: Workload
Workload queries
30 “queries”
Specified in English (sort of)
No required syntax (first implementation in Aster SQL MR)
Kit implemented in Hive, Hadoop MR, Mahout, OpenNLP
Business functions (McKinsey)
Marketing
Merchandising
Operations
Supply chain
Reporting (customers and products)
47 / 62

Benchmarking
Benchmarks
BigBench
BigBench: Workload - Technical Aspects
Data Sources
Number of Queries Percentage
Structured 18 60 %Semi-structured 7 23 %Unstructured 5 17 %
Analytic techniques
Number of Queries Percentage
Statistics analysis 6 20 %Data mining 17 57 %Reporting 8 27 %
48 / 62

Benchmarking
Benchmarks
BigBench
BigBench: Workload - Technical Aspects
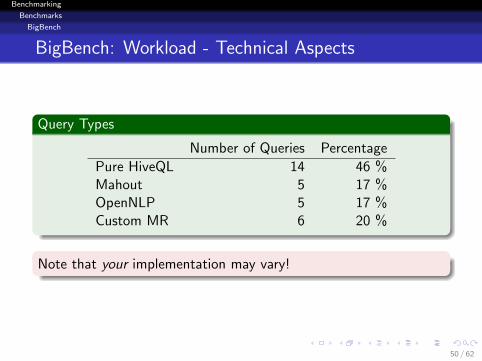
Query Types
Number of Queries Percentage
Pure HiveQL 14 46 %Mahout 5 17 %OpenNLP 5 17 %Custom MR 6 20 %
Note that your implementation may vary!
49 / 62
Benchmarking
Benchmarks
BigBench
BigBench: Workload - Technical Aspects
Query Types
Number of Queries Percentage
Pure HiveQL 14 46 %Mahout 5 17 %OpenNLP 5 17 %Custom MR 6 20 %
Note that your implementation may vary!
50 / 62

Benchmarking
Benchmarks
BigBench
BIgBench: Benchmark Process
Source: http://www.tele-task.de/archive/video/flash/24896/
51 / 62
Benchmarking
Benchmarks
BigBench
BigBench: Metric
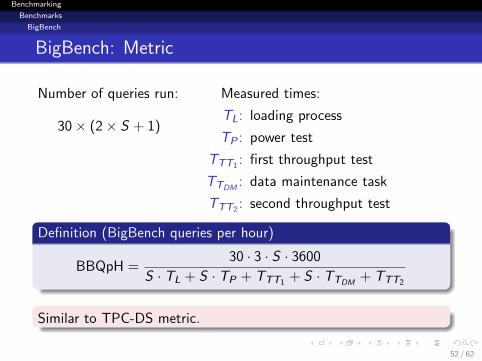
Number of queries run:
30× (2× S + 1)
Measured times:
TL: loading process
TP : power test
TTT1 : first throughput test
TTDM: data maintenance task
TTT2 : second throughput test
Definition (BigBench queries per hour)
BBQpH =30 · 3 · S · 3600
S · TL + S · TP + TTT1 + S · TTDM+ TTT2
Similar to TPC-DS metric.
52 / 62

Benchmarking
Benchmarks
BigBench
BigBench: results
53 / 62

Benchmarking
Benchmarks
BigBench
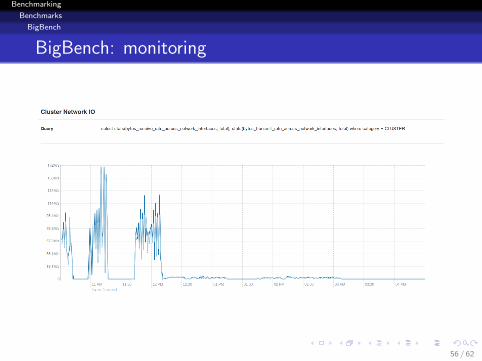
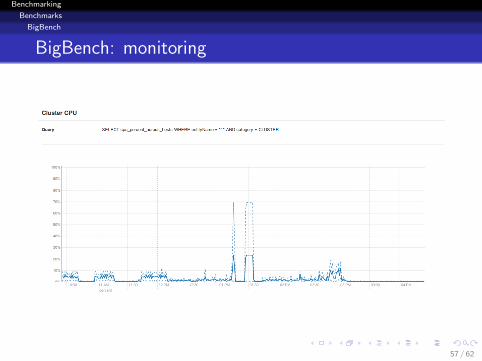
BigBench: monitoring
54 / 62

Benchmarking
Benchmarks
BigBench
BigBench: monitoring
55 / 62
Benchmarking
Benchmarks
BigBench
BigBench: monitoring
56 / 62
Benchmarking
Benchmarks
BigBench
BigBench: monitoring
57 / 62

Benchmarking
Benchmarks
BigBench
BigBench: in progress
58 / 62
Source: The Hortonworks Blog
Benchmarking
Conclusions
Outline
1 Intro: Hadoop essentials
2 Cloudera demo
3 BenchmarksMicro BenchmarksBigBench
4 Conclusions
59 / 62

Benchmarking
Conclusions
Conclusions
Use Hadoop distributions!
Hadoop cluster administration → Cloudera Manager.
Micro-benchmarks ↔ BigBench.
Your best benchmark is your own application!
60 / 62

Benchmarking
Conclusions
Conclusions
Use Hadoop distributions!
Hadoop cluster administration → Cloudera Manager.
Micro-benchmarks ↔ BigBench.
Your best benchmark is your own application!
61 / 62

Benchmarking
Conclusions
Questions?
Source: https://gigaom.com/2011/12/19/my-hadoop-is-bigger-than-yours/
62 / 62