Embed Size (px)
Citation preview
(c) AZOTH Analytics February 2016
Global Automotive Scanner Market: Trends, Opportunities
and Forecasts (2016-2021)
• By Market Segment (Type of Scanner) -Handheld, Professional, Wireless
• By Region-North America, Europe, APAC, RoW
• By Country- US, UK, Canada, Germany, China, India, Japan
• Market Share by Technology • Supply Chain Structure

(c) AZOTH Analytics
Table of Content
2
S.No Particulars Page No.
1. Research Methodology 15
2. Product Overview 16
3. Executive Summary 25
4. Global Automotive Scanner Market: An Analysis 26
4.1. Global Automotive Scanner Market : Size, Growth & Forecast 26
4.1.1. By Value (Historic 2011-15) 27
4.1.2. By Value ( Forecast 2016E-2021F) 29
4.1.3. By Product Type, By Value, By Percentage (2014) 31
4.1.4. By Company, By Value, By Percentage (2014) 32
5. Global Handheld Scanner Market 33
5.1. By Value (Historic 2011-15) 34
5.2. By Value ( Forecast 2016E-2021F) 35
6. Global Professional Scanner Market 36
6.1. By Value (Historic 2011-15) 37
6.2. By Value ( Forecast 2016E-2021F) 38
7. Global Wireless Jack Market 39
7.1. Global Wireless Jack Market Overview 40
7.1.1. By Value (Historic 2011-15) 41
7.1.2. By Value ( Forecast 2016E-2021F) 42
(c) AZOTH Analytics 3
S. No Particulars Page No.
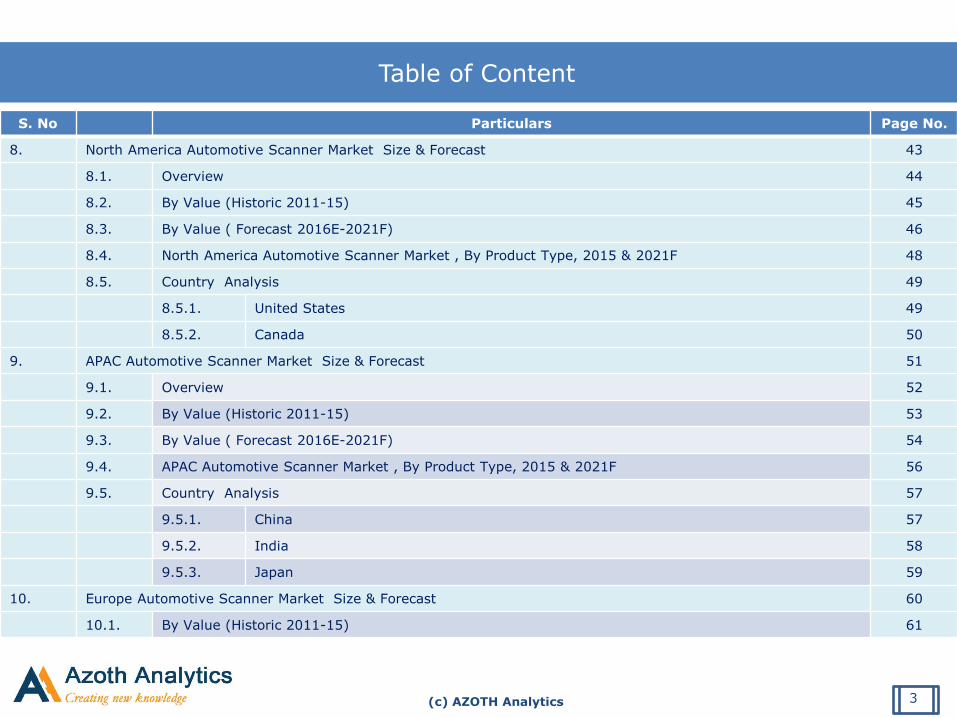
8. North America Automotive Scanner Market Size & Forecast 43
8.1. Overview 44
8.2. By Value (Historic 2011-15) 45
8.3. By Value ( Forecast 2016E-2021F) 46
8.4. North America Automotive Scanner Market , By Product Type, 2015 & 2021F 48
8.5. Country Analysis 49
8.5.1. United States 49
8.5.2. Canada 50
9. APAC Automotive Scanner Market Size & Forecast 51
9.1. Overview 52
9.2. By Value (Historic 2011-15) 53
9.3. By Value ( Forecast 2016E-2021F) 54
9.4. APAC Automotive Scanner Market , By Product Type, 2015 & 2021F 56
9.5. Country Analysis 57
9.5.1. China 57
9.5.2. India 58
9.5.3. Japan 59
10. Europe Automotive Scanner Market Size & Forecast 60
10.1. By Value (Historic 2011-15) 61
Table of Content

(c) AZOTH Analytics
S. No Particulars Page No.
10.2. By Value ( Forecast 2016E-2021F) 62
10.3. Europe Automotive Scanner Market , By Product Type, 2015 & 2021F 63
10.4. Country Analysis 64
10.4.1. U K 64
10.4.2. Germany 65
11. ROW Automotive Scanner Market Size & Forecast 66
11.1. By Value (Historic 2011-15) 67
11.2. By Value ( Forecast 2016E-2021F) 69
12. Market Trends & Developments 70
12.1. Presence of High End Manufacturers in Developing Countries
12.2. Advancement of Electronics In Automotives
12.3. Transition Towards the Stringent Emission Norms
12.4. Rise in the Number of Vehicle Workshops
12.5. Evolution of Wireless Scanning Tools
13. Market Dynamics 79
13.1. Drivers 81
13.1.1 Complexity of the electronics
13.1.2. Standardisation of the diagnostic software
13.1.3. Reduction in the tools needed to diagnose faults
4
Table of Content

(c) AZOTH Analytics
S. No Particulars Page No.
13.1.4. Growth in the need of diagnostic software
13.2. Challenges 85
13.2.1 Cost of equipment is high
13.2.2. Highly technical operation
13.2.3. Updating of the scan tools with each new launch of vehicle
14. Policy and Regulatory Landscape 88
14.1. UNECE Vehicle Emission Regulation Overview
14.2. USEPA-Emission Standards
14.3. On-Road Vehicle and Engine Emission Regulations (SOR/2003-2) CANADA
14.4. EMISSIONS NORMS EUROPE
14.5. EMISSIONS NORMS INDIA
14.6. Vehicle Emission Standards Australia
15. Value Chain Analysis 108
15.1. Supply Chain Diagram
15.2. Automotive Scanner Supply Chain
16. On - Board Diagnostic Analysis 111
16.1. Overview
16.2. OBD I and OBD II
16.3. Shift to OBD II
16.4. OBD II Upgrades
5
Table of Content

(c) AZOTH Analytics
S. No Particulars Page No.
16.5. Different Audience to use OBD
16.6. Features
16.6.1. Diagnostic Trouble Codes (DTC’s)
16.6.2. Misfire Monitoring
16.6.3. Exhaust Gas Recirculation (EGR) System Monitor
16.6.4. Evaporative Emission Control System (EVAP) System Monitor
16.6.5. Secondary AIR System Monitor
16.6.6. Catalytic Converter Monitoring System
16.6.7. Check Engine Light (MIL)
16.6.8. Freeze Frame Data
16.6.9. OBD Drive Cycle
17. Automotive Scanner Trade Data 128
17.1. Top 5 Nations with Import by Value (Billion $)
17.2. Top 5 Nations with Export by Value (Billion $)
18. Global Automotive Data 131
18.1. Passenger Car Sales
18.2. Commercial Vehicle Sales
18.3. Passenger Car Production
18.4. Light Commercial Vehicle Production
18.5. Heavy Trucks Production
6
Table of Content

(c) AZOTH Analytics
S. No Particulars Page No.
18.6. Heavy Buses Production
18.7. Passenger Car in Use Worldwide
18.8. Commercial Vehicle in Use Worldwide
18.9. Total Vehicles in Use Worldwide
18.10. Motorization Rate Region Wise
19. Porter Five Force Analysis 142
19.1. Porter Five Force Model Automotive Scanner
20. Competitive landscape 144
20.1 Company Financials
20.1.1. Top 5 Companies Sales
20.1.2. Bottom 5 Companies Sales
20.1.3. Top 5 Companies EBITDA
20.1.4. Bottom 5 Companies EBITDA
20.1.5. Top 5 Companies EBIT
20.1.6. Bottom 5 Companies EBIT
20.1.7. Top 5 Companies PBT
20.1.8. Bottom 5 Companies PBT
20.1.9. Top 5 Companies PAT
20.1.10 Bottom 5 Companies PAT
7
Table of Content

(c) AZOTH Analytics 8
S. No Particulars Page No.
20.2. Company Ratios
20.2.1. Top 5 Companies Current Ratio
20.2.2. Bottom 5 Companies Current Ratio
20.2.3. Top 5 Companies Profit Margin
20.2.4. Bottom 5 Companies Profit Margin
20.2.5. Top 5 Companies Debt Equity Ratio
20.2.6. Bottom 5 Companies Debt Equity Ratio
21. Global Automotive Scanner Market – Company Profiles 161
21.1. Bosch Group
22.2. Delphi Automotive PLC
22.3. Actia Group SA
22.4. Softing AG
22.5. IEC Electronics
22.6. Snap-on Incorporated
22.7. Launch Tech Co Ltd
22.8. SPX Corporation
22.9. Continental AG
22.10. Denso Corp
Table of Content

(c) AZOTH Analytics 9
S. No Particulars Page No.
22. Strategic Recommendations 190
Table of Content
(c) AZOTH Analytics
List of Figures
Figure No. Figure Title Page No.
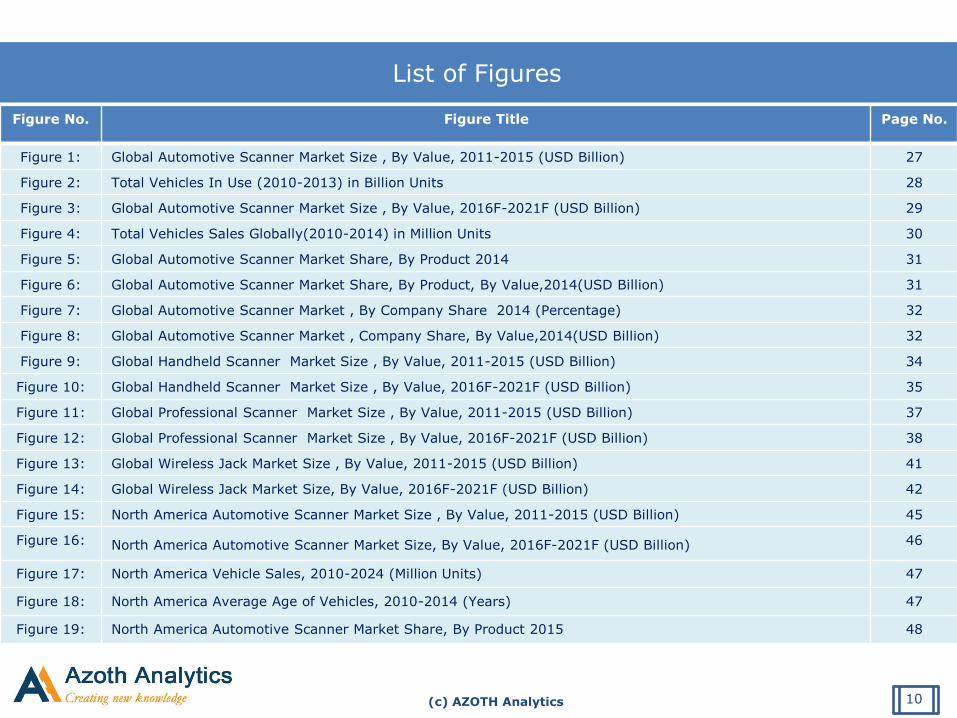
Figure 1: Global Automotive Scanner Market Size , By Value, 2011-2015 (USD Billion) 27
Figure 2: Total Vehicles In Use (2010-2013) in Billion Units 28
Figure 3: Global Automotive Scanner Market Size , By Value, 2016F-2021F (USD Billion) 29
Figure 4: Total Vehicles Sales Globally(2010-2014) in Million Units 30
Figure 5: Global Automotive Scanner Market Share, By Product 2014 31
Figure 6: Global Automotive Scanner Market Share, By Product, By Value,2014(USD Billion) 31
Figure 7: Global Automotive Scanner Market , By Company Share 2014 (Percentage) 32
Figure 8: Global Automotive Scanner Market , Company Share, By Value,2014(USD Billion) 32
Figure 9: Global Handheld Scanner Market Size , By Value, 2011-2015 (USD Billion) 34
Figure 10: Global Handheld Scanner Market Size , By Value, 2016F-2021F (USD Billion) 35
Figure 11: Global Professional Scanner Market Size , By Value, 2011-2015 (USD Billion) 37
Figure 12: Global Professional Scanner Market Size , By Value, 2016F-2021F (USD Billion) 38
Figure 13: Global Wireless Jack Market Size , By Value, 2011-2015 (USD Billion) 41
Figure 14: Global Wireless Jack Market Size, By Value, 2016F-2021F (USD Billion) 42
Figure 15: North America Automotive Scanner Market Size , By Value, 2011-2015 (USD Billion) 45
Figure 16: North America Automotive Scanner Market Size, By Value, 2016F-2021F (USD Billion) 46
Figure 17: North America Vehicle Sales, 2010-2024 (Million Units) 47
Figure 18: North America Average Age of Vehicles, 2010-2014 (Years) 47
Figure 19: North America Automotive Scanner Market Share, By Product 2015 48
10

(c) AZOTH Analytics
List of Figures
Figure No. Figure Title Page No.
Figure 20: North America Automotive Scanner Market Share, By Product,2021F 48
Figure 21: America Aftermarket Market Size, By Value, 2010-2018E (USD Billion) 49
Figure 22: America Sales of Vehicles, 2010-2014 (Million Units) 49
Figure 23: Canada Sales of Vehicles, 2010-2014 (Million Units) 50
Figure 24: APAC Automotive Scanner Market Size , By Value, 2011-2015 (USD Billion) 53
Figure 25: APAC Automotive Scanner Market Size, By Value, 2016F-2021F (USD Billion) 54
Figure 26: APAC Vehicle Sales, 2010-2014 (Million Units) 55
Figure 27: APAC Automotive Scanner Market Share, By Product 2015 56
Figure 28: APAC Automotive Scanner Market Share, By Product,2021F 56
Figure 29: Vehicle Production in China , 2010-2015 (Million Units) 57
Figure 30: China Sales of Vehicles, 2010-2014 (Million Units) 57
Figure 31: Automotive Component Industry in India , 2010-2015 (Billion USD) 58
Figure 32: India Sales of Vehicles, 2010-2014 (Million Units) 58
Figure 33: Vehicle Production in Japan , 2010-2015 (Million Units) 59
Figure 34: Japan Sales of Vehicles, 2010-2014 (Million Units) 59
Figure 35: Europe Automotive Scanner Market Size , By Value, 2011-2015 (USD Billion) 61
Figure 36: Europe Automotive Scanner Market Size, By Value, 2016F-2021F (USD Billion) 62
Figure 37: Europe Automotive Scanner Market Share, By Product 2015 63
Figure 38: Europe Automotive Scanner Market Share, By Product,2021F 63
Figure 39: Used Vehicle Sales in UK , 2010-2014 (Million Units) 64
Figure 40: Cars on Road in UK, 2011-2015 (Million Units) 64
11

(c) AZOTH Analytics
List of Figures
Figure No. Figure Title Page No.
Figure 41: Vehicle Re-Sales in Germany , 2010-2014 (Million Units) 65
Figure 42: Vehicle Sales in Germany, 2010-2014 (Million Units) 65
Figure 43: ROW Automotive Scanner Market Size , By Value, 2011-2015 (USD Billion 67
Figure 44: South America Vehicles sales 2010-2014 68
Figure 45: Middle East Vehicles sales 2010-2014 68
Figure 46: ROW Automotive Scanner Market Size, By Value, 2016F-2021F (USD Billion) 69
Figure 47: Automotive Tools Imports, By Top Countries, 2010-2014 (Billion $) 129
Figure 48: Automotive Tools Exports, By Top Countries, 2010-2014 (Billion $) 130
Figure 49: Passenger Car Sales (2010-2014) in Million Units 132
Figure 50: Commercial Vehicle Sales (2010-2014) in Million Units 133
Figure 51: Passenger Car Production (2010-2014) in Million Units 134
Figure 52: Light Commercial Vehicle Production (2010-2014) in Million Units 135
Figure 53: Heavy Trucks Production (2010-2014) in Million Units 136
Figure 54: Heavy Buses Production (2010-2014) in Million Units 137
Figure 55: Passenger Car in Use (2010-2013) in Million Units 138
Figure 56: Passenger Car in Use (2010-2013) in Million Units 139
Figure 57: Passenger Car in Use (2010-2013) in Million Units 140
Figure 58: Passenger Car in Use (2012-2013) per 1000 inhabitants 141
Figure 59: Top 5 Companies Sales in USD Billion 145
Figure 60: Bottom 5 Companies Sales in USD Billion 146
12

(c) AZOTH Analytics
List of Figures
Figure No. Figure Title Page No.
Figure 61: Top 5 Companies EBITDA in USD Billion 147
Figure 62: Bottom 5 Companies EBITDA in USD Billion 148
Figure 63: Top 5 Companies EBIT in USD Billion 149
Figure 64: Bottom 5 Companies EBIT in USD Billion 150
Figure 65: Top 5 Companies PBT in USD Billion 151
Figure 66: Bottom 5 Companies PBT in USD Billion 152
Figure 67: Top 5 Companies PAT in USD Billion 153
Figure 68: Bottom 5 Companies PAT in USD Billion 154
Figure 69: Top 5 Companies Current Ratio 155
Figure 70: Bottom 5 Companies Current Ratio 156
Figure 71: Top 5 Companies Profit Margin 157
Figure 72: Bottom 5 Companies Profit Margin 158
Figure 73: Top 5 Companies Debt Equity Ratio 159
Figure 74: Bottom 5 Companies Debt Equity Ratio 160
Figure 75: Bosch Group Percentage Revenue, By Product Segment (2014-2015) 162
Figure 76: Bosch Group Percentage Revenue, By Geography (2014-2015) 162
Figure 77: Bosch Group Sales (USD Billion) 2011-2014 163
Figure 78: Delphi Automotive PLC Percentage Revenue, By Product Segment (2014-2015) 165
Figure 79: Delphi Automotive PLC Percentage Revenue, By Geography (2014-2015) 165
Figure 80: Delphi Automotive PLC Sales (USD Billion) 2011-2014 166
13

(c) AZOTH Analytics
List of Figures
Figure No. Figure Title Page No.
Figure 81: Actia Group SA Sales (USD Billion) 2011-2014 168
Figure 82: Softing AG Percentage Revenue, By Product Segment (2014-2015) 170
Figure 83: Softing AG Percentage Revenue, By Geography (2014-2015) 170
Figure 84: Softing AG Sales (USD Billion) 2011-2014 171
Figure 85: IEC Electronics Percentage Revenue, By Product Segment (2014-2015) 173
Figure 86: IEC Electronics Percentage Revenue, By Geography (2014-2015) 173
Figure 87: IEC Electronics Sales (USD Billion) 2011-2014 174
Figure 88: Snap-on Incorporated Percentage Revenue, By Product Segment (2014-2015) 176
Figure 89: Snap-on Incorporated Percentage Revenue, By Geography (2014-2015) 176
Figure 90: Snap-on Incorporated Sales (USD Billion) 2011-2014 177
Figure 91: Launch Tech Co Ltd Sales (USD Billion) 2011-2014 179
Figure 92: SPX Corporation Percentage Revenue, By Product Segment (2014-2015) 181
Figure 93: SPX Corporation Percentage Revenue, By Geography (2014-2015) 181
Figure 94: SPX Corporation Sales (USD Billion) 2011-2014 182
Figure 95: Continental AG Percentage Revenue, By Product Segment (2014-2015) 184
Figure 96: Continental AG Percentage Revenue, By Geography (2014-2015) 184
Figure 97: Continental AG Sales (USD Billion) 2011-2014 185
Figure 98: Denso Corp Percentage Revenue, By Product Segment (2014-2015) 187
Figure 99: Denso Corp Percentage Revenue, By Geography (2014-2015) 187
Figure 100: Denso Corp Sales (USD Billion) 2011-2014 188
14

(c) AZOTH Analytics
Research Methodology
Research Definition
• The Global Automotive Scanner Report comprises of the study of various aspects of Global Automotive
Scanner Market and forecast until 2021. The Automotive Scanner market has been segmented on
regional basis and types of the scanner products. The major products taken into account are Handheld
scanners, Professional Scanners and Wireless Jack.
Data Analysis and Interpretation
• The industry, sector and the segment is defined and the historic market trend is figured out through
various paid databases. The next stage involves comprehensive primary research in which the various
stakeholders of the market segment (e.g. Marketing Mangers of Manufacturing Companies, Dealers) are
contacted, interviewed and their insights taken. The insights from the experts/stakeholders are
triangulated with the historical market trends. Further, Back-of-the-Envelope calculation for the market
estimation is made through proper understanding of the market as well as future business strategies of
the companies engaged in the market.
15
Companies Interviewed: Continental AG, Delphi Automotive PLC, Softing AG,Bosch, etc..
(c) AZOTH Analytics
Global Automotive Scanner Market Size
16
xx
xx
xx
xx
xx
2010 2011 2012 2013 2014
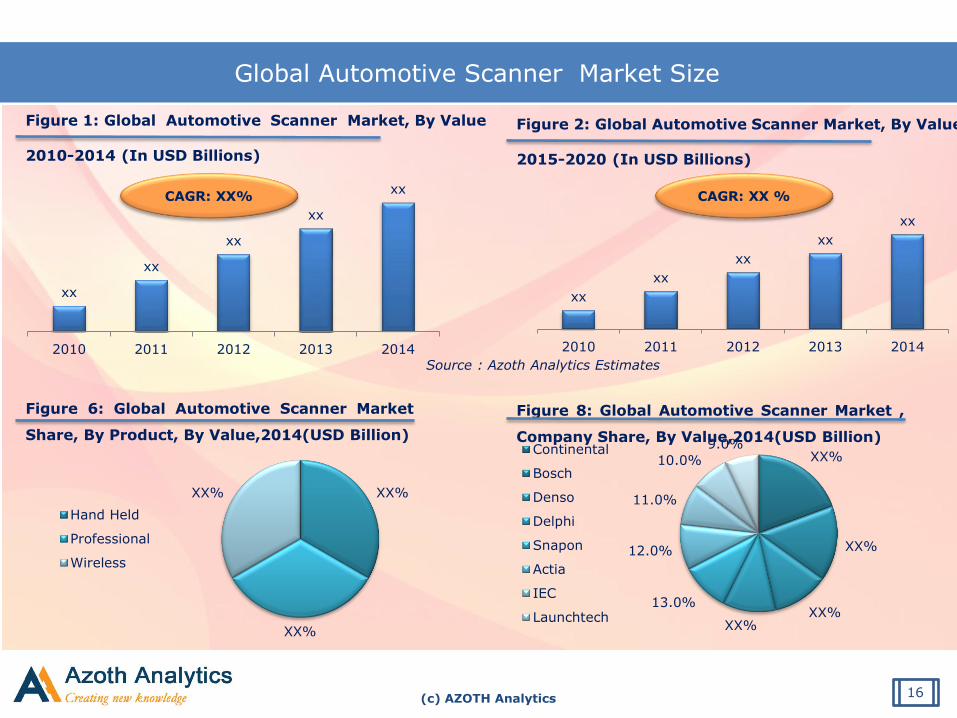
Figure 1: Global Automotive Scanner Market, By Value 2010-2014 (In USD Billions)
CAGR: XX% CAGR: XX %
Source : Azoth Analytics Estimates
Figure 2: Global Automotive Scanner Market, By Value 2015-2020 (In USD Billions)
xx
xx
xx
xx
xx
2010 2011 2012 2013 2014
XX%
XX%
XX%
Hand Held
Professional
Wireless
XX%
XX%
XX% XX%
13.0%
12.0%
11.0%
10.0%
9.0% Continental
Bosch
Denso
Delphi
Snapon
Actia
IEC
Launchtech
Figure 6: Global Automotive Scanner Market
Share, By Product, By Value,2014(USD Billion)
Figure 8: Global Automotive Scanner Market ,
Company Share, By Value,2014(USD Billion)

(c) AZOTH Analytics
Global Automotive Scanner Market Share by Type
Figure 9:Global Handheld Scanner Market Size , By
Value, 2011-2015 (USD Billion)
Source : Azoth Analytics
Figure 10: Global Handheld Scanner Market Size , By Value, 2016F-2021F (USD Billion)
CAGR: XX% CAGR: XX%
Figure 11: Global Professional Scanner Market Size
, By Value, 2011-2015 (USD Billion)
Figure 12: Global Professional Scanner Market Size
, By Value, 2016F-2021F (USD Billion)
17
xx xx
xx xx
xx
2010 2011 2012 2013 2014
xx xx
xx xx
xx
2010 2011 2012 2013 2014
xx xx
xx xx
xx
2010 2011 2012 2013 2014
xx xx
xx xx
xx
2010 2011 2012 2013 2014
CAGR: XX% CAGR: XX%

(c) AZOTH Analytics
Global Automotive Scanner Market Outlook
Figure 13: Global Wireless Jack Market Size , By
Value, 2011-2015 (USD Billion)
CAGR: XX%
Figure 14: Global Wireless Jack Market Size, By
Value, 2016F-2021F (USD Billion)
CAGR: XX%
CAGR: XX%
Figure 16: North America Automotive
Scanner Market Size, By Value, 2016F-
2021F (USD Billion) CAGR: XX%
Figure 15: North America Automotive Scanner
Market Size , By Value, 2011-2015 (USD
Billion)
18
xx xx
xx xx
xx
2010 2011 2012 2013 2014
xx xx
xx xx
xx
2010 2011 2012 2013 2014
xx xx
xx xx
xx
2010 2011 2012 2013 2014
xx xx
xx xx
xx
2010 2011 2012 2013 2014
(c) AZOTH Analytics
Global Automotive Scanner Market Outlook
Figure 24: APAC Automotive Scanner Market Size ,
By Value, 2011-2015 (USD Billion)
CAGR: XX%
Figure 25 : APAC Automotive Scanner Market Size, By
Value, 2016F-2021F (USD Billion)
CAGR: XX%
CAGR: XX%
Figure 36: Europe Automotive Scanner
Market Size, By Value, 2016F-2021F (USD
Billion) CAGR: XX%
Figure 35: Europe Automotive Scanner Market
Size , By Value, 2011-2015 (USD Billion)
19
xx xx
xx xx
xx
2010 2011 2012 2013 2014
xx xx
xx xx
xx
2010 2011 2012 2013 2014
xx xx
xx xx
xx
2010 2011 2012 2013 2014
xx xx
xx xx
xx
2010 2011 2012 2013 2014