Embed Size (px)
Citation preview

PRR 475 Review - Tips
• Powerpoint Presentations – widgets too
• Topic Handouts
• Sample Questions
• Other Handouts e.g. Statistics
• Exercises from Lab
• Trochim chapters
• Other texts, websites

Research/Evaluation Concepts – evaluation.ppt
Proposals & Research Design –propdesb.ppt
Measurement –measure.ppt
Sampling –sample.ppt
Survey methods –survey99.ppt
Basic Statistics/Data analysis - handouts
Experiments –expmt.ppt
Observ., qualitative, other methods –QLQN.ppt, econevaluation.ppt
Communication & Ethics researchwriting.ppt, ethics.ppt
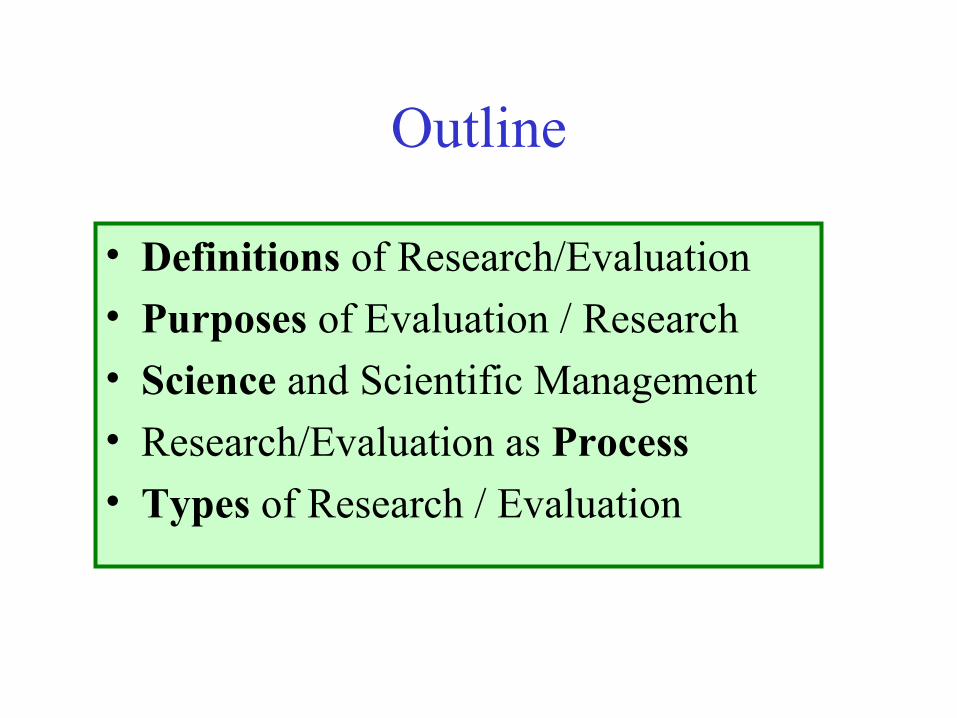
Outline
• Definitions of Research/Evaluation
• Purposes of Evaluation / Research
• Science and Scientific Management
• Research/Evaluation as Process
• Types of Research / Evaluation

Definitions
• Evaluation = Process of judging the merit or worth of something
• Research – application of scientific methods to answer
questions– controlled inquiry directed at increasing
knowledge/establishing truth
• Evaluation Research - combine the two

Science
• Body of Knowledge
• systematic• abstract• general• parsimonious
• Method of Inquiry
• logical– induction– deduction
• self-corrective• empirical

Scientific Management
• Application of scientific principles to management and decision making
– systematic information gathering– empirical, objective, self-corrective

Process -- Steps
Research• define problem• objectives/hypotheses• literature review• research methods• gather data/analysis• conclusions
Evaluation• describe program• evaluation criteria• program scoping• evaluation methods• gather data/analysis• conclusions

Types of Evaluationby Program Stage
• formative (conceptualization/design)]
• process (implementation)
• summative (outcomes, impacts, efficiency)

Types - By Approach
• Standards– norm-based– criterion-referenced
• Goals and objectives
• Impacts or effects

Evaluation Criteria
• Effort - qnty and qlty of inputs
• Performance - qnty and qlty of outputs
• Adequacy - meet needs?
• Efficiency - benefits/costs
• Equity - distributional issues, fairness

Process Evaluation
• Identifies how and why program works– attributes – recipients– conditions– effects
• single or multiple• intended or side effects• timing & duration, long/short term• cognitive, affective or behavioral

Research Process Define Problem, Research Objectives
HOW?
Overall Method•Survey•Experiment•Case Study•Secondary Data
What?•Concepts•Variables•Measures
Who?•Population•Sampling
Data Gathering
Analysis
Application

Proposal Format
1. Problem Statement - define program to be evaluated/problem to be studied, users & uses of results. Justify importance of the problem/study.
2. Objectives : Concise listing . In evaluation studies, the objectives usually focus on the key elements of program to be evaluated & the evaluation criteria. These are the study objectives NOT the program objectives.
3. Background/Literature Review - place for more extensive history/structure of program. Focus on aspects most relevant to proposed evaluation. Discuss previous studies or the relevant methods.
4. Methods - details on procedures for achieving objectives - data gathering and analysis, population, sampling, measures, etc. Who will do what to whom, when, where, how and why?
5. Attachments - budget, timeline, measurement instruments, etc.
NOTE: Most “programs” must be narrowed to specific components to be evaluated. Think of a “Program of studies” rather than a single evaluation study. The proposal should define this specific study & how it fits into a broader program of studies.

Purposes of Proposal
• Communicate with Client• Demonstrate your grasp of problem• Plan the study in advance, so others can
evaluate the study approach– will it work?– have you overlooked something?– will results be useful to client?– Can we afford it?

Sample Objectives
1. Estimate benefits and costs of program
2. Estimate economic impacts of program on local community (social, environmental, fiscal).
3. Determine effects of program on target population.
4. Describe users and non-users of program
5. Assess community recreation needs, preferences
6. Determine market/financial feasibility of program
7. Evaluate adequacy or performance of program

Methods Choices
• Overall Approach/Design– Qualitative or Quantitative– Primary or secondary data– Survey, experiment, case study, etc.
• Who to study - population, sample– individuals, market segments, populations
• What to study - concepts, measures– behavior, knowledge, attitudes
• Cost vs Benefit of Study

Definition & Measurement
“measurement is the beginning of science, … until you can measure something, your knowledge is meager and unsatisfactory” Lord Kelvin
Nominal/Conceptual Definition - define concept in terms of other concepts, links concepts without tying them to real world
Operational definition - equates definition with measurement, specify procedures/operations to generate the concept.

Levels of Measurement
Level Characteristic Example
Nominal Unorderedcategories
Race, gender
Ordinal Ordered categories Sm, med.lgHardness scale
Interval Consistent distancebetween categories
Temp in fahrenheitor Celsius
Ratio Natural zero Temp in Kelvin

Validity vs Reliability
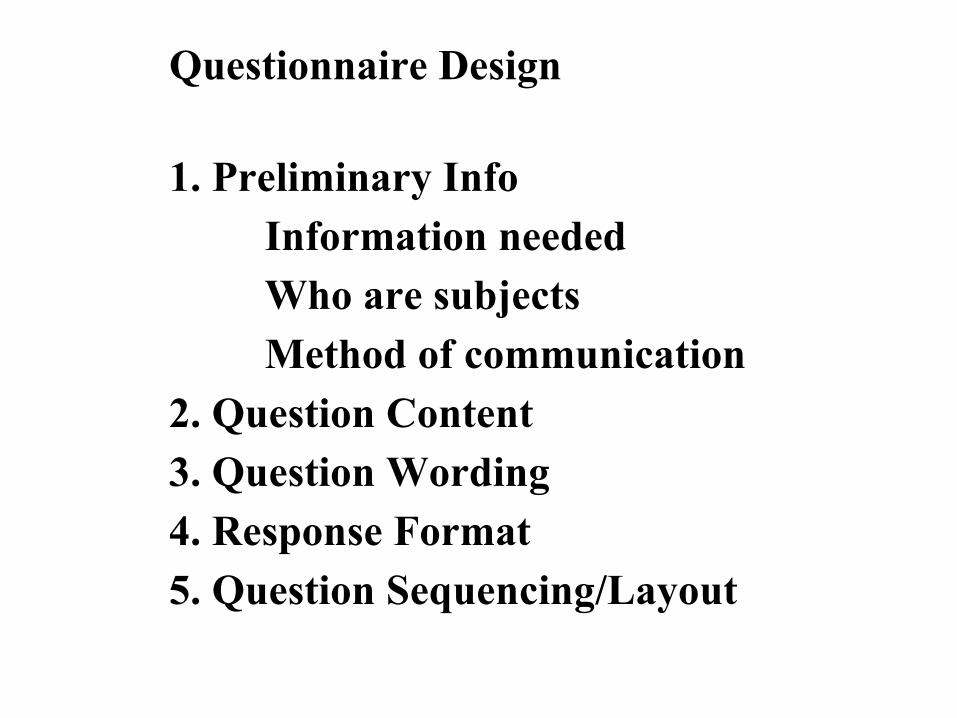
Questionnaire Design
1. Preliminary Info
Information needed
Who are subjects
Method of communication
2. Question Content
3. Question Wording
4. Response Format
5. Question Sequencing/Layout

What Info?
Demographic, Socioeconomic, Physical
Cognitive - Knowledge & beliefs
Affective - attitudes, feelings, preferences
Behavioral - actions

Sampling
• Always define study population first
• Use element/unit/extent/time for complete definition
• element - who is interviewed• sampling unit - basic unit containing elements• extent - limit population (often spatially)• time - fix population in time
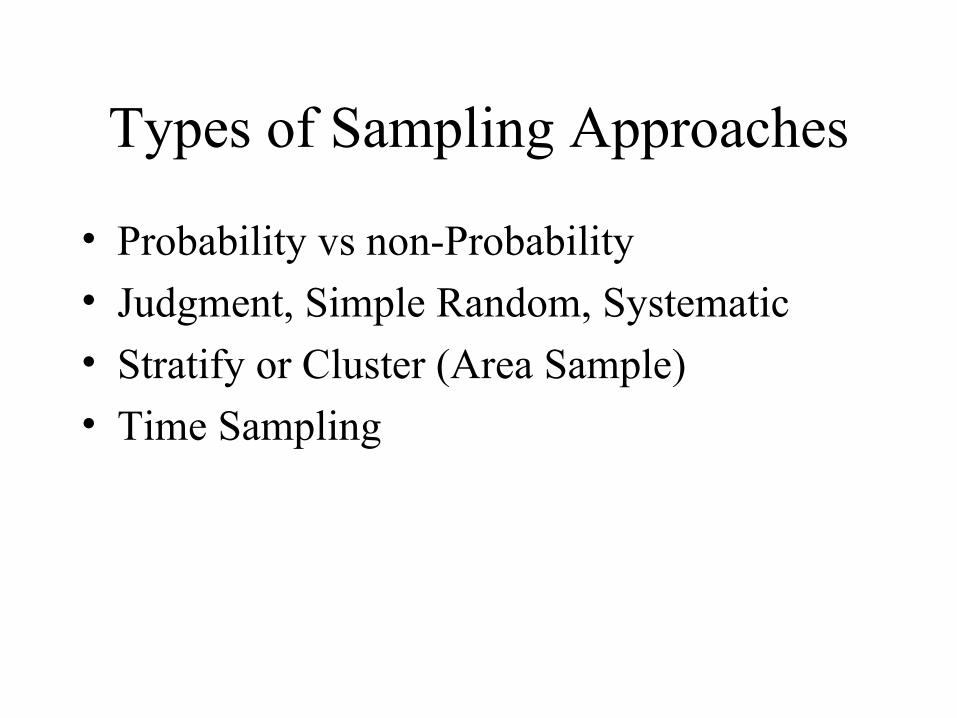
Types of Sampling Approaches
• Probability vs non-Probability
• Judgment, Simple Random, Systematic
• Stratify or Cluster (Area Sample)
• Time Sampling

Sample size
• Based on four factors• Cost/budget• Accuracy desired• variance in popln on variable of interest
• subgroup analysis planned
• Formula: n= Z2 σ2 / e 2
• n= sample size
• Z indicates confidence level (95% = 1.96)
∀ σ = standard deviation of variable in population
• e = sampling error

Sampling errors for binomial (95% confidence interval)
percent distribution in population
Samplesize
50/50 60/40 70/30 80/20 90/10
100 10.0% 9.8% 9.2% 8.0% 6.0%
200 7.1% 6.9% 6.5% 5.7% 4.2%
400 5.0% 4.9% 4.6% 4.0% 3.0%
1000 3.2% 3.1% 2.9% 2.5% 1.9%
1500 2.6% 2.5% 2.4% 2.1% 1.5%
2000 2.2% 2.2% 2.0% 1.8% 1.3%
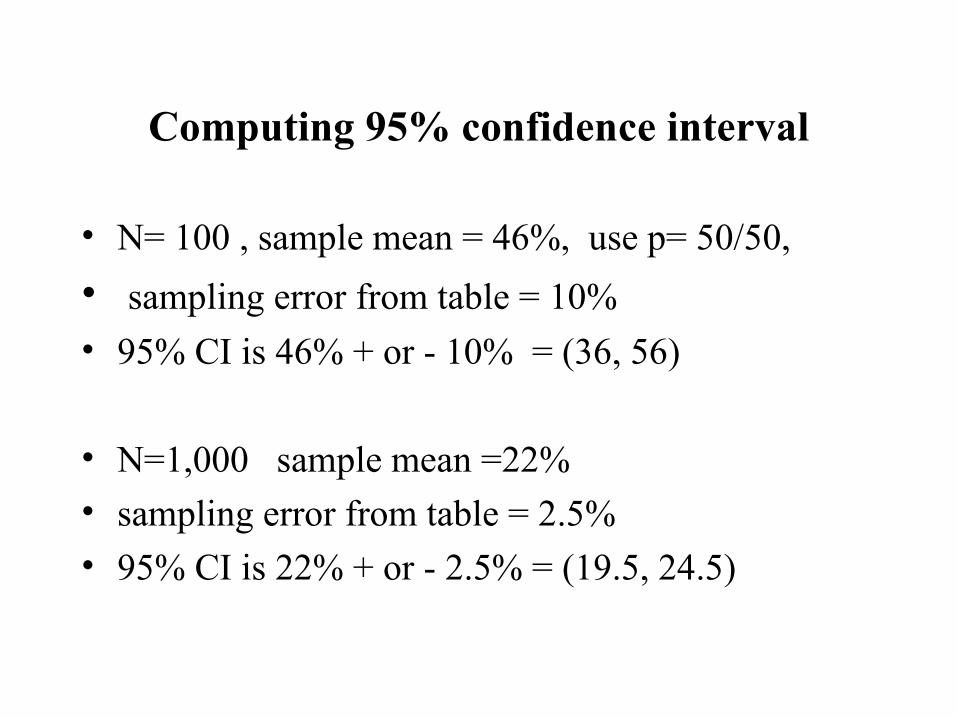
Computing 95% confidence interval
• N= 100 , sample mean = 46%, use p= 50/50,
• sampling error from table = 10%
• 95% CI is 46% + or - 10% = (36, 56)
• N=1,000 sample mean =22%• sampling error from table = 2.5%• 95% CI is 22% + or - 2.5% = (19.5, 24.5)

How ....WhereGathered
Household On-Site Laboratory
PersonalInterview
Surveys Surveys,Field Expmts
Focus Groups
Telephone/Computer
Surveys ComputerInterviews
ComputerInterviews
Self-Admin.Quest.
Surveys,Field Expmts
Experiments
Observation& Traces
NA ObservableCharacteristics
ObservableCharacteristics
SecondarySources
NA InternalRecords
NA
Research Designs/Data Collection Approaches

Major Design Types
• Surveys
• Experiments
• Observation
• Secondary Data
• Qualitative Approaches– Focus Group– Case Study

General Guidelines on when to use different approaches
1. Describing a population - surveys
2. Describing users/visitors - on-site survey
3. Describing non-users, potential users or general population - household survey
4. Describing observable characteristics of visitors - on-site observation
5. Measuring impacts, cause-effect relationships - experiments

Guidelines (cont)
6. Anytime suitable secondary data exists - secondary data
7. Short, simple household studies - phone
8. Captive audience or very interested population - self-administered survey
9. Testing new ideas - experimentation or focus groups
10. In-depth study - in-depth personal interviews, focus groups, case studies
Primary or Secondary Data
• Secondary data are data that were collected for some purpose other than your study, e.g. government records, internal documents, previous surveys
• Choice between Primary /Secondary Data– Costs (time, money, personnel)– Relevance, accuracy, adequacy of data

Qualitative vs Quantitative
Purpose
Perspective
Procedures
Quantitative
Gen’l Laws
Test Hypotheses
Predict behavior
Outsider-Objective
Structured
formal measures
probability samples
statistical analysis
Qualitative
Unique/Individual case
Understanding
Meanings/Intentions
Insider-Subjective
Unstructured
open ended measures
judgement samples
interpretation of data

Qualitative vs Quantitative Approaches
QualitativeFocus GroupIn-Depth InterviewCase StudyParticipant observationSecondary data analysis
QuantitativeSurveysExperimentsStructured observationSecondary data analysis

Survey vs Experiment
Survey - measure things as they are, snapshot of population at one point in time, generally refers to questionnaires
(telephone, self-administered, personal interview)
Experiment - manipulate at least one variable (treatment) to evaluate response, to study cause-effect relationships
(field and lab experiments)

1. Define problem and study objectives
2. Identify information needs & study population(s)
3. Determine basic design/approach
- cross sectional vs longitudinal
- on-site vs household vs other
- self-admin. vs personal interview vs phone
- structured or unstructured questions
4. Questionnaire design
5. Choose sample (frame, size, sampling design)
6. Estimate time, costs, manpower needs, etc.
STEPS IN A SURVEY

7. Proposal & “Human subjects” review
8. Line up necessary resources
9. Pre-test instruments and field procedures
10. Data gathering and follow-up procedures
11. Coding, cleaning and data processing
12. Analysis: preliminary, then final.
13. Communication and presentation of results.
Survey Implementation
Characteristics of a true Experiment
1. Sample equivalent experimental and control groups
2. Isolate and control the treatment
3. Measure the effect

Pre-test/Post-test with Control
R MB1 X MA1 Experimental group
R MB2 MA2 Control group
R denotes random assignment to groups
X denotes the treatment
Measure of effect = ∆ Expmt gp - ∆ Control gp
= (MA1-MB1) - (MA2-MB2)
= with vs without

Threats to Internal validity
• * Pre-measurement (Testing) : effect of pre-measurement on dependent variable (post-test)
• * Selection: nonequivalent experimental & control groups, (statistical regression a special case)
• * History: impact of any other events between pre- and post measures on dependent variable
• * Interaction: alteration of the “effect” due to interaction between treatment & pre-test.
• Maturation: aging of subjects or measurement procedures
• Instrumentation: changes in instruments between pre and post.
• Mortality: loss of some subjects

Economic Evaluation Tools
• Benefit-Cost Analysis
• Cost Effectiveness Analysis
• Financial Analysis/Feasibility
• Fiscal Impact Analysis
• Economic Impact Analysis
• Social/Environmental Impact Analysis

Ethical Issues
• Human Subjects
• Honest and Open Reporting
• Client confidentiality
• No selling

Human Subjects
• Voluntary Participation
• Informed Consent
• Risk-benefit ratio
• Anonymity vs Confidentiality

Research Writing
• Like any writing,– Know audience– Know Story/Message/Subject– Follow Formats for Outlet
• Research Style– Objective, Factual– Impersonal– Dense, concise, logical

Sections
• Abstract – Executive Summary• Introd/Problem statement• Objectives• Lit Review/Background• Methods • Results• Discussion, Implications• References

Three Audiences/styles
• Researchers – research journal style– Technical, methods, statistical tests
• Managers – business style– Results and implications
• Public – newspaper style– Interesting, no jargon, highlights

Research vs Business Reports
• Written/Research– Problem– Objectives– Methods
– Results– Discussion
• Oral/Business– Objectives– Key Results &
Recommendations– Justify from study
– Brief methods– Discussion
Reminders
• Final Exam is Friday Dec 15, 7:45-9:45 am, this room
• Final Papers due by Wednesday Dec 13
• See YaYen Sun to finish lab work by end of week.