Embed Size (px)
Citation preview
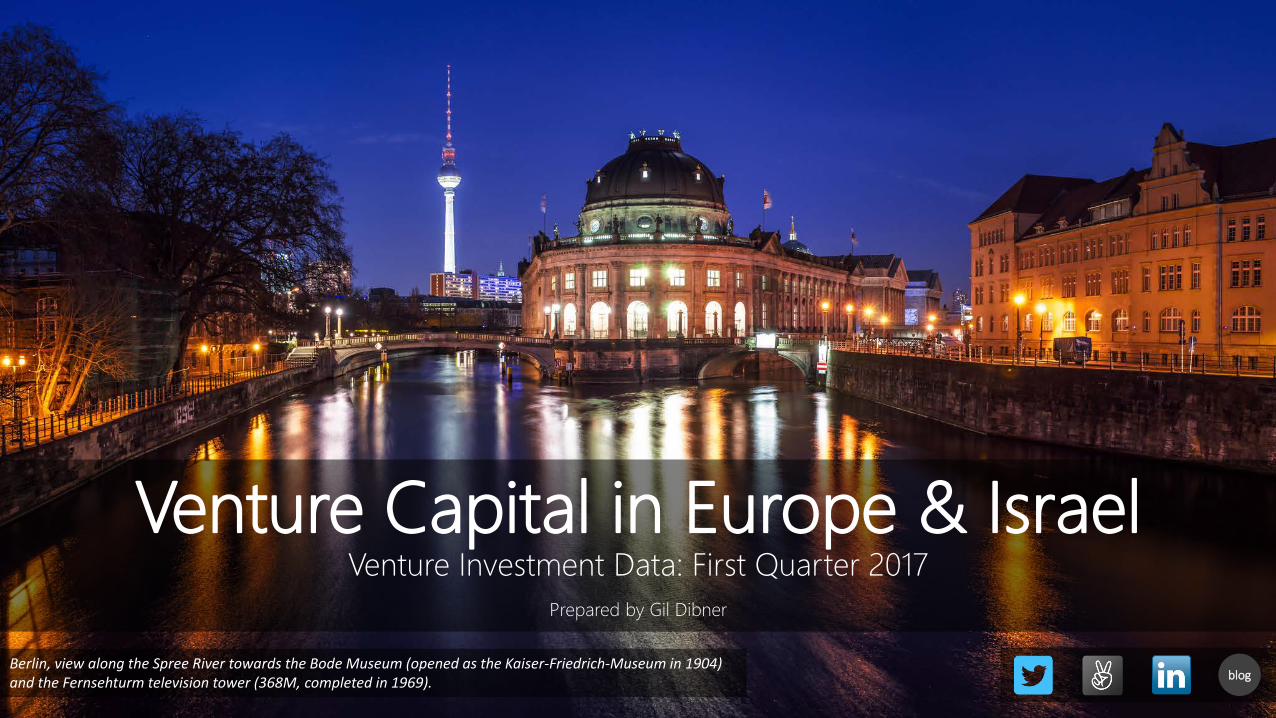
Venture Capital in Europe & IsraelVenture Investment Data: First Quarter 2017
Prepared by Gil Dibner
Berlin, view along the Spree River towards the Bode Museum (opened as the Kaiser-Friedrich-Museum in 1904) and the Fernsehturm television tower (368M, completed in 1969). blog

The data• The data in this report consists entirely of data I’ve gathered manually based on
publicly available, free sources• No paid data sources or API calls were harmed in the making of this dataset, every
investment was manually classified• This allows analysis of some aspects of the data I consider important – aspects that
don’t appear in other data sources. More importantly, it allows me to exclude deals that are really not “venture capital” rounds but tend to get included by others
• Seed investment is under-reported and adds a lot of noise to the data set, so I exclude deals under $500K
• The analysis is limited to ICT categories and excludes life sciences• The analysis excludes Turkey and FSU countries• All currencies converted into USD using monthly average exchange rates
Prepared by Gil Dibner follow me on (@gdibner), connect with me on , subscribe to my , or invest with me onblog 2

Top 10 deals by region in Q1 2017 (US $M)
France & Benelux IsraelIberia
UK & Ireland DACH Nordic
Prepared by Gil Dibner follow me on (@gdibner), connect with me on , subscribe to my , or invest with me onblog 3
15
15
21
24
25
25
26
28
53
100
104
Garrison Technology
Ecrebo
CompareEuropeGroup
Monzo
Evrythng
CurrencyCloud
Upstream
Whistle Sports
Arralis
Funding Circle
Atom Bank
0 50 100 150
16
18
20
22
32
32
53
70
127
165
Ottonova
WayRay
Knime
Book a Tiger
SolarisBank
Raisin
ResearchGate
SoundCloud
Lampenwelt.de
Tricentis
0 50 100 150 200
12
12
12
15
16
17
17
22
26
50
63
Fuse
Qapital
Xeneta
NA-KD
Skeleton Technologies
Pipedrive
Starship Technologies
Soundtrack Your Brand
24 Storage
Collibra
iZettle
0 20 40 60 80
2222234556
1112
175
ApartumMr. Jeff
Subasta de OcioGamelearnRocketROI21 Buttons
HundredroomsRavenPack
FeverOdilo
LogtrustScytl
LetGo
0 50 100 150 200
16
20
23
27
30
35
35
61
69
105
Databerries
Qwant
Bloomon
Doctolib
Bitfury
Guest2Guest
JobToday
Vestiaire…
Oodrive
Picnic
0 20 40 60 80 100 120
2020202020
232525
3030
4056
7075
HealthwatchDemisto
SamanageFeedvisor
VATboxReduxio
ValensFreightOSExabeamAutotalks
Transmit SecurityAppsflyer
SentinelOneKaminario
0 20 40 60 80

Top 10 deals by type in Q1 2017 (US $M)
Systems SaaSEnterprise
Consumer Financial Commerce
Prepared by Gil Dibner follow me on (@gdibner), connect with me on , subscribe to my , or invest with me onblog 4
26
27
28
35
61
70
104
105
127
175
24 Storage
Doctolib
Whistle Sports
Guest2Guest
Vestiaire Collective
SoundCloud
Atom Bank
Picnic
Lampenwelt.de
LetGo
0 50 100 150 200
32
35
40
50
53
56
69
70
75
165
Raisin
JobToday
Transmit Security
Collibra
ResearchGate
Appsflyer
Oodrive
SentinelOne
Kaminario
Tricentis
0 50 100 150 200
14
20
22
24
25
30
32
32
100
104
Earnix
VATbox
Creamfinance
Monzo
CurrencyCloud
Bitfury
SolarisBank
Raisin
Funding Circle
Atom Bank
0 20 40 60 80 100 120
10
12
13
15
16
17
20
53
63
75
Arktis
Famoco
Usound
EasyMile
Skeleton Technologies
Starship Technologies
Healthwatch
Arralis
iZettle
Kaminario
0 20 40 60 80
8
9
11
11
15
21
23
61
105
127
Blue Bay Travel
Restoflash
Campanda
Mycs
NA-KD
CompareEuropeGroup
Bloomon
Vestiaire Collective
Picnic
Lampenwelt.de
0 50 100 150
20
20
20
22
25
25
26
35
50
69
165
Demisto
Knime
Samanage
Soundtrack Your Brand
Evrythng
CurrencyCloud
Upstream
JobToday
Collibra
Oodrive
Tricentis
0 50 100 150 200

Quarterly pace of venture investment
• In 1Q17, Europe & Israel saw $4.0 billion flowing into 521 venture transactions
• 1Q17 was a record-breaking quarter in terms of the number of venture deals
• 1Q17 was the second-highest quarter in terms of amount invested
• These numbers, and the rest of this deck, do not reflect the $1B in debt raised by Spotify in March
Prepared by Gil Dibner follow me on (@gdibner), connect with me on , subscribe to my , or invest with me onblog 52,873
3,139
3,252
2,857
3,730
4,114
3,122
3,522
4,018
0
100
200
300
400
500
600
0
500
1,000
1,500
2,000
2,500
3,000
3,500
4,000
4,500
Qtr1 Qtr2 Qtr3 Qtr4 Qtr1 Qtr2 Qtr3 Qtr4 Qtr1
2015 2016 2017
Amou
nt in
vest
ed (U
S $M
)
VC Investments in Europe & Israel
Invested amount (US $M) Number of investments

Monthly pace of venture investment
• Looked at on a monthly basis, the strong first quarter was driven by a strong January and March
• January was very strong, on par with the previous year –this likely reflects pent up activity from 4Q getting announced publicly in 1Q
• Monthly deal volume throughout the quarter was near the historical ceiling of approximately 180 deals per month across the geography
Prepared by Gil Dibner follow me on (@gdibner), connect with me on , subscribe to my , or invest with me onblog 6
905971997791787
1,5611,518
5711,1641,0841,059
7151,6571,0511,0211,4011,4521,261
7251,1011,2961,4571,170
8951,640
9441,434
0
20
40
60
80
100
120
140
160
180
200
0
200
400
600
800
1,000
1,200
1,400
1,600
1,800
Jan
Feb
Mar
Apr
May Jun Jul
Aug
Sep
Oct
Nov De
cJa
nFe
bM
arAp
rM
ay Jun Jul
Aug
Sep
Oct
Nov De
cJa
nFe
bM
ar
Qtr1 Qtr2 Qtr3 Qtr4 Qtr1 Qtr2 Qtr3 Qtr4 Qtr1
2015 2016 2017
Amou
nt in
vest
ed (U
S $M
)
VC Investments in Europe & Israel(January 2015 - March 2017)
Invested amount (US $M) Number of investments

Mega-rounds skew the investment totals• This analysis breaks down VC
investments into brackets by size:
• Seed (less than $2M)• Early venture ($2-8M)• Venture ($8-20M)• Growth ($20-100M)• Mega ($100M+)
• Six mega-rounds took place in Europe in 1Q17
• Letgo (Spain, $175M)• Tricentis (Austria, $165M)• Lampenwelt (Germany, $127M)• Picnic (Netherlands, $105M)• Atom Bank (IUK, $104M)• Funding Circle (UK, $100M)
• Adjusting for mega-rounds, 1Q17 was a record quarter at $3.24B, just edging out 2Q16 ($3.21B)
Prepared by Gil Dibner follow me on (@gdibner), connect with me on , subscribe to my , or invest with me onblog 7
510 602 635 592 709 751559
730 695 752 651911
1,187
1,650 1,6791,336 1,197
1,366
0
500
1,000
1,500
2,000
2,500
3,000
3,500
4,000
4,500
Qtr4 Qtr1 Qtr2 Qtr3 Qtr4 Qtr1
2015 2016 2017
Amou
nt In
vest
ed (U
S $M
)
Pace of VC Investment in Europe and Israel
Mega (>100) Growth (20-100) Venture (8-20) Early Venture (2-8) Seed (.5-2)

Strong year-over-year growth
• All size brackets except growth saw YoY increases in 1Q17 compared to 1Q16
• Seed deal volume increase by 21%, early venture and venture both increased by 25%, and mega-deal volume increased by 36%
• Growth venture volume decreased by 17%
Prepared by Gil Dibner follow me on (@gdibner), connect with me on , subscribe to my , or invest with me onblog 8
177 215
602 751
730911
1,6501,366
571776
0
500
1,000
1,500
2,000
2,500
3,000
3,500
4,000
4,500
Qtr1 Qtr1
2016 2017
Tota
l VC
inve
stm
ent (
US $
M)
VC investment volume in Europe and Israel by bracket(1Q17 vs 1Q16)
Mega (>100) Growth (20-100) Venture (8-20) Early Venture (2-8) Seed (<2)

Number of investments, by bracket
• Excluding seed deals, the total number of VC investments per quarter was 314 in 1Q17, a new record level since I started tracking this data
Prepared by Gil Dibner follow me on (@gdibner), connect with me on , subscribe to my , or invest with me onblog 9
77 85 94140 153 157 144
182 1934262 44
4661 57 64
5376
3326 38
35
44 5240
35
39
66 4
3
4 41
6
6
0
50
100
150
200
250
300
350
Qtr1 Qtr2 Qtr3 Qtr4 Qtr1 Qtr2 Qtr3 Qtr4 Qtr1
2015 2016 2017
Num
ber o
f VC
inve
stm
ents
VC investment volume in Europe and Israel by bracket
Mega (>100) Growth (20-100) Venture (8-20) Early Venture (2-8)

No impact of Brexit on deal volume, but…
• Looking just at UK VC deal volume, there’s so far no evidence that Brexit caused any slowdown whatsoever in VC activity
• There were an average of 15 VC deals per month in the 18 months before the referendum
• There were an average of 20 VC deals per month since the referendum
Prepared by Gil Dibner follow me on (@gdibner), connect with me on , subscribe to my , or invest with me onblog 10
0
5
10
15
20
25
30
35
Jan
Feb
Mar Ap
rM
ay Jun Jul
Aug
Sep
Oct
Nov De
cJa
nFe
bM
ar Apr
May Jun Jul
Aug
Sep
Oct
Nov De
cJa
nFe
bM
ar
Qtr1 Qtr2 Qtr3 Qtr4 Qtr1 Qtr2 Qtr3 Qtr4 Qtr1
2015 2016 2017
Num
ber o
f VC
inve
stm
ents
VC investment volume in the UK by bracket
Mega (>100) Growth (20-100) Venture (8-20) Early Venture (2-8)
Pre-Brexit
avg = 15
Post-Brexit avg = 20

Total invested capital per quarter is down since Brexit
• Looking just at total invested capital in the UK, there does appear to be an impact since the Brexit referendum
• An average of $819M per quarter was invested in the UK in the 18 months before the referendum
• An average of $648M per quarter was invested in the UK since the referendum
• VC investment volume in the UK is down 21% per quarter since the Brexit referendum
Prepared by Gil Dibner follow me on (@gdibner), connect with me on , subscribe to my , or invest with me onblog 11
74 70 98 79 136 108 133 150 188165 166 96 128
172148
181 113160
459
180405
209
532
273 202191
149
210
150
275478
192
110275
204
0
200
400
600
800
1,000
1,200
Qtr1 Qtr2 Qtr3 Qtr4 Qtr1 Qtr2 Qtr3 Qtr4 Qtr1
2015 2016 2017
Num
ber o
f VC
inve
stm
ents
VC investment volume in the UK by bracket
Mega (>100) Growth (20-100) Venture (8-20) Early Venture (2-8)
Pre-Brexit avg = $819M
Post-Brexit avg = $648M

Corporate VC activity, by bracket
• Excluding seed deals, the total number of corporate VC investments rose to 54 in 1Q17 compared to 44 in 4Q16
• Corporate VC investments are trending towards later stage
Prepared by Gil Dibner follow me on (@gdibner), connect with me on , subscribe to my , or invest with me onblog 12
6 4 516
7
22 19 23 1927 24
43
9
12
7
12
6
1619 5
17
44
7
8
7
720
18
69
11
3
13
3
3
2
0
10
20
30
40
50
60
70
Qtr3 Qtr4 Qtr1 Qtr2 Qtr3 Qtr4 Qtr1 Qtr2 Qtr3 Qtr4 Qtr1
2014 2015 2016 2017
Num
ber o
f VC
inve
stm
ents
Corporate VC investment volume in Europe and Israel by bracket
Mega (>100) Growth (20-100) Venture (8-20) Early Venture (2-8)

Corporate VC activity, by country
• During 1Q17, Israel saw the highest number of corporate VC investments, with 18
• The UK saw 12 corporate VC investments during the quarter
• Germany and France took the third and fourth spots, with 7 and 4, respectively
• Corporate investors participated in two mega-rounds in the geography in the quarter
Prepared by Gil Dibner follow me on (@gdibner), connect with me on , subscribe to my , or invest with me onblog 13
85 4
2
5
43
2
5
2
2
0
2
4
6
8
10
12
14
16
18
20
Isra
el UK
Ger
man
y
Fran
ce
Net
herla
nds
Swed
en
Irela
nd
Pola
nd
Finl
and
Switz
erla
nd
Esto
nia
Italy
Num
ber o
f inv
estm
ents
Number of corporate VC investments in Europe and Israel by bracket(1Q17)
Mega (>100) Growth (20-100) Venture (8-20) Early Venture (2-8)

Average round size• This average excludes seed
rounds and mega rounds, so it reflects all rounds done in Europe & Israel between $2M and $100M
• With very few exceptions, most months saw average round sizes of $10-12M and there is seems to be little pattern other than mean reversion
• 3Q15 is the only systematic outlier to this trend, with average round sizes of $12-15M throughout the quarter
• As the six-month trailing average shows, average round sizes are drifting downward
Prepared by Gil Dibner follow me on (@gdibner), connect with me on , subscribe to my , or invest with me onblog 14
4
6
8
10
12
14
16
18
20
Jul
Aug
Sep
Oct
Nov De
cJa
nFe
bM
ar Apr
May Jun Jul
Aug
Sep
Oct
Nov De
cJa
nFe
bM
ar Apr
May Jun Jul
Aug
Sep
Oct
Nov De
cJa
nFe
bM
ar
Qtr3 Qtr4 Qtr1 Qtr2 Qtr3 Qtr4 Qtr1 Qtr2 Qtr3 Qtr4 Qtr1
2014 2015 2016 2017
Amou
nt In
vest
ed (U
S $M
)
Average investment size in Europe and Israel(Round sizes of 2-100M, and 6-month trailing average)

Total venture investment by country, 1Q 2017
• Israel saw the most VC investment in 1Q17, with $802M raised
• The UK came in second place, with $740M raised
• Germany saw the third-highest amount of venture investment, with $562M
• France was a close fourth, with $550M
Prepared by Gil Dibner follow me on (@gdibner), connect with me on , subscribe to my , or invest with me onblog 15
802
740
562
550
247
235
189
182
104
91
79
50
42
35
33
25
25
13
12
2
2
Israel
UK
Germany
France
Spain
Sweden
Netherlands
Austria
Ireland
Denmark
Switzerland
Estonia
Luxembourg
Belgium
Poland
Italy
Finland
Norway
Cyprus
Czech
Iceland
Total VC investment volume by country, 1Q17 (US $M)

Vive la Frenchtech!Total venture investment by country, 1Q15 to 1Q17
• To get a better sense of VC volumes in various countries, this analysis excludes mega-rounds
• With this filter, volumes and rankings are more consistent
• For the first time, France came in second, leapfrogging ahead of the UK and Germany in one quarter
• Sweden’s steady rise (five quarters of uninterrupted growth) is also worthy of note
• The UK and Germany seem to have levelled out over the past year
Prepared by Gil Dibner follow me on (@gdibner), connect with me on , subscribe to my , or invest with me onblog 16
543475
628699
963
1,064
877
490
802
719
437
625 444
871
553 544487 536
389
209
379342 335
429460
473
435
118
232 279224 279
367339 443
550
89 112
14084
139 151198 224 235
Qtr1 Qtr2 Qtr3 Qtr4 Qtr1 Qtr2 Qtr3 Qtr4 Qtr10
200
400
600
800
1000
1200
Tota
l VC
inve
stm
ent (
US $
M)
Total VC investment, 1Q15 - 1Q17 (top 5 countries, excluding mega-rounds)
IsraelUKGermanyFranceSweden

Total venture investment by country, 3Q14 to 4Q16
• To get a better sense of VC volumes in various countries, this analysis excludes mega-rounds
• The “second five” countries for VC investment in 2016 were Spain, Ireland, the Netherlands, Finland, and Denmark
Prepared by Gil Dibner follow me on (@gdibner), connect with me on , subscribe to my , or invest with me onblog 17
Qtr1 Qtr2 Qtr3 Qtr4 Qtr1 Qtr2 Qtr3 Qtr4 Qtr1
2015 2016 2017
0
20
40
60
80
100
120
140
Tota
l VC
inve
stm
ent (
US $
M)
Total VC investment, 1Q15 - 1Q17(countries ranked 6-10, excluding mega-rounds)
Spain IrelandNetherlands FinlandDenmark

Average venture round sizes, by region
• For a while, I had been seeing a trend towards convergence in the sizes of rounds across the geography
• Into 2017, this trend seems to be holding
• Most regions saw average round sizes flat or slightly down
• Average deal size in Israel is increasing
Prepared by Gil Dibner follow me on (@gdibner), connect with me on , subscribe to my , or invest with me onblog 18
Benelux, 4.7
Benelux, 10.8
DACH, 14.9
DACH, 11.4
France, 8.2 France, 8.1Iberia, 7.2
Iberia, 4.6
Israel, 15.9Israel, 15.2
Nordic, 11.5
Nordic, 9.9UK & Ireland, 8.5
UK & Ireland, 7.8
0.0
2.0
4.0
6.0
8.0
10.0
12.0
14.0
16.0
18.0
Qtr4 Qtr4 Qtr1
2014 2015 2017
Aver
age
roun
d si
ze (U
S $M
)
Average investment size in Europe and Israel (rounds of $2-100M)

Total venture investment by region
• When VC investments across Europe are aggregated into regions, UK & Ireland, DACH, Israel, DACH, and the Nordics are the clear and consistent leaders
• Benelux, Iberia, Southern Europe, and Eastern Europe do produce meaningful VC investments, but the volumes are still low
Prepared by Gil Dibner follow me on (@gdibner), connect with me on , subscribe to my , or invest with me onblog 19
UK & Ireland, 844
DACH, 822
Israel, 802
France, 550Nordic, 415Benelux, 266
Iberia, 247
South. Eur., 37
East. Eur., 35
Total VC investment by region, 1Q17

Rounds by bracket & region
• To get a better sense of deal volume, this analysis excludes seed deals which are often poorly reported
• Excluding seed deals, the UK and Ireland saw 79 venture deals in the fourth quarter
• Israel took third place with 52
Prepared by Gil Dibner follow me on (@gdibner), connect with me on , subscribe to my , or invest with me onblog 20
5245
20 24 25
8 114 4
18
10
18 15 9
3
7
4
146
4
3
0
10
20
30
40
50
60
70
80
90
UK &Ireland
France Israel DACH Nordic Benelux Iberia East. Eur. South. Eur.
Num
ber o
f inv
estm
ents
Number of investments in Europe and Israel by bracket, 1Q 2017
Mega (>100) Growth (20-100) Venture (8-20) Early Venture (2-8)

Participation rate of US VC firms, by bracket
• In the first quarter, US VCs participated in 8% of the VC financing rounds in EU and Israel
• As usual, US VCs are much more likely to participate in later rounds
Prepared by Gil Dibner follow me on (@gdibner), connect with me on , subscribe to my , or invest with me onblog 21
2%5%
20%31% 33%
98% 95%
80%69% 67%
0%
10%
20%
30%
40%
50%
60%
70%
80%
90%
100%
Seed (.5-2) Early Venture (2-8) Venture (8-20) Growth (20-100) Mega (>100)
Perc
enta
ge o
f rou
nds
Did US VC firms participate in European VC rounds? (1Q17)
No Yes
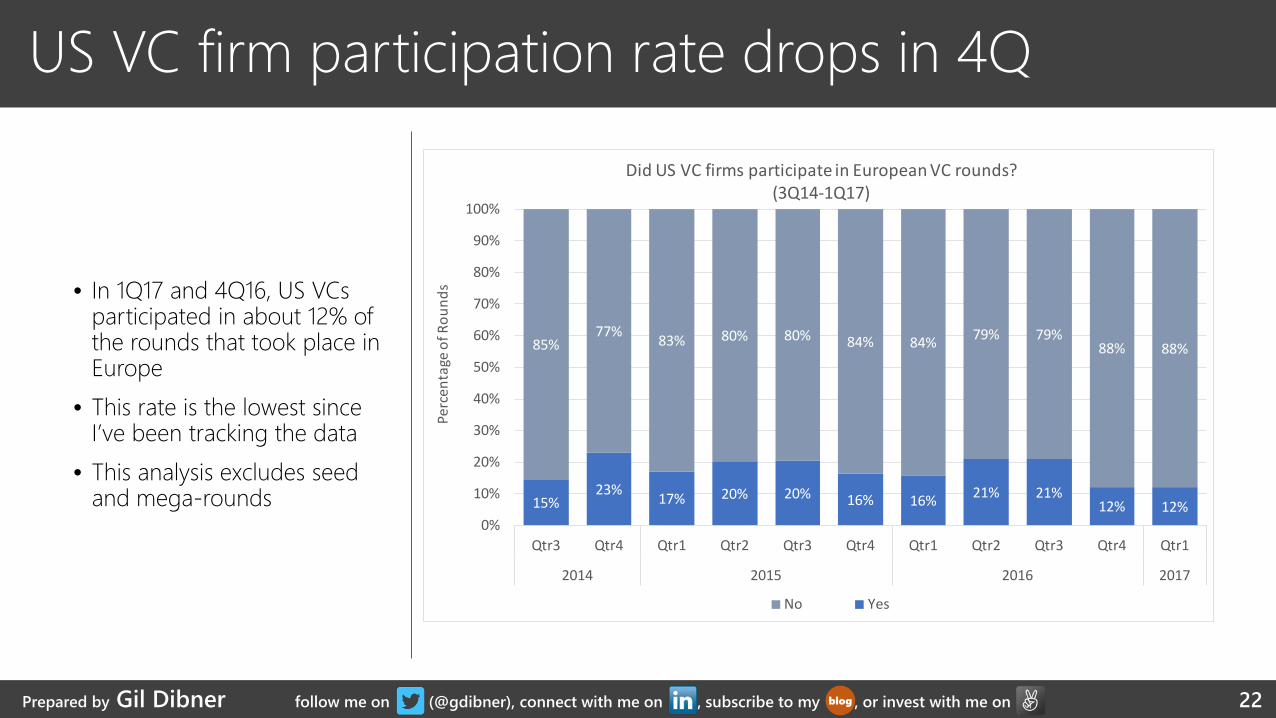
US VC firm participation rate drops in 4Q
• In 1Q17 and 4Q16, US VCs participated in about 12% of the rounds that took place in Europe
• This rate is the lowest since I’ve been tracking the data
• This analysis excludes seed and mega-rounds
Prepared by Gil Dibner follow me on (@gdibner), connect with me on , subscribe to my , or invest with me onblog 22
15%23% 17% 20% 20% 16% 16% 21% 21%
12% 12%
85%77% 83% 80% 80% 84% 84% 79% 79%
88% 88%
0%
10%
20%
30%
40%
50%
60%
70%
80%
90%
100%
Qtr3 Qtr4 Qtr1 Qtr2 Qtr3 Qtr4 Qtr1 Qtr2 Qtr3 Qtr4 Qtr1
2014 2015 2016 2017
Perc
enta
ge o
f Rou
nds
Did US VC firms participate in European VC rounds?(3Q14-1Q17)
No Yes

Participation of US VC firms by country
• In 1Q17, US VCs firms were active in 9 different European countries
• US VC firms were most active in Israel, where they participated in 14 investment rounds
• The UK saw 12 US investments
• US VCs invested in 6 German companies
Prepared by Gil Dibner follow me on (@gdibner), connect with me on , subscribe to my , or invest with me onblog 23
1412
6
2 2 2 2 2 10
2
4
6
8
10
12
14
16
Isra
el UK
Ger
man
y
Esto
nia
Spai
n
Denm
ark
Fran
ce
Irela
nd
Aust
ria
Num
ber o
f VC
inve
stm
ents
Rounds with a US VC involved(1Q17)

Participation of US VC firms by country
• This chart shows US VC activity within Europe
• The overwhelming bulk of US VC activity is generally in Israel, the UK & Ireland, DACH
Prepared by Gil Dibner follow me on (@gdibner), connect with me on , subscribe to my , or invest with me onblog 24
Israel, 12 Israel, 14 Israel, 14 Israel, 14 Israel, 16
Israel, 27 Israel, 25
Israel, 12 Israel, 14
UK & Ireland, 10
UK & Ireland, 14UK & Ireland, 10 UK & Ireland, 8
UK & Ireland, 11
UK & Ireland, 11UK & Ireland, 12
UK & Ireland, 1
UK & Ireland, 14
DACH, 8
DACH, 6
DACH, 4 DACH, 9DACH, 6
DACH, 9 DACH, 8
DACH, 11
DACH, 7Nordic, 2
Nordic, 3
Nordic, 5Nordic, 5
Nordic, 5
Nordic, 4
Nordic, 6
Nordic, 4Iberia, 3
Iberia, 4 Iberia, 3
Iberia, 2
Iberia, 2France, 3
France, 2
France, 2
France, 3 France, 3
France, 2Benelux, 5
Benelux, 2 Benelux, 3
0
10
20
30
40
50
60
Qtr1 Qtr2 Qtr3 Qtr4 Qtr1 Qtr2 Qtr3 Qtr4 Qtr1
2015 2016 2017
Num
ber o
f VC
inve
stm
ents
Investments with US VC participation
Israel UK & Ireland DACH Nordic Iberia France Benelux East. Eur. South. Eur.

Dimension Categories Explanation/Example
1. Target market Consumer, SMB, Enterprise, Government, Telecom, OEM
What sort of customer does the company target?
2. Vertical marketAdtech, Communications, Data, Development, Durables, Education, Electronics, Employment, Energy, Fashion, Financial, Food, Gaming, Health, HMI, Industrial, Infrastructure, Lifestyle, Logistics, Marketing, Media, Productivity, Real Estate, Security, Sports, Storage, Transportation, Travel, Water
What type of problem does the company solve?
3. Business modelCommerce, Components, Content, Marketplace, SaaS, Semiconductors, Services, Software, Systems,
How does the company makemoney? How is value delivered to customers? What are customers paying for?
For example: Consumer + Travel + Marketplace AirBnB has built a travel-related marketplace for consumers
Three-dimensional approach to sector mapping
Prepared by Gil Dibner follow me on (@gdibner), connect with me on , subscribe to my , or invest with me onblog 25

• Excluding mega-rounds, investment activity was flat in consumer but increased in enterprise
What target markets are attracting the most VC investment in Europe & Israel?
Prepared by Gil Dibner follow me on (@gdibner), connect with me on , subscribe to my , or invest with me onblog 26
980 8501,177
931 1,076 1,244 1,097 1,004 1,017
953804
9101,110
1,6541,640
1,269962
1,636
275
224
270
285
182150
163 187
219448
254
0
500
1,000
1,500
2,000
2,500
3,000
3,500
Qtr1 Qtr2 Qtr3 Qtr4 Qtr1 Qtr2 Qtr3 Qtr4 Qtr1
2015 2016 2017
Tota
l VC
inve
stm
ents
(US $
M)
European & Israeli venture financing by target market3Q14 to 1Q17 (excluding mega-rounds, US $M)
Agriculture
Government
Telecom
OEM
SMB
Enterprise
Consumer

• When Israel is excluded from the sample, 46% of all VC dollars in Europe went to consumer-oriented companies
• Enterprise and SMB categories spiked in 1Q17
Consumer investment leads Europe
Prepared by Gil Dibner follow me on (@gdibner), connect with me on , subscribe to my , or invest with me onblog 27
62%
36%
56% 63% 62% 57% 53% 58% 52%45% 46%
18%
48%
34% 22% 24% 31% 35%33%
32%
29%36%
6%10% 4% 12% 8% 6% 5% 3%
7%
8%
12%5%4% 2% 4% 5% 6% 5% 8%
10%
5%6% 6%8%
0%
10%
20%
30%
40%
50%
60%
70%
80%
90%
100%
Qtr3 Qtr4 Qtr1 Qtr2 Qtr3 Qtr4 Qtr1 Qtr2 Qtr3 Qtr4 Qtr1
2014 2015 2016 2017
European venture financing by target market3Q14 to 1Q17 (excluding Israel, percent of US $M)
Agriculture Government Telecom OEM SMB Enterprise Consumer

Breakdown by region & target market
• Regional differences are very apparent when VC investment are categorized by target market
Prepared by Gil Dibner follow me on (@gdibner), connect with me on , subscribe to my , or invest with me onblog 28
355 338
56
249121 144
212
278 336
641 242
163 105
133 88
52
100
74 4897
0
100
200
300
400
500
600
700
800
900
UK &Ireland
DACH Israel France Nordic Benelux Iberia South.Eur.
East. Eur.
Tota
l am
ount
inve
sted
(US $
M)
Investment in Europe and Israel by target market by region2017 (US $M)
Agriculture Government Telecom OEM SMB Enterprise Consumer

Distribution of investment rounds by country
• Across Europe & Israel, 42% of VC investment rounds were in consumer companies in 2016
• Over two-thirds of Israeli venture investments were into enterprise companies
• Three quarters of VC investments in Iberia were into consumer companies
Prepared by Gil Dibner follow me on (@gdibner), connect with me on , subscribe to my , or invest with me onblog 29
74%
69%
46%
42%
42%
42%
28%
16%
19%
25%
38%
26%
36%
42%
48%
69%
12%
21%
13%
8%
4%
6%
10%
8%
7%
4%
11%
7%
12% 4%
0% 10% 20% 30% 40% 50% 60% 70% 80% 90% 100%
Iberia
South. Eur.
France
DACH
Nordic
UK & Ireland
Benelux
Israel
Investment in Europe and Israel by target market by country1Q17 (Number of investments)
Consumer Enterprise SMB OEM Telecom Government Agriculture

Growth rounds by target market
• Enterprise companies accounted for just over half of the later-stage market in Europe & Israel in 1Q17
Prepared by Gil Dibner follow me on (@gdibner), connect with me on , subscribe to my , or invest with me onblog 30
56%
37%46%
56%43% 39% 38% 43% 44%
34% 36%
25%
41%
46% 25%38% 50% 50%
50% 44%
32%
51%
6% 7%
5%
9% 12%3% 6% 5%
12%
7%6% 11% 6% 7% 5% 6% 5% 5%20%
7%
0%
10%
20%
30%
40%
50%
60%
70%
80%
90%
100%
Qtr3 Qtr4 Qtr1 Qtr2 Qtr3 Qtr4 Qtr1 Qtr2 Qtr3 Qtr4 Qtr1
2014 2015 2016 2017
Investment in Europe and Israel by target market(Rounds over $20M, number of investments)
Government Telecom OEM SMB Enterprise Consumer

• Fintech was the most popular vertical across Europe & Israel, with 62 investments in the category
• Lifestyle (a catchall category for consumer commerce) was the second most popular vertical, with 35
Finance returned to being the top vertical
Prepared by Gil Dibner follow me on (@gdibner), connect with me on , subscribe to my , or invest with me onblog 31
55
66
88
999
1111
121212121212
1313
1618
1919
2224
2528
3031
3562
ProductivityHMI
IndustrialAgtech
CommunicationsLegal
Real EstateERP
SocialCRM
EntertainmentDevelopment
EnergyTravel
AutomotiveGaming
FoodPayments
LogisticsFashionAdtech
EducationData
HealthSecurity
ElectronicsEmployment
MarketingInfrastructure
LifestyleFinancial
European & Israeli venture financing by target market1Q17 (top 30 categories, number of investments)

• This graph shows the change in the number of investments by vertical from 1Q17 to 1Q16
• Lifestyle e-commerce, fashion, health, infrastructure, and electronics increased the most in frequency
• Logistics, CRM, and Industrial saw the biggest declines
Growth rates by vertical
Prepared by Gil Dibner follow me on (@gdibner), connect with me on , subscribe to my , or invest with me onblog 32
Industrial, -65%CRM, -45%
Logistics, -28%Development, -14%
Marketing, -9%Gaming, -8%
Food, -8%Security, 4%
Payments, 8%Energy, 9%
Grand Total, 11%Financial, 19%Adtech, 20%
Data, 27%Employment, 27%
Electronics, 32%Infrastructure, 35%
Health, 38%Fashion, 45%
Lifestyle, 67%
-80% -60% -40% -20% 0% 20% 40% 60% 80%
Change in the number of venture investments(1Q17 vs 1Q16, 20 most popular categories)

• Finance was once again the most frequently funded vertical, but with increased attention to enterprise and SMB
• Consumer lifestyle companies took second place
• Infrastructure jumped to third place
• Marketing dropped from third to fourth
Which verticals for which segments?
Prepared by Gil Dibner follow me on (@gdibner), connect with me on , subscribe to my , or invest with me onblog 33
Data
Education
Health
Security
Electronics
Employment
Marketing
Infrastructure
Lifestyle
Financial
0 10 20 30 40 50 60 70
European & Israeli venture financing by target market1Q17 (number of investments, top 10 verticals)
Consumer
Enterprise
SMB
OEM
Telecom
Government

• This chart shows the ten most commonly funded verticals across Europe & Israel by quarter
The most popular verticals in the past 2 years
Prepared by Gil Dibner follow me on (@gdibner), connect with me on , subscribe to my , or invest with me onblog 34
Qtr3 Qtr4 Qtr1 Qtr2 Qtr3 Qtr4 Qtr1 Qtr2 Qtr3 Qtr4 Qtr1
2014 2015 2016 2017
0
50
100
150
200
250
300
350
European & Israeli venture financing by vertical market(number of investments, top 10 verticals)
Adtech
Health
Logistics
Electronics
Lifestyle
Employment
Security
Infrastructure
Marketing
Financial

• Investors continue to favor financial, lifestyle, and health investments
• Education and fashion bounced back
• Logistics (ride sharing, taxi hailing, and the like) appears to be played out
• Food and travel seem to be in decline
Consumer VC investment trends
Prepared by Gil Dibner follow me on (@gdibner), connect with me on , subscribe to my , or invest with me onblog 35
Qtr3 Qtr4 Qtr1 Qtr2 Qtr3 Qtr4 Qtr1 Qtr2 Qtr3 Qtr4 Qtr1
2014 2015 2016 2017
0
20
40
60
80
100
120
140
160
180
European & Israeli venture financing by consumer verticals(number of investments, top 10 verticals)
Travel
Health
Fashion
Food
Electronics
Logistics
Gaming
Lifestyle
Financial
Education

• Security, financial, and HR/employment-related technology showing increases in 1Q17
• CRM and industrial declined in 1Q17
Enterprise VC investment trends
Prepared by Gil Dibner follow me on (@gdibner), connect with me on , subscribe to my , or invest with me onblog 36
Qtr3 Qtr4 Qtr1 Qtr2 Qtr3 Qtr4 Qtr1 Qtr2 Qtr3 Qtr4 Qtr1
2014 2015 2016 2017
0
20
40
60
80
100
120
140
160
180
European & Israeli venture financing by enterprise verticals(number of investments, top 10 verticals)
CRM
Financial
Industrial
Employment
Development
Data
Infrastructure
Adtech
Security
Marketing

• SaaS was the most funded business model in 1Q17, representing 27% of all VC dollars
• Services took 22% of the venture dollars invested in Europe & Israel
• Systems – complete physical products – took fourth place at 11% of all venture dollars
• Marketplaces – businesses that serve a price discovery function – rebounded to 9%
SaaS above all (but keep an eye on systems)
Prepared by Gil Dibner follow me on (@gdibner), connect with me on , subscribe to my , or invest with me onblog 37
SaaS, 887, 27%
Services, 721, 22%
Software, 457, 14%
Systems, 364, 11%Marketplace, 299, 9%
Commerce, 244, 8%
Media, 153, 5%
Semiconductors, 55, 2%
Components, 52, 2%
Materials, 11, 0%
European & Israeli venture financing by target market1Q17 (in US $M) (excluding mega-rounds)

• SaaS and Services remained the top two business models by funding volume
• Commerce collapsed from third place in 4Q16 to sixth place in 1Q17
• Systems maintained their fourth place ranking
• Marketplaces rebounded somewhat
Commerce disappears and systems rise
Prepared by Gil Dibner follow me on (@gdibner), connect with me on , subscribe to my , or invest with me onblog 38
0
200
400
600
800
1000
1200
Qtr3 Qtr4 Qtr1 Qtr2 Qtr3 Qtr4 Qtr1 Qtr2 Qtr3 Qtr4 Qtr1
2014 2015 2016 2017
European & Israeli venture financing by business model(top seven, in US $M, excluding mega-rounds)
Services
SaaS
Software
Commerce
Marketplace
Systems
Media

• This graph provides a quick overview of the ten most commonly funded segments across the top ten countries for those segments
• In a nutshell:• Consumer financial services
(Everywhere, but especially in the UK)
• UK marketing SaaS• Israeli enterprise security
software• French infrastructure SaaS• French adtech services• UK enterprise financial SaaS• French consumer electronics• And some other stuff….
EU+IL VC Cheat Sheet (1Q17)
Prepared by Gil Dibner follow me on (@gdibner), connect with me on , subscribe to my , or invest with me onblog 39
0 5 10 15 20 25 30 35
Consumer Education Services
Consumer Electronics Systems
Enterprise Financial SaaS
Enterprise Adtech Services
Enterprise Infrastructure SaaS
Consumer Fashion Commerce
Enterprise Data SaaS
Consumer Lifestyle Commerce
Enterprise Security Software
Enterprise Marketing SaaS
Consumer Financial Services
Number of VC investments
Investment in Europe & Israel by segment by country1Q17 (top 10 segments, top 10 countries)
UK FranceIsrael SwedenGermany IrelandSpain SwitzerlandPoland Italy

Focus on Infrastructure
• 1Q17 saw a dramatic rise in the number of infrastructure-oriented investments across Europe and Israel
• A lot of this had to do with a spike in activity in France
Prepared by Gil Dibner follow me on (@gdibner), connect with me on , subscribe to my , or invest with me onblog 40
0
5
10
15
20
25
30
Qtr3 Qtr4 Qtr1 Qtr2 Qtr3 Qtr4 Qtr1 Qtr2 Qtr3 Qtr4 Qtr1
2014 2015 2016 2017
Num
nber
of i
nves
tmen
ts
Infastructure - VC investment in Europe and Israel
Latvia Iceland Portugal Luxembourg GreeceDenmark Italy Poland Norway BelgiumIreland Netherlands Finland Switzerland Spain

Focus on Fashion
• 1Q17 also saw a spike in the number of fashion-oriented investments across Europe and Israel
• Activity in France, Italy, the UK, and Sweden was the main driver here
Prepared by Gil Dibner follow me on (@gdibner), connect with me on , subscribe to my , or invest with me onblog 41
0
2
4
6
8
10
12
14
16
18
Qtr3 Qtr4 Qtr1 Qtr2 Qtr3 Qtr4 Qtr1 Qtr2 Qtr3 Qtr4 Qtr1
2014 2015 2016 2017
Num
nber
of i
nves
tmen
ts
Fashion - VC investment in Europe and Israel
Greece Portugal Denmark Switzerland Lithuania Finland Netherlands
Italy Israel Sweden Spain France Germany UK

Based in , I was previously a partner at . Before that, I helped run the
European seed program for . I moved to London after seven years in
during which I worked as a VC with and . I’m originally from .
My VC investments include and . Angel investments include and many more.
If you found this useful, I hope you’ll subscribe to my blog.42
Gil Dibner
To invest in the best European & Israeli enterprise startups,
consider backing me on here. Lots of exciting stuff in thepipeline – and you’ll be in pretty good company.