Embed Size (px)
Citation preview

Preesented by
Rohit U. Bharati
T.Y. B. Pharm.
GUIDE
Ms. Vandana T. Gawande
M.Pharm. (Q.A.)
DATE : 21st March 2012 TIME : 02 : 45 p.m.
1

Sr. No. Particulars
1 AIM & OBJECTIVES
2 INTRODUCTION
3 SELECTION OF DRUG
4 DRUG PROFILE
5 DEVELOPMENT OF ASSAY METHOD
6 VALIDATION METHODS
7 OBSERVATION
8 CONCLUSION
9 BIBLIOGRAPHY
2

Part A: To developed analytical (UV) method for determination of TOPIRAMATE in bulk and in oral solid dosage form.
Part B: To validate developed method as per ICH guidelines for following parameters:
a) Accuracy
b) Precision
d) Linearity and Range
e) Limit of Detection
f) Limit of Quantitation
g) Robustness
3

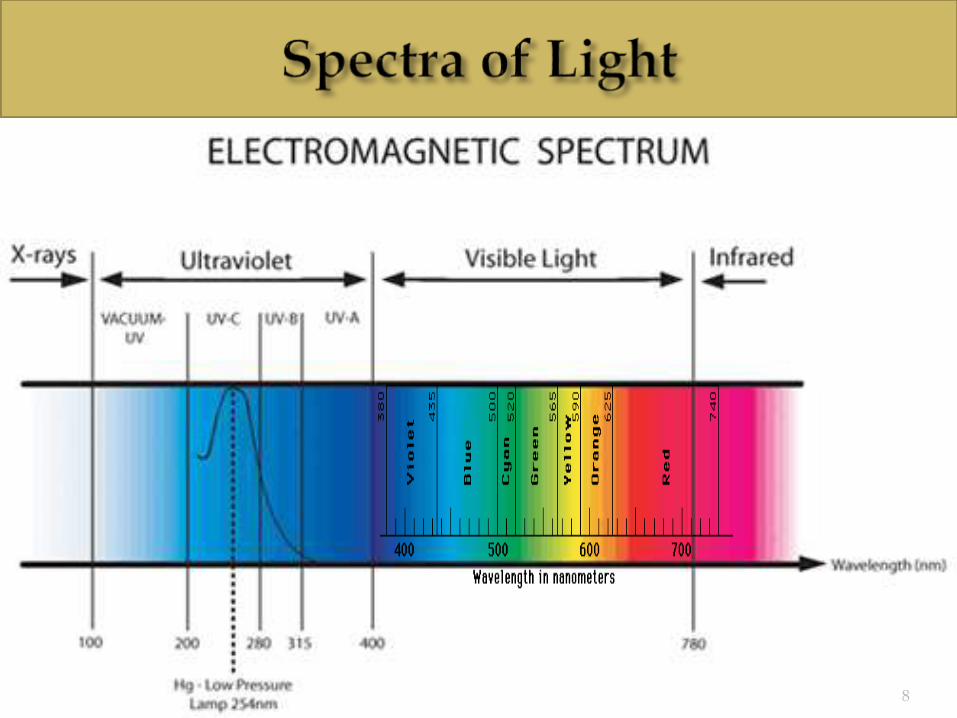
COLORIMETRY
It is the science & technology used to quantify & describe physically the Human color perception.
4

INSTRUMENTATION
5

6

7
8

1. Drugs which not have strong UV absorbance.
2. Drugs for which Colorimetric methods are not
available.
3. Drugs for which methods are available but they are
time consuming & complex.
Eg. Dicloxacillin, Topiramate etc.
9

TOPIRAMATE
Chemical Name 2, 3, 4, 5-bis-o-(1-methylidene)-betaD-fructopyranose sulfamate
Solubility freely soluble in acetone, chloroform
and ethanol. water it is 9.8 mg/ml.
Its saturated solution has a pH of 6.3.
Category Anticonvulsant & Antimigraine Drug
10

1. Preparation of std. stock solution.
2. Development of colour.
3. Selection of analytical wavelength.
4. selection of analytical concentration Range.
11

10 mg of topiramate + distilled water
Ultrasonicated (10 min. )
Vol. adjusted with Distilled water
(upto 10ml)
concentration 1mg/ml 12

Dilutions of topiramate in Distilled water + 1ml 10% pyridine solution + 1ml 2% ninhydrin solution
20 mins.
Cooling at R.T.
violet color
spectra taken (λ =568nm)
13

Spectra Of Colour Complex
14

1. LINEARITY
2. ACCURACY
3. PRECISION
4. LIMIT OF DETECTION (L.O.D.)
5. LIMIT OF QUANTIFICATION (L.O.Q.)
6. RANGE
7. ROBUSTNESS15

16

y = 0.0019x + 0.2184R² = 0.9963
0
0.1
0.2
0.3
0.4
0.5
0.6
0.7
0.8
0.9
0 50 100 150 200 250 300 350
Abs.
abs
Linear (abs)
Conc.
Conc. (µg/ml) Absorption
50 0.2999
100 0.413
150 0.5072
250 0.6988
300 0.7679
Fig. Calibration Curve for TOPIRAMATE at 568 nm
Table : Linearity of TOPIRAMATE AT 568 nm
17

Level of recovery
Conc. Of drug
Amt. added
absorbance amt.recovered
% recovery
80 0.32 0.4 0.5613 0.321 80.47
80 0.32 0.4 0.5595 0.318 79.50
80 0.32 0.4 0.5599 0.319 79.75
100 0.4 0.4 0.6004 0.404 101.00
100 0.4 0.4 0.5998 0.402 100.50
100 0.4 0.4 0.5988 0.400 100.00
120 0.48 0.4 0.6365 0.480 120.00
120 0.48 0.4 0.6366 0.480 120.00
120 0.48 0.4 0.6370 0.481 120.25
Table: Statistical treatment of Recovery data for TOPIRAMATE
18

Parameters Level of recovery Level of recovery Level of recovery
80% 100% 120%
Concentration added
(μg/ml)
0.32 0.4 0.48
Mean of Absorbance
0.5602 0.5996 0.6367
Mean Conc.
Recovered (μg/ml)
0.319 0.402 0.480
Mean % recovery
79.90 100.66 120.15
% RSD0.4785 0.4975 0.1201
Table: Recovery studies of TOPIRAMATE
19

System precision :
Replicate Absorbance of TOPI
1 0.4383
2 0.4256
3 0.4204
4 0.4185
5 0.4130
6 0.4231
Mean 0.42315
SD 0.008576
% RSD 1.99
Table: System precision for TOPIRAMATE
20

Conc.
(µg/ml)
Absorbance Mean Std dev % RSD
Trial 1 Trial 2 Trial 3
100 0.4886 0.4658 0.4557 0.4767 0.00182 0.3826
150 0.4919 0.4779 0.4740 0.4812 0.00941 1.9550
250 0.5855 0.5782 0.5722 0.5786 0.00666 1.1509
Table: Intra-day variability for TOPIRAMATE
21

Conc.
(µg/ml)
Absorbance Mean Std dev % RSD
Day 1 Day 2 Day 3
100 0.4923 0.4687 0.4476 0.4695 0.00476 0.476
150 0.5019 0.4799 0.4777 0.5547 0.00133 0.275
250 0.5995 0.5812 0.5811 0.5872 0.00105 0.180
Table: Inter-day variability of TOPIRAMATE
22

Limit of Detection (LOD)- 1.823 μg/ ml
3.3 σ
S
Limit of Quantification (LOQ)- 5.52 μg/ ml
10 σ
S
Range- 50 - 300 μg/ ml
23

24

A. Analysis of tablet
Conc. Of drug (µg) Absorbance Amt. added µg/ml
Amt. found in %
100 0.4254 0.4 98.95
100 0.4320 0.4 102.02
100 0.4251 0.4 98.80
100 0.4292 0.4 100.76
100 0.4329 0.4 102.05
100 0.4331 0.4 102.01
25
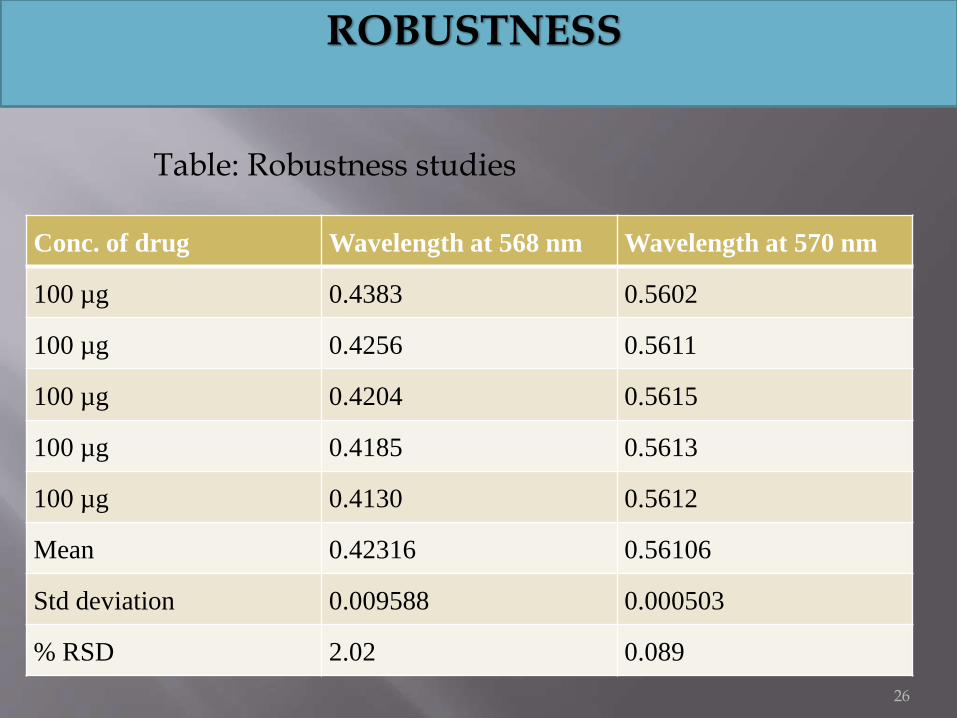
Conc. of drug Wavelength at 568 nm Wavelength at 570 nm
100 µg 0.4383 0.5602
100 µg 0.4256 0.5611
100 µg 0.4204 0.5615
100 µg 0.4185 0.5613
100 µg 0.4130 0.5612
Mean 0.42316 0.56106
Std deviation 0.009588 0.000503
% RSD 2.02 0.089
ROBUSTNESS
Table: Robustness studies
26

1. Colorimetric method was developed and validated as per ICH
guidelines for estimation of Topiramate in tablets.
2. Development of color is by reaction of amino group of drug
with Ninhydrin reagent in presence of pyridine.
3. The method was found to be simple, accurate, precise and
specific.
So, the proposed method can be used for the routine quality
control analysis of the bulk drug as well as oral dosage forms.
Parameters Result
Linearity > 0.99
% Recovery 98 – 102 %
% RSD < 2
27

1. Davidson, A.G., (2002), Ultraviolet-Visible absorption spectrophotometry, In; Beckett,
A.H., Stenlake, J.B., Practical pharmaceutical chemistry, 4 th edi., Part-II, CBS
Publishers and Distributors, New Delhi, 278- 82.
2. USP 24/ NF 19,The United states pharmacopoeia 24 and National formulary 19,
(2000), the United States Pharmacopoeial Convention, Rockville, 1767-69.
3. National Organization for Drug Control and Research, 6 Abou Hazem Street,
Pyramids Ave, P.O.Box 29 Giza, `Egypt. (NODCAR)
Nahla Nour El-Din Ahmed Salama* et al /International Journal Of Pharmacy.
4. Sanket S.D.1*, Madhuri V. G.1, Shilpa V.1, Mahesh M.D.2, Vikas V.G. International
Journal of Pharmaceutical Sciences and Nanotechnology, Volume 2 Issue 4 January –
March 2010
5. Davidson,A.G.(2002),Ultraviolet-Visible-absorption spectrophotometry, In; Beckett,
A.H., Stenlake, J.B., Practical pharmaceutical chemistry, 4 th edi., Part-II, CBS
Publishers and Distributors, New Delhi, 275- 78
28

29


![Combination of Topiramate and Empagliflozin is Considered ... · no increase in frequency in urinary tract infections [18]. Topiramate is a drug used for the treatment of convulsions](https://img.dokumen.tips/doc/110x75/60de63197e12ee0ef01d28a6/combination-of-topiramate-and-empagliflozin-is-considered-no-increase-in-frequency.jpg)


![Bharti Telecom Performance Appraisal in Bharti Telecom[1]](https://img.dokumen.tips/doc/110x75/547f3ee15806b5b35e8b47d6/bharti-telecom-performance-appraisal-in-bharti-telecom1.jpg)