Embed Size (px)
Citation preview

for Water & Wastewater National IssueWinter 2012/2013
Esri News
ArcGIS for Valve Exercise Program: One Utility’s How-to GuideBy Tim Hayes and Kent Brown, City of San Jose, California, Environmental Services Department
Isolation valves are among the most important assets of any water or
wastewater utility. They are critical to operations. Typically, utilities ex-
ercise valves every two to three years, although some utilities exercise
them more or less frequently. For the City of San Jose Environmental
Services Department’s recycled water utility valve exercise program,
the objectives included building a valve feature class in the geodata-
base and integrating high-accuracy GPS with valve exercise data. To
meet the objective of developing a valve maintenance prioritization
scheme, staff members used ArcGIS.
Maintenance staff can select any isolation valve from the map and obtain key information.
GPS and Valve Data CollectionThe field equipment included a GPS receiver, valve exercise data
logger, and valve exercise machine. It was important that the same
valve ID was entered into both the receiver and the data logger, since
these two sets of data would later be joined in the geodatabase.
To achieve the highest level of GPS accuracy, an external GPS anten-
na was used along with the receiver. In this situation, it was important
continued on page 10

Winter 2012/2013
Esri News for Water & Wastewater is a publication of the Water/Wastewater Group of Esri.To contact the Esri Desktop Order Center, call 1-800-447-9778 within the United States or 909-793-2853, ext. 1-1235, outside the United States.
Visit the Esri website at esri.com.
View Esri News for Water & Wastewater online at esri.com/waterwrites or scan the code below with your smartphone.
Advertise with UsE-mail [email protected].
Submit ContentTo submit articles for publication in Esri News for Water & Wastewater, contact Lori Armstrong, industry solutions manager, at [email protected] or Jessica Wyland, editor, at [email protected].
Manage Your SubscriptionTo update your mailing address or subscribe or unsubscribe to Esri publications, visit esri.com/publications.
International customers should contact an Esri distributor to manage their subscriptions.
For a directory of distributors, visit esri.com/distributors.
Circulation ServicesFor back issues, missed issues, and other circulation services, e-mail [email protected]; call 909-793-2853, extension 2778; or fax 909-798-0560.
2 Esri News for Water & Wastewater Winter 2012/2013
ContentsCover
1 ArcGIS for Valve Exercise Program: One Utility’s How-to Guide
3 Thank You to Our 2012 Water/Wastewater Sponsors!
Case Study
4 Managing Inflow and Infiltration to Comply with a Consent Decree
8 City of Woodland Refines Water Crew Dispatch
Partner Corner
11 IBM Intelligent Water
The information contained in this work is the exclusive property of Esri or its licensors. This work is protected under United States copyright law and other international copyright treaties and conventions. No part of this work may be reproduced or transmitted in any form or by any means, electronic or mechanical, including photocopying and recording, or by any information storage or retrieval system, except as expressly permitted in writing by Esri. All requests should be sent to Attention: Contracts and Legal Services Manager, Esri, 380 New York Street, Redlands, CA 92373-8100 USA.
The information contained in this work is subject to change without notice.
The Geographic Advantage, Esri, the Esri globe logo, 3D Analyst, ArcAtlas, ArcCatalog, ArcData, ArcDoc, ArcEditor, ArcExplorer, ArcGIS, the ArcGIS logo, ArcGlobe, ArcIMS, ARC/INFO, ArcInfo, ArcLogistics, ArcMap, ArcNetwork, ArcNews, ArcObjects, ArcPad, ArcPress, ArcReader, ArcSDE, ArcSurvey, ArcToolbox, ArcTools, ArcUser, ArcView, ArcVoyager, ArcWatch, ArcWeb, ArcWorld, ArcXML, Business Analyst Online, BusinessMAP, CommunityInfo, EDN, Geography Network, GIS Day, MapData, MapObjects, Maplex, MapStudio, ModelBuild-er, MOLE, NetEngine, RouteMAP, SDE, Sourcebook•America, StreetMap, Tapestry, @esri.com, esri.com, arcgis.com, geographynetwork.com, gis.com, and gisday.com are trademarks, service marks, or registered marks of Esri in the United States, the European Community, or certain other jurisdictions.
Other companies and products or services mentioned herein may be trademarks, service marks, or registered marks of their respective mark owners.
Copyright © 2013 Esri.All rights reserved. Printed in the United States of America.

Steel Level -------------------------------------------------------------------------------------------------------------------------------------------------------------------------------------------------------------------------------------
Cast Iron Level ------------------------------------------------------------------------------------------------------------------------------------------------------------------------------------------------------------------------
Concrete Level ------------------------------------------------------------------------------------------------------------------------------------------------------------------------------------------------------------------------
PVC Level -------------------------------------------------------------------------------------------------------------------------------------------------------------------------------------------------------------------------------------------
Thank You to Our 2012Water/Wastewater Sponsors!
Bergmann Associates Black & Veatch Corp. Cityworks l Azteca GEOCOM Informatik Innovyze
iWater Lucity Marshall Merrick PennWell
RouteSmart Nobel Systems TC Technology Wachs Water Services
Esri is grateful to the sponsors of the 2012 Water/Wastewater Pool
Party held July 25 during the Esri International User Conference at
the Hilton Bayfront Pool Terrace. The event was a great opportunity
for the water, wastewater, and stormwater ArcGIS user community to
get together, have a few laughs, and talk shop. We all enjoyed food,
refreshments, and live music made possible by our sponsors. Thank you!
3Winter 2012/2013 esri.com/waterwrites

Managing Inflow and Infiltration to Comply with a Consent DecreeBy Jerry Biedenbender, SD1
Sanitation District Number 1 (SD1) is a regional sewer utility that serves
three of the northernmost counties in Kentucky. SD1 is responsible
for the collection and treatment of northern Kentucky’s wastewater as
well as regional stormwater management. As the second largest public
sewer utility in Kentucky, SD1 serves approximately 220 square miles,
including more than 30 municipalities and unincorporated portions of
Boone, Campbell, and Kenton counties.
SD1 maintains more than 1,600 miles of sanitary sewer line,
142 wastewater pumping stations, 15 flood pump stations, 8 package
treatment plants, 3 major wastewater treatment plants, more than
400 miles of storm sewer, and over 29,000 storm sewer structures.
A manhole overflows due to I&I when it rains.
In 2005, SD1, with state and federal environmental regulators,
entered into the Clean Water Act consent decree, a legally binding
document outlining an accelerated program of activities designed to
further improve water quality, address overflows that generally occur
during wet weather, and ensure compliance with the act. The settle-
ment, negotiated by the US Environmental Protection Agency (EPA),
Kentucky’s Environmental and Public Protection Cabinet, and SD1, calls
for a 20-year plan to improve the area’s waterways by addressing raw
sewage overflows from the combined and separated sewer systems
within the district’s service area.
continued on page 6
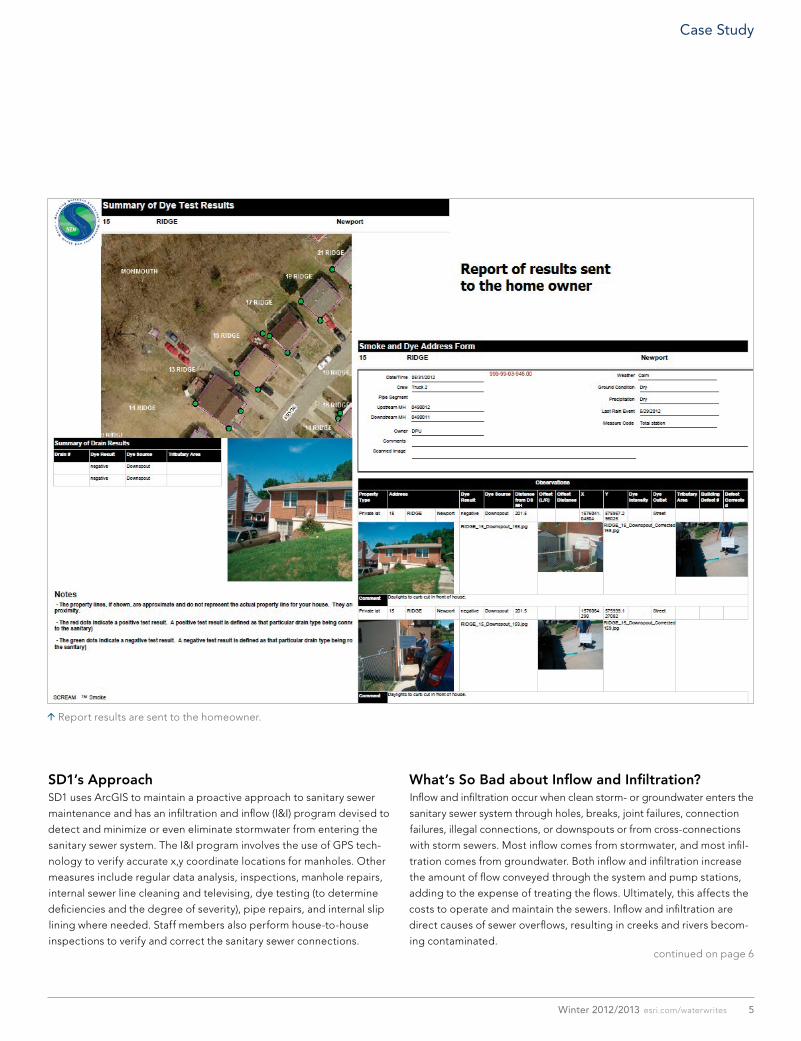
Report results are sent to the homeowner.
SD1’s ApproachSD1 uses ArcGIS to maintain a proactive approach to sanitary sewer
maintenance and has an infiltration and inflow (I&I) program devised to
detect and minimize or even eliminate stormwater from entering the
sanitary sewer system. The I&I program involves the use of GPS tech-
nology to verify accurate x,y coordinate locations for manholes. Other
measures include regular data analysis, inspections, manhole repairs,
internal sewer line cleaning and televising, dye testing (to determine
deficiencies and the degree of severity), pipe repairs, and internal slip
lining where needed. Staff members also perform house-to-house
inspections to verify and correct the sanitary sewer connections.
What’s So Bad about Inflow and Infiltration?Inflow and infiltration occur when clean storm- or groundwater enters the
sanitary sewer system through holes, breaks, joint failures, connection
failures, illegal connections, or downspouts or from cross-connections
with storm sewers. Most inflow comes from stormwater, and most infil-
tration comes from groundwater. Both inflow and infiltration increase
the amount of flow conveyed through the system and pump stations,
adding to the expense of treating the flows. Ultimately, this affects the
costs to operate and maintain the sewers. Inflow and infiltration are
direct causes of sewer overflows, resulting in creeks and rivers becom-
ing contaminated.
5Winter 2012/2013 esri.com/waterwrites
Case Study

Managing Inflow and Infiltration to Comply with a Consent Decree continued from page 5
I&I Elimination WorkflowSix of the 11 steps for detecting and eliminating inflow and
infiltration require the use of GIS. The trace tool helps deter-
mine the scope of the project and is utilized in the planning
process phase.
Once the project area has been established, a GIS analyst
heads to the field with a Trimble GeoExplorer 6000 series
GPS unit running ArcGIS to collect precise locations for all
sanitary structures within the area. The GPS unit is capable of
achieving accuracy of less than a decimeter. Without accurate
locations, the dye testing crews would risk wasting time look-
ing for manholes or recording test results on the wrong assets.
The dye testing crews also use ArcGIS in their TV truck to
digitize the testing locations at the point where the dye exits
either onto the ground or into the storm system or, illegally,
the sanitary system. All this data is then synchronized via
ArcGIS, analyzed, and used for running reports and creat-
ing maps. In cases where there are illegal connections, the
homeowners are given the opportunity to correct them. After
that, crews perform a retest to verify the fix is sufficient, and
then the data in ArcGIS is updated. A visual representation explains the different causes of I&I. The testing photos are linked to assets being tested.
Esri International User Conference
You are GIS.You gain knowledge, share expertise, and help us understand our world.
There’s a place where GIS goes beyond coordinates, breaks free of categories, and reaches past analysis. A place where products are launched, ideas are shared, and inspiration is set loose.
Join us at the Esri UC. Register today at esri.com/ucutilities.
United we map!Esri International User ConferenceJuly 8–12, 2013 | San Diego Convention Center
G56545_EsriNews4Utilities-UC13_2-13.indd 1 2/19/13 12:49 PM

Follow the Esri Water Community on TwitterKeep up with the latest GIS news—especially as it relates to the water/wastewater industry—by following Esri on Twitter: • Esri Water Team—@esriteamwater • Lori Armstrong, Esri water industry solutions manager—
Twitter.com/Lori_Armstrong
Access the Water Utilities Resource CenterThis website is for the ArcGIS water, wastewater, and stormwater utility community. It provides useful templates and best practice information, enabling users to implement ArcGIS to manage water utility information, perform daily operations, and support long-term planning. Visit resources.esri.com/waterutilities.
Join a Discussion about How GIS Meets Today’s ChallengesPull up a virtual chair at the Spatial Roundtable and join the conversation of GIS thought leaders as they address topics requested by the geospatial community: www.spatialroundtable.com.
Esri Online
Case Study
I&I elimination workflow: GIS inputs are represented by the faded orange boxes.
Custom GIS ToolA custom GIS tool was created to automate the process of
exporting maps and results. When this tool is activated, the
user is prompted to choose a project area. All parcels within
the project area will have a JPEG file exported at a specific
extent and labeled with the property identification number
(PIDN). The PIDN is a unique number that allows the JPEG file
to be linked to a SQL Server service report that is exported as
a PDF and sent to the homeowner.
For more information, contactJerry Biedenbender [email protected].
7Winter 2012/2013 esri.com/waterwrites

8 Esri News for Water & Wastewater Winter 2012/2013
those trips. But when Woodland began to notice a steady increase in
the number of residents failing to pay for water service, which often
requires multiple visits per address, improving staff response to water
payment delinquency seemed in order.
Convinced that geospatial technology could create a better system,
Daniel Hewitt, GIS specialist for the City of Woodland, applied an
ArcGIS solution from Esri. “It wasn’t just a matter of turning off the
water, mission accomplished,” says Hewitt. “Three out of four times,
the bill gets paid and crews must revisit the residence to turn the water
back on—sometimes within the same day. Being a GIS guy, I knew a
geography-focused application would help solve this.”
To respond to water bill nonpayment, the City of Woodland Finance
Department creates driver manifests for the water crews. With so much
doubling back, drivers had no time to think about their lists spatially
and logistically. “Our system consisted of nothing more than the
finance guys handing crews an Excel file with a randomly organized
list of addresses that required shutoff,” says Hewitt. “Even with an
understanding of the local geography, they could not always respond
nearest to farthest, which would obviously make the most sense in
terms of vehicle wear and tear and fuel consumption.”
City of Woodland Refines Water Crew DispatchGIS-Based Route Sequencing Gives City Leverage in Contractor BiddingBy Matthew DeMeritt, Esri Writer
Today, decreasing budgets and volatile gas prices have forced govern-
ments to closely evaluate their fleet deployment practices. Even small
local government fleets can log enough miles to justify routing software
to save fuel and vehicle wear and tear. Last year, the City of Woodland,
California, concluded that dispatching crews to shut off water for non-
payment of services (one of the city’s most fuel-consuming operations)
could be easily improved with an electronic routing system.
With a population of 55,000 and relatively small footprint, Woodland
has crews that know the pavement well. Since a portion of the work
orders entail only single visits to homes (e.g., to turn off water service
in a vacated residence), dispatchers don’t need to generate routes for
The City of Woodland generates optimized water shutoff routes from simple Excel spreadsheet data.
“Contractors give us a bid on what they think all their driving will add up to in replacing these meters.”Daniel Hewitt, GIS specialist for the City of Woodland

Team Water/Wastewater MeetingFebruary 22–23, 2013Louisville Water CompanyLouisville, Kentucky, USAesri.com/Industries/water/community/team-water
Rural Water Association of Arizona Annual Technical ConferenceMarch 5–7, 2013Chandler, Arizona, USArwaa.info/
American Water Works Association Utility Management ConferenceMarch 10–13, 2013Glendale, Arizona, USAwww.wef.org/UtilityManagement2013/
California-Nevada Section, American Water Works Association Spring ConferenceMarch 25–28, 2013Las Vegas, Nevada, USAca-nv-awwa.org/CANV/web/events/SC/web/events /sc13.aspx
New Mexico Rural Water Association Annual ConferenceApril 15–18, 2013Albuquerque, New Mexico, USAwww.nmrwa.org/conference.php
Wasser BerlinApril 23–26, 2013Berlin, Germanywww.wasser-berlin.de/en/
Association of California Water Agencies Spring Conference and ExhibitionMay 7–10, 2013Sacramento, California, USAwww.acwa.com/events/2013-spring-conference-exhibition
Aquatech ChinaJune 5–7, 2013Shanghai, Chinawww.aquatechtrade.com/china
American Water Works Association Annual Conference and Exposition (AWWA ACE)June 9–13, 2013Denver, Colorado, USAwww.awwa.org/ACE13
Team Water/Wastewater MeetingJuly 6, 2013San Diego, California, USAesri.com/Industries/water/community/team-water
Esri International User ConferenceJuly 8–12, 2013San Diego, California, USAesri.com/uc
On the Road
9Winter 2012/2013 esri.com/waterwrites
Case Study
Easy TransitionArcGIS allowed Hewitt to import the Excel lists of nonpaying resi-
dences that the Finance Department generated and create an ordered
list of stops. To communicate with the geodatabase, the software
requires that Excel spreadsheets have columns denoting city and state.
“I added those columns to the spreadsheets so I could feed them
into the system,” says Hewitt. “From there, the program generated
sequenced, turn-by-turn routes for water crews.”
Hewitt took his findings to Manuel Soto, technology services
manager in Woodland’s Public Works Department, to see if he could
get support to acquire Esri’s route optimization technology. Initially,
the department questioned whether precise routing in a small city
with a staff of mostly Woodland natives was even needed. To address
that concern, Hewitt used maps to show that sequencing the stops
from nearest to farthest was more critical than the routing. “The main
problem we had was lots of unnecessary backtracking,” says Soto.
The ArcGIS route optimization solution created a sequenced order
of stops from a simple address list. After clarifying the specific benefit,
Soto got approval from the Public Works Department to purchase the
technology the department needed. Soon afterward, Woodland began
officially implementing the solution.
The new efficiency in creating ordered driver manifests has reduced
the number of crews needing to travel. Before acquiring its new routing
software, Woodland sent out an average of eight water crew vehicles
per day. Today, five vehicles can do the same amount of work. GIS
helped the City of Woodland refine its fleet scheduling practices and
reap dividends in fuel and labor savings.
Bonus BenefitWoodland also found a novel use for its GIS as a bargaining tool for
outsourcing. Recently, the city hired a contractor to replace thousands
of faulty water meters with more accurate, tamper-proof meters.
“Contractors give us a bid on what they think all their driving will add
up to in replacing these meters,” says Hewitt. “We showed them how
sequencing their stops shortens travel, which helps them calculate a
more appropriate cost.”
For more information, contact DanielHewitt, GIS specialist, City of Woodland,at [email protected].

Valve Feature ClassIn the Valve feature class, the following fields were included: • Valve ID: A unique identifier • Type: Possible values of Gate Valve or Butterfly Valve • Class: Piping on which the valve is located, populated with
one of the following values: Main, Lateral, Blind Flange, Pump Station, Reservoir, Air Relief, or Blowoff
• Condition: The condition of the valve at the time of exercise • Priority: A value of 1–3, 1 being the highest priority for valve
replacement • Manufacturer: The name of the company that manufactured
the valve • Model: The valve model name • Torque Chart: A hyperlink to the torque chart • Date of Exercise: The date the valve was exercised • ID of Valve Operator: The name or ID of the person who
exercised the valve • Exerciser Model: The type or name of the valve exercise
machine used • Position: The position of the valve at the start of exercise • Torque Units: The units of measure used during exercising,
usually in pounds per square foot • Torque Used: The amount of torque used during the exercise
of each valve • Begin Time: Time exercise began • End Time: Time exercise ended • Diameter: Diameter of valve • Diameter Units: The diameter units, usually inches • Number of Turns: The number of turns for each valve • Operation Direction: The direction in which the valve is
operated (clockwise or counterclockwise) • Install Date: The date valve was installed (This can also be the
replacement date.) • GPS Northing: The GPS northing coordinates of the valve • GPS Easting: The GPS easting coordinates of the valve • GPS Correction Type: Values including whether the GPS data
was collected in real time or postprocessed • GPS Receiver Used: The type/make/model of the GPS receiver
used • GPS Horizontal Accuracy: The horizontal accuracy of the valve
GPS coordinates
to ensure that the antenna was as close as possible to the actuator that
turns the valve.
The GPS antenna was mounted to the external frame of the valve
exercise machine, and the GPS receiver was mounted inside the truck
and linked to the antenna via coaxial cable. The advantage was that
operators did not need to carry their receiver each time they exited
their truck, preventing it from being dropped or otherwise damaged.
In addition, this removed one more step in an otherwise repetitive pro-
cess. The operator simply positioned the valve exercise actuator over
the valve and then activated the GPS receiver and the valve machine at
the same time.
Data Analysis and PrioritizationA two-step process was used to prioritize which valves were to be
replaced. First, the Condition field was populated with one of four
values obtained from the valve exercise data: I = inoperable, DR = low/
high turn to diameter ratio, Z = zero turns, and ATC = abnormal torque
charts.
The second step was to compare the Class field values with the
values in the Condition field. Then, the Priority field was populated
by setting the valves’ priority on a 1–3 scale, with 1 being the highest
priority: 1 = valves located on mains, laterals equal to or greater than
6 inches in diameter, pump stations, and reservoirs; 2 = valves located
on laterals smaller than 6 inches in diameter; and 3 = valves located on
blowoffs, air reliefs, and blind flanges.
Finishing UpThe final step in the process was to ensure that the maintenance staff
had access to this data in an easily understood format that required a
minimum of training and time. The best solution was to use the existing
Flex map viewer with ArcGIS for Server. This allows maintenance staff
to select any isolation valve from the map and obtain key information
related to the valve exercise, for example, valve ID, diameter, number
of turns, manufacturer, and torque chart.
For more information, contact Tim Hayes at [email protected].
ArcGIS for Valve Exercise Program: One Utility’s How-to Guide continued from cover
10 Esri News for Water & Wastewater Winter 2012/2013

IBM Intelligent Water
Water Stress Is EverywhereWater is one of the world’s most abundant substances. However, it is
also fast becoming one of the planet’s most stressed resources. Access
to clean water is a critical issue that affects economic activity, develop-
ment, and business around the world. Increasing regulatory pressures,
climate change, aging work forces, failing infrastructures, and a grow-
ing focus on social responsibility and environmental risk management
are forcing organizations to reassess the impact water management
has on their economic well-being.
Gain Insights from Rain to DrainAs water and wastewater management challenges and costs continue
to increase, information technology and collaborative innovation play
a vital role in helping communities, businesses, and governments deal
with complex water issues. The combination of new instrumentation
and skyrocketing data volumes, new data types, and the demand
for real-time responses requires a new kind of water management
intelligence. Current systems are generally stand-alone and limited in
scalability, which inhibits effective decision making across departments
and throughout organizations. Smarter water management systems
need to provide an integrated operating picture with robust real-time
analytics, modeling, and decision support capabilities.
The IBM Intelligent Water solution is designed to optimize water op-
erations and create new opportunities for innovation and business value
by delivering integrated insights into a utility’s infrastructure, assets,
and operations. The solution uses advanced data management, visu-
alization, correlation, and collaboration technologies to transform the
vast amounts of disparate data (received from various devices, including
metering systems) on assets, systems, and stakeholders into actionable
information that can guide executive and operational decisions.
The IBM Intelligent Water solution employs an Esri map in its user
interface. The Esri map can be either authoritative content from a local
customer implementation of ArcGIS or a map service from ArcGIS
Online. In addition, the water infrastructure network analysis capabil-
ity of the IBM solution, which prioritizes maintenance, is driven by the
ArcGIS Network Analyst for Server extension.
An End-to-End View of Operations The Intelligent Water solution helps operations and infrastructure
become more reliable and efficient. It integrates and analyzes a wide
variety of data sources and both provides an intuitive way of visualizing
and understanding patterns and anomalies and makes it easy to act on
them. The result is a view of water or wastewater operations that tran-
scends individual systems, devices, and departments. This end-to-end
view provides the key information needed to make better decisions
that help lower costs and risk while increasing or recapturing revenue
and enhancing customer satisfaction.
The Intelligent Water solution helps water and wastewater operators
leverage operational data holistically to create insights and improve
water management, anticipate potential delivery disruption, better
forecast long-term water demand, coordinate resources to protect
water supply, and drive conservation and sustainability.
Building on Intelligent Operations
Intelligent Water includes the IBM Intelligent Operations for Water
product, a water management platform that enhances infrastructure
visibility to deliver an advanced level of situational awareness,
event and incident management, informed decision making, and
collaboration among stakeholders. IBM Intelligent Operations for
Water helps on many fronts: • Combined sewer overflow mitigation • Water conservation and smart metering • Smarter irrigation for parks and golf courses • Water and wastewater situational awareness and quality management • Pressure and leak management • Urban flood management • Work scheduling optimization
IBM Intelligent Water is available in a variety of deployment options.
The software can reside in a data center, or for utilities and cities with
limited IT infrastructure or resources that prefer a subscription service
model, the solution is also available on the IBM SmartCloud.
For more information and to contact IBM, visit www.ibm.com/software/industry /intelligent-water.
Partner Corner

Presorted Standard
US Postage Paid Esri
380 New York Street Redlands, California 92373-8100 usa
30-day free trial: esri.com/agol
Creating your own map from maps published by other users is just one of many ways to take
advantage of the rich collection of data and resources ArcGISSM
Online makes available to you.
Welcome to the new frontier in geographic information systems.
ArcGIS Online
Copyright © 2012 Esri. All rights reserved.
30-day free trial: esri.com/agol
Creating your own map from maps published by other users is just one of many ways to take
advantage of the rich collection of data and resources ArcGISSM
Online makes available to you.
Welcome to the new frontier in geographic information systems.
ArcGIS Online
Maps made better.(Some assembly required.)
Copyright © 2012 Esri. All rights reserved.
133176 QUAD160M2/13tk