Embed Size (px)
Citation preview

ENERGY OPTIMIZATION OF PUBLIC AND SOCIAL HOUSING
BUILDINGS USING ICT BASED- SERVICES
J. Ciprianoa, S. Danova
aCIMNE, Building Energy and Environment Group, UPC Campus Terrassa Edi�ci GAIA (TR14) C/ RamblaSant Nebridi 22 08222 Terrassa, Spain
Abstract
Occupants' behavior, building control and energy optimization are strongly correlated and need aholistic scienti�c approach to study them. Answering this question is the main focus of this work.Some experiences in public buildings and social housing will also be presented and some indicationson how these drawbacks can be overcome will be proposed. Energy optimization strategies areanalyzed. These are mainly based on providing useful Energy Awareness Services and EnergyManagement Services supported by monitoring and, in some cases with automation, which mayreduce the random behavior of occupant to manageable levels. The research will focus on two typesof buildings: residential buildings and public buildings. The research plan covers the aspects ofde�ning the ICT based energy management services to be o�ered, the architecture de�nition of thesystems, de�nition of the methodology to evaluate energy savings and user behaviour changes andthe analysis of the achieved outputs of pilot buildings in real operation conditions.
Keywords: Optimization in buildings energy e�ciency,
1. Introduction
Energy optimization of existing buildings requires a combination of several technologies, analysistechniques, and holistic consultancy approaches which can be enhanced and strengthened with theexisting wide variety of ICT based technologies. However, once they are implemented in buildingoperation, many doubts about the level of automation, the end users interaction and how theenergy performance characterization and simulation models can be integrated appear and remainstill unsolved. There are three main approaches to set up optimization strategies based on ICT:occupant-centered user awareness and management strategy; fully automated strategy with minimaloccupant interaction; automatic control with improved logic through simulation and user modeling.
The �rst approach has been put in practice in recent year through many European innovativeprojects, funded by the ICT-PSP innovation program. These projects have been facing the rollingout of ICT based services for improving energy awareness and management in public and socialhousing buildings. Some of the achieved energy savings outputs are summarized in the eeMeasureweb portal1. In the majority of these projects, the energy optimization strategy is performed basedexclusively on user interaction. The deployed services are usually made up of a combination ofweb or smart phone visual interfaces and personalized advice services (energy coach,telephone call,alarms, personalized tips...). They are classi�ed as Energy Awareness Services (EAS) for thoseservices o�ered to tenants or sta� personnel, and as Energy Management Services (EMS), for those
Email addresses: [email protected] (J. Cipriano), [email protected] (S. Danov)1http://eemeasure.smartspaces.eu/eemeasure/.
Preprint submitted to Elsevier June 13, 2013

services o�ered to technical sta� or energy managers. In these service process models, integration ofpredictive energy modeling as well as building energy performance modeling is possible. However,at present, very few pilot sites implemented them as a support for their ICT based services. InCatalonia, the company INERGY2 performed a program of energy consumption reduction based on�low cost� measures in 24 public schools of the City of Girona. This program allowed a comparisonbetween energy management models based exclusively on user awareness models (through monthlyenergy billing information) and automated control models based on remote control of the heatingboilers. Large data scattering was detected in the comparative results and the conclusions were thatthis is probably related to occupants' behaviour. These projects do not represent a comprehensiveinventory of actions across Europe, instead, they collectively represent a range of strategies aimingat demonstrating that occupant-centred control systems, based on advanced ICT components andsystems, can contribute directly to reducing both the peak-consumption and energy demand.
The second approach focuses more on exploiting the degrees of freedom of fully automatedcontrol systems for the sake of optimizing energy e�ciency. In [1], for instance, three di�erentapproaches of combination of simulation and automated controls without human interaction areexamined and their advantages and disadvantages are analysed. More recently, in the projectSEEMPubs3 monitoring and energy management systems for buildings are developed and applied[2]. They are made up of a combination of automated control with dynamic building simulations tooptimize the control logic. In this research, a control strategy was implemented in pilot buildingsand, once it was under operation, some di�erences between the achieved energy savings and theexpected ones were observed and some conclusion about the impact of the occupants' behaviour inthese discrepancies were highlighted.
The third approach combines energy performance building simulation with ICT based systems.In this approach it is important to consider that many previous studies demonstrated a large gapbetween simulated and measured building energy use. Signi�cant discrepancies between simulatedand measured building energy use were found in several studies [3, 4, 5, 6, 7]. One of the mainreasons, identi�ed in Annex 534, for the di�erence is neglecting or over-simplifying the in�uenceof occupants' behaviour (OB). Meanwhile OB acts in a stochastic way, and varies by time andoccupant. There are signi�cant interactions between the occupant the buildings and the ICTbased control systems. The occupants' expectation of comfort or satisfaction with the buildingenvironment drives the occupant to perform di�erent controls, such as adjusting the thermostat inspaces, opening windows for ventilation, turning on lights, pulling down the window blinds, andconsuming domestic hot water. Di�erent occupants' behaviors have di�erent e�ects on buildingperformance and energy use. The building performance, on the other hand, will have economic,physiological and psychological impacts on occupants' expectations.
From these projects and studies, some evidence showed that building energy consumption is notonly be a�ected by technology employed in buildings, but also by many other factors. Among thesefactors, occupants' behavior and interaction with the ICT based control systems takes an extremelyimportant role. Measured building energy use data [8, 9]demonstrated that some buildings withadvanced building control technology (based on automated ICT services) consumed more energythan others with conventional or �low-cost� technology. One of the most important reasons isthe di�erence in occupants' behavior and how they in�uence energy consumption through theiruse of di�erent equipment in the building, as stated by [10, 11]. Correctly understanding theinteractions between OB and building controls is critical to optimize energy e�ciency in buildings.Di�erent customers need di�erent ICT based solutions, and di�erent ICT based solutions may a�ect
2www.inergybcn.com3http://seempubs.polito.it/4http://www.ecbcsa53.org/
2

or change customers' behavior in buildings. The e�ciency level of building control technologiesis important, but what is more important is the e�ective interaction between occupant and thebuilding equipment to meet occupants' comfort and health needs and to avoid continuing complains.This last aspect is many times underestimated and, as demonstrated by [12], there is a high potentialof integrating within ICT based control systems, some methods to properly collect and answeroccupants' complaints and to use them as a tool for permanent diagnosing of what goes wrong inbuildings.
Therefore, occupants' behavior, building control and energy optimization are strongly correlatedand need a holistic scienti�c approach to study them. Answering this question is the main focusof this work. Some experiences in public buildings and social housing will also be presented andsome indications on how these drawbacks can be overcome will be proposed. Energy optimizationstrategies are analyzed. These are mainly based on providing useful EAS and EMS supported bymonitoring and, in some cases with automation, which may reduce the random behavior of occupantto manageable levels. The research will focus on two types of buildings: residential buildings andpublic buildings. The research plan covers the aspects of de�ning the ICT based energy managementservices to be o�ered, the architecture de�nition of the systems, the integration of �intelligence�in the services (mainly through smart alarms and simpli�ed building energy performance models), de�nition of the methodology to evaluate energy savings and user behaviour changes and theanalysis of the achieved outputs of pilot buildings in real operation conditions.
2. Geographical coverage and pilot projects
This research is based on the results of the following projects: eSESH5; BECA6; and Girona7.In the case of public buildings, the ICT based services are evaluated in 24 public schools of the
City of Girona (Spain).
Pilot site Total number of public
buildings included in
the analysis
Automated ICT based
energy management
services
EAS/EMS
Girona 24 schools 16 schools 8 schools
Table 1: Number of pilot public buildings
In Table 1, a summary with the number of analyzed public buildings is shown. As it can beobserved, some of the schools complement EAS and EMS services with a low-level of automationapplied in the heating boilers.
In the case of social housing, the ICT based services are evaluated in 10 pilots in 6 countriesacross Europe as summarized in Table 2. More than 5,000 social housing tenants were given accessto Energy Awareness and/or Energy Management As it can be observed in Table 2, from the overallnumber of dwellings available, only those with reliable data were selected for the analysis.
5www.eSESH.eu6www.beca-project.eu7www.inergybcn.com
3

Pilot site Total number of
dwellings involved
Number of
dwellings included
in the analysis
(EAS)
Country
Angers 993 DHW: 404
Electricity: 426
France
Catalonia 77 Electricity: 44
Gas: 38
Spain
Extremadura 116 Electricity: 78 Spain
Frankfurt 358 Heating/DHW: 149 Germany
Karlsruhe 533 Heating: 323
DHW: 260
Germany
Linz 361 Electricity: 166
Heating: 159
Austria
Moulins 399 DHW: 342 France
Solingen 296 Heating: 166 Germany
North Italy 468 Electricity: 253
Gas: 480
District heating: 95
Italy
Westerlo 121 Electricity: 30
Heating: 44
Belgium
In total 3722 1,800-2,200 6
Table 2: Number of pilot dwellings and number after �lttering
3. ICT architecture
3.1. ICT architecture for EAS/EMS in social housing
Within eSESH and BECA projects, an e�ort to de�ne a common ICT architecture for allthe pilot sites was carried out. The ICT architecture is designed adopting a top-down approach.General top-level architecture, conceptual diagrams and logical layered architecture descriptionusing a standard Uni�ed Modelling Language (UML) provide link between hardware solutions andservice functionality. In order to build a complex and e�ective ICT system for providing informationabout own energy consumption (tenants and operating sta�), various types of requirements haveto be taken into account.
4
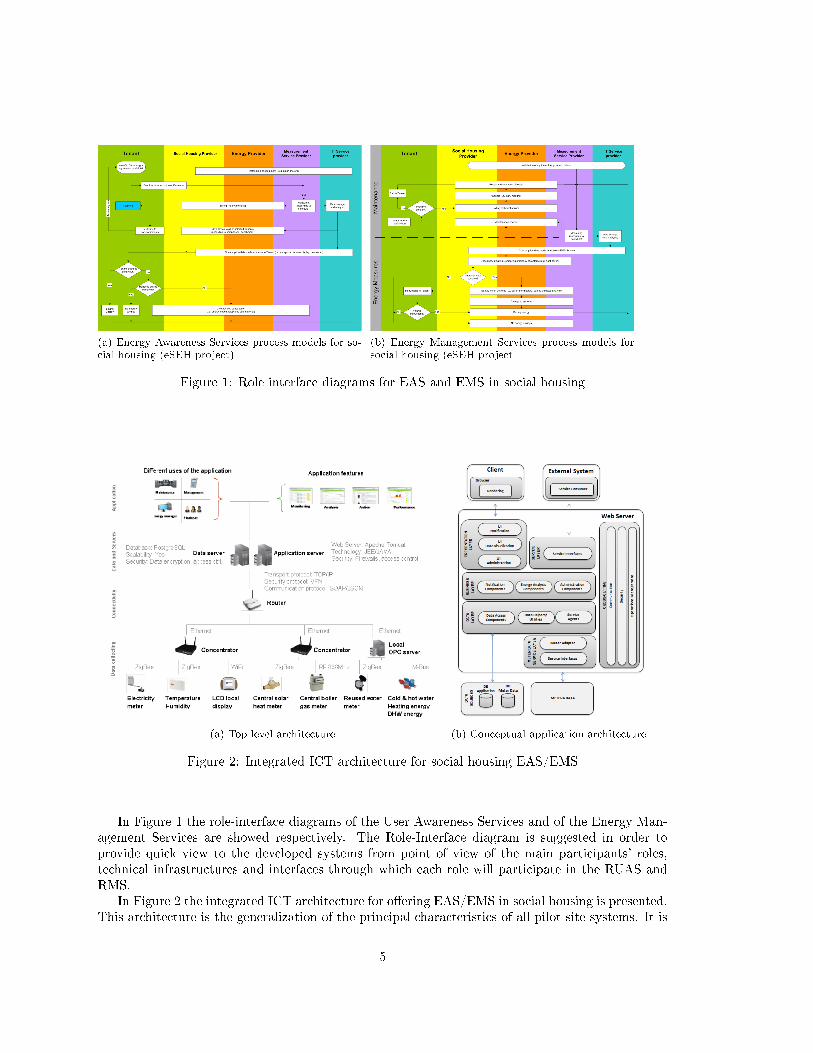
(a) Energy Awareness Services process models for so-cial housing (eSEH project)
(b) Energy Management Services process models forsocial housing (eSEH project
Figure 1: Role interface diagrams for EAS and EMS in social housing
(a) Top level architecture (b) Conceptual application architecture
Figure 2: Integrated ICT architecture for social housing EAS/EMS
In Figure 1 the role-interface diagrams of the User Awareness Services and of the Energy Man-agement Services are showed respectively. The Role-Interface diagram is suggested in order toprovide quick view to the developed systems from point of view of the main participants' roles,technical infrastructures and interfaces through which each role will participate in the RUAS andRMS.
In Figure 2 the integrated ICT architecture for o�ering EAS/EMS in social housing is presented.This architecture is the generalization of the principal characteristics of all pilot-site systems. It is
5

representative for the whole family of systems used in the social housing pilot sites. Some of thepilot-site systems have implemented only part of the features of this general architecture, which isrelevant to their pilot-site situation.
The concept diagram shown in Figure 2 is represented in layers grouping di�erent functionalities.Each layer is composed by functional and logical components that communicate through well-de�nedinterfaces. In this architectural view the layers may be located on the same physical hardware, ormay be on separate hardware components.
3.2. ICT architecture for EAS/EMS in public buildings
In the case of public buildings, the same UML standard was used. However, in public build-ings there many stakeholders involved in energy managament issues. More speci�cally, four mainstakeholder areas, with their own speci�c requirements, need to be addressed:
1. Energy expert, that needs a useful tool to analyse the energy results (Product Management).
2. Sta� or end users, that need useful visualization of results capable of in�uencing their be-haviour
3. Software Application IT specialist, the one who is in charge of developing the Software Ap-plication.
4. IT infrastructure and data Collecting System (System and Hardware Engineer) and the com-munication of the meter data to the central system
In order to eventually address these speci�c requirements, the proposed model is made up of �vemain views: a) the logical view, which shows the functional requirements related to the �nal user.;b) the process view, which captures the concurrency aspects between the stakeholders and thelogical elements of the architecture; c) the deployment view, which describes the mapping(s) ofthe software onto the hardware; d) the development view, which describes the static organizationof the software; e) the scenarios, which are made up of the the selected use cases. Figure 3 andFigure 4show schemes of the �ve main views followed to describe the ICT architecture for o�eringEAS and EMS services in public buildings.
(a) Model 4+1 for public buildings (b) Bussiness process model
Figure 3: Description of the overall architecture view in public buildings
6
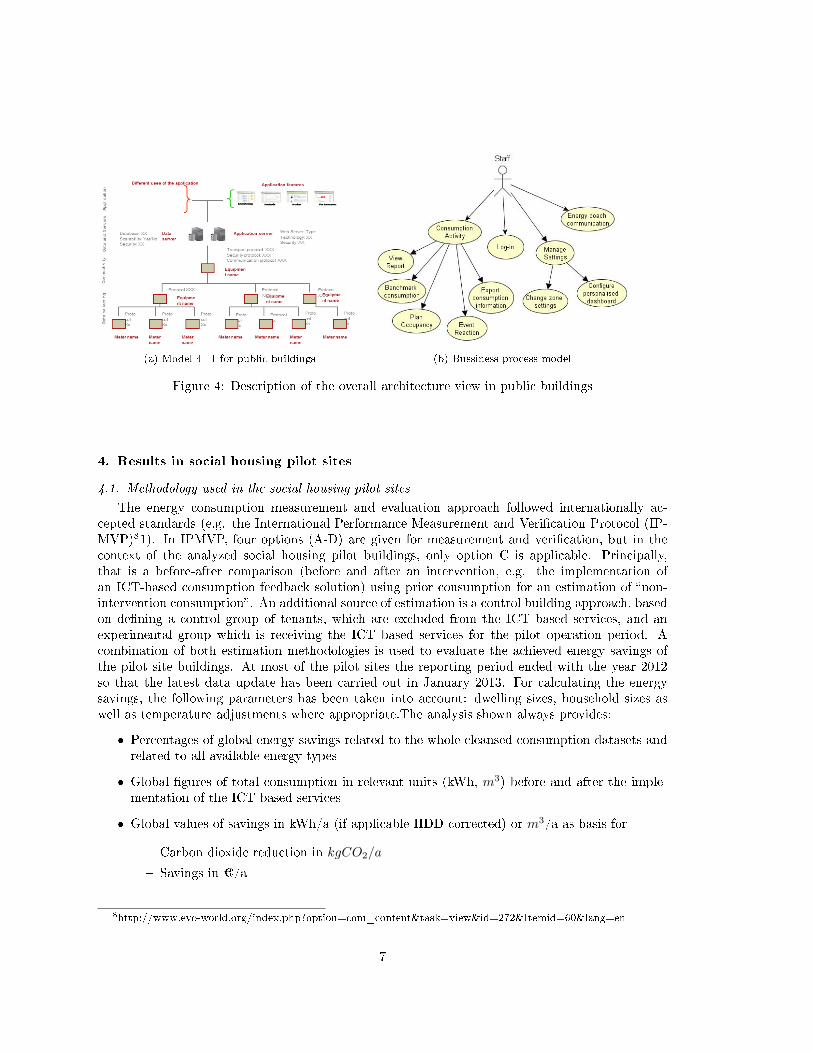
(a) Model 4+1 for public buildings (b) Bussiness process model
Figure 4: Description of the overall architecture view in public buildings
4. Results in social housing pilot sites
4.1. Methodology used in the social housing pilot sites
The energy consumption measurement and evaluation approach followed internationally ac-cepted standards (e.g. the International Performance Measurement and Veri�cation Protocol (IP-MVP)81). In IPMVP, four options (A-D) are given for measurement and veri�cation, but in thecontext of the analyzed social housing pilot buildings, only option C is applicable. Principally,that is a before-after comparison (before and after an intervention, e.g. the implementation ofan ICT-based consumption feedback solution) using prior consumption for an estimation of �non-intervention consumption�. An additional source of estimation is a control building approach, basedon de�ning a control group of tenants, which are excluded from the ICT based services, and anexperimental group which is receiving the ICT based services for the pilot operation period. Acombination of both estimation methodologies is used to evaluate the achieved energy savings ofthe pilot site buildings. At most of the pilot sites the reporting period ended with the year 2012so that the latest data update has been carried out in January 2013. For calculating the energysavings, the following parameters has been taken into account: dwelling sizes, household sizes aswell as temperature adjustments where appropriate.The analysis shown always provides:
� Percentages of global energy savings related to the whole cleansed consumption datasets andrelated to all available energy types
� Global �gures of total consumption in relevant units (kWh, m3) before and after the imple-mentation of the ICT based services
� Global values of savings in kWh/a (if applicable HDD corrected) or m3/a as basis for
� Carbon dioxide reduction in kgCO2/a
� Savings in ¿/a
8http://www.evo-world.org/index.php?option=com_content&task=view&id=272&Itemid=60&lang=en
7

� Average consumption per dwelling and year compared to the annual national average
� Savings, CO2 reductions and monetary savings per pilot dwelling.
The basic tenant-related evaluation approach followed a quasi-experimental design including a three-stage data collection. A quasi-experimental design describes the availability of a control group, butmeans � in contrast to a �real� experimental design - that both groups will not be selected randomly.Instead of that, the housing providers by themselves decide on the assignment of tenants to one oranother group. Generally, in the analyzed pilot sites, there were three tenant groups available:
Experimental or treatment group with:
1. Active users with full access and a regular use of the service
2. Passive users with possible (theoretical) access to the service but without (practical) willing-ness to use
Control-group without theoretical and practical access to the service.
Often a real control group approach is not appropriate because of the absence of comparable build-ings/dwellings, too small sample sizes or a combination of both. The comparison of active usersand passive users in fact has some di�culties due to a systematic bias because passive users are notvery interested in the services at all, which may be caused by several reasons. Notwithstanding,under certain conditions by taking into account that bias, for example by including this group intenant surveys too, passive users can serve as an adequate comparison group. All pilot sites realisedtenant surveys. 7 out of 10 pilot sites carried out a longitudinal study with baseline and �nal tenantsurvey. In Figure 5, the survey sample sizes for each pilot site are shown.
Figure 5: Tenant survey sample sizes
The data provision has been realised by the pilot site managers using a standardised evaluationtemplate which included: an INFO sheet collecting dwelling numbers/tenant IDs, dwelling andhousehold size, number of rooms , change of tenancy/move-in date and the results of the tenantsurveys following a standardised code plan a Consumption data sheet separately for all measuredenergy types related to the eSESH service (separately for EAS and EMS if applicable) a Service
8

use sheet which collected the measured web portal log-ins.All consumption data sets have been putthrough a data cleansing procedure. That means dwellings with change of tenancy in the projectduration were excluded from the data analysis. The same applies to (temporarily) unoccupieddwellings or long periods of absence of the tenant (zero values) and to cases with obvious inconsis-tencies in the measurements (e.g. implausible or extreme values due to malfunctions of the meteringdevices).
4.2. Achieved global energy savings
All ten pilots achieved savings. The majority of pilot sites achieved the saving targets de�nedin evaluation planning, some at least partly. In most cases (much) more than 50% of the involvedpilot tenants achieved measurable savings. In Figure 6the achieved energy savings per pilot site areshown.
Figure 6: Achieved global energy savings per pilot site
In Figure 7, the achieved global energy savings per energy type is shown.
9

Figure 7: Achieved global energy savings per erngy type
With an overall saving of heat energy consumption of 9% across all pilot sites met a reasonabletarget. This presents a signi�cant achievement considering the outstanding importance of reducingenergy use for domestic heating, which accounts for more than two thirds of energy consumptionin the residential sector.
4.3. Increased user awareness
To evaluate the he increase in user awareness a quanti�cation of the number of tenant accessingthe EAS is necesssary. In Figure 8 the obtained data of interested tenants in EAS, as well asthe percentage of active users is shown. It can be observed that 2,666 tenant households over5,865 individuals (average household size 2.2) have been enabled to make use of EAS. One third ofthe total number of potential users became actual users of the tenant web portal (gathered frommeasured portal log-ins).
Figure 8: Achieved number of EAS users
Figure 9 shows the level of raised user awareness ant the number of pilot sites which reportedbehaviour changes. Some conclusions can be obtained:
High level = 9 pilots: More than 50% of survey respondents/EAS users described their interestin consumption and/or have a high energy saving norm` and/or keep now an eye on theirconsumption.
Medium level = 1 pilot: More than 50% of survey respondents/EAS users reported on an increasedknowledge about energy consumption.
10

Furthermore, in 7 pilot sites the respondents reported on optimized energy consumption behaviour.
Figure 9: Achieved user awareness increase
4.4. Set up of smart alarms system
In order to provide a �rst level of intelligence in the energy optimization strategy, 49 combinedalarms were programmed and implemented in some pilot sites. These alarms gave detailed infor-mation of anomalies in space heating, DHW and electric energy consumption so that the tenantcan take decisions to reduce its energy consumption. The control levels of the alarms were obtainedbased on data series analysis methods and some basic linear energy performance characterizationmethods.
Figure 10 shows an example of the implemented alarms in the social housing pilots.
Figure 10: Example of smar alarms implemented in the pilot sites
5. Results in public buildings
5.1. Methodology used in public buildings sites
The IPMVP o�ers several options for calculating energy savings. This project is dealing withpublic buildings and is gathering half-hourly data from the pilot sites. To ensure a simple directcomparison is possible between sites, the project will be following an approach equivalent to IPMVPoption C where possible. For this, data for the whole building are separated into periods beforethe intervention (the `baseline') and after the inadmvotervention (the `reporting period' or `testperiod'). A statistical model is �tted to the baseline data and is used to forecast forwards into thetest period. Savings are estimated as the di�erence between measured values in the test periodand the consumption forecast. Simple statistical models are commonly used to model energy
11
consumption. In particular the Variable Base Degree Day (VBDD) model and its variants allowfor the in�uence of outside air temperature to be modelled fairly simply.
Regarding the change in occupants' behaviour, the evaluation approach followed the same proce-dure than the social housing pilot sites. In this case, the concept of tenant was substituted by �sta�personnel�. The EMS were evaluated with the technical personnel and with the energy manager.
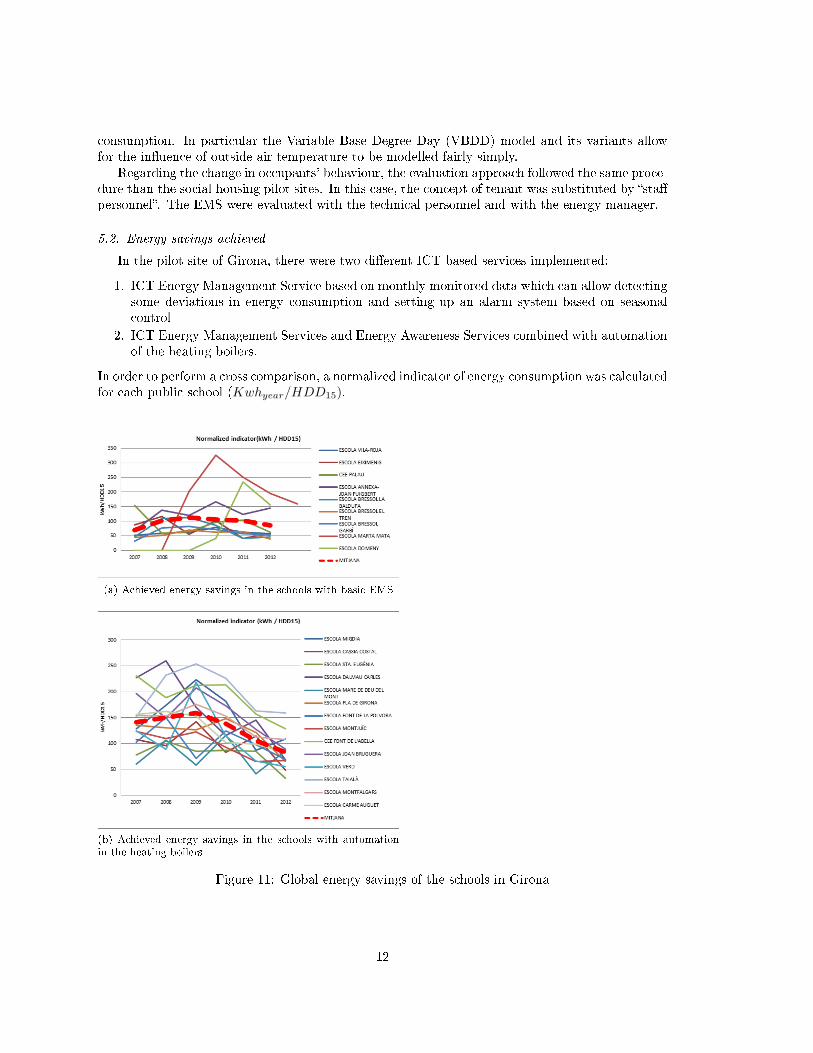
5.2. Energy savings achieved
In the pilot site of Girona, there were two di�erent ICT based services implemented:
1. ICT Energy Management Service based on monthly monitored data which can allow detectingsome deviations in energy consumption and setting up an alarm system based on seasonalcontrol
2. ICT Energy Management Services and Energy Awareness Services combined with automationof the heating boilers.
In order to perform a cross comparison, a normalized indicator of energy consumption was calculatedfor each public school (Kwhyear/HDD15).
(a) Achieved energy savings in the schools with basic EMS
(b) Achieved energy savings in the schools with automationin the heating boilers
Figure 11: Global energy savings of the schools in Girona
12

In Figure 11the evolution of the normalized energy indicator is shown for the schools which werereceiving the �rst level of ICT based services (a), and for the schools with automated systems inthe heating boilers (b). The red line is the average indicator of all the schools.The baseline wasde�ned in 2009 while 2010 was the year when the ICT based services start operating. As it canbe appreciated, in both cases energy savings are achieved. However, the schools with automatedsystems achieve higher energy savings than the other ones.
The accumulative energy saving achieved in the 16 schools with automation systems, from 2009to 2012 was of 26 % of the baseline. From an economical point of view, global energy savings of 28% were achieved.
6. Conclusions
The operation of the EAS and EMS services in public buildings and social housing, based ona common reference architecture, use cases and process models in several European pilot sitesprovided rich experience. The ICT based services at each pilot site were adapted to the localsituation, the speci�c typology of building energy supply systems and taking into account the usergroup requirements in the design phase. This approach makes the pilot operation one of the mostcomprehensive activities, to our knowledge, for testing energy awareness and management servicesfor �nal user of social housing and public buildings.
The pilot operation activity permitted to extract useful lessons for replication by others, out-lining important aspects to be addressed and improved in the future. The lessons learned comprisethree main aspects a�ecting the service success:
1. E�ectiveness of the user interfaces and information content2. Pilot organisation3. Appropriateness of the technical means
With regard to the service e�ectiveness for energy saving, it should be clearly distinguished betweenEMS and EAS. Professional EMS are directed to maintenance sta�, which provide monitoring andoptimisation of central building energy systems, unconditionally proved to be very e�ective forachieving energy savings. The situation is much more complex analysing the results of EAS directedto tenants or occupants (sta� of public buildings), as there is a wide spectrum of factors in�uencingtheir behaviour and attitudes. The resulting e�ectiveness of the services depends on the particularcombination of these factors. Motivation of occupant to save energy is the dominant factor forservice success.
Among social housing tenants the interest in services is driven more by economic reasons thanby environmental consciousness, although the latter aspect is growing in interest, especially amongyoung tenants. On the other hand, in public buildings this is not dominant factor, while improve-ment of building management and projected image to the citizens seems a stronger factor. For thisreason it is important to establish a clear link between energy saving behaviour and economicalsavings.
Social policies in some European countries where unemployed tenants do not pay, or pay verylow rates for energy, or major parts of energy costs of tenants living on social bene�ts are paid bythe state (through social bene�t payments) (e.g. Germany) is strongly de-motivating particularlysocial housing tenants in the use of EAS, and generally in energy saving. Another economicallyde-motivating factor for energy saving attitudes is the relatively high �xed part in the energy billspaid to the energy supply companies in concept of power / supply service contracting fee. With lowenergy consumption rate, typical for social housing tenants, energy saving a�ects only the variablepart of the bill, while the �xed remains unchanged. In this sense, interesting services are thoseorientated to reducing the peak demand (peak shedding) (e.g. Angers), that may lead to reductionof the contracted power, and respectively to economic saving for tenants.
13

Age, educational background, knowledge and habits for using new ICT technologies are otherpowerful factors for more active use of the ICT based services. Di�erent groups of tenants showedalso di�erent interest in the services and, in general, di�erent preferences to the interfaces throughwhich the EAS are communicated. The majority of elderly tenants and those with poor pro�ciencyin ICT have a preference for regular reports on paper.
As a conclusion, in order to communicate e�ectively the EAS and EMS, it seems important too�er to the tenants, sta� personnel and technical sta�, various interface options in order to matchbetter their preferences and lifestyles. Some technological prospecting is necessary for the lifecycleof the project to avoid selection of interface options that might become obsolete soon. It must betaken into account that, due to more demanding economic necessities, a lot of social housing tenantsalready apply energy saving practices in their homes. Probably, the margin for savings from thatkind of advices is already exhausted, so EAS have to emphasise above other, more interesting andunique features that might be provided by analysing the speci�c measured data and o�ering theinformation in personalised way.
Buildings incorporating energy e�ciency features (low energy buildings, passive solar buildings)represent a special case that require tenant interaction, like opening or closing registers, etc., inorder to produce savings. The construction of this kind of buildings has been growing all overEurope in the last years. In such cases tenants should have good knowledge in order to use thebuilding properly to save energy. Incorporating instructions to tenants how to properly use thesebuilding features in the EAS could be very e�ective. A good example for this is the Catalonia pilotsite, where this sort of information given to tenants contributed to the achievement of considerableenergy savings. EAS and EMS in some cases compete for the same savings. As e.g. in the case ofoptimisation of the operation of central heating systems, the EMS limiting the internal temperature,or reducing or stopping heating during the night diminishes or cancels the possibility of saving fromsimilar functionalities and recommendations in EAS. For this reason some of the pilots applyingsuch EMS services will not achieve the full expected savings from the EAS but these are re�ectedin those of the EMS (e.g. Solingen, Frankfurt).
References
[1] G. Zucker, T. Ferhatbegovic, and D. Bruckner, �Building automation for increased energy e�-ciency in buildings,� in 2012 IEEE International Symposium on Industrial Electronics (ISIE),pp. 1191�1196, 2012.
[2] C. Aghemo, J. Virgone, G. Fracastoro, A. Pellegrino, L. Blaso, J. Savoyat, and K. Johannes,�Management and monitoring of public buildings through ICT based systems: Control rulesfor energy saving with lighting and HVAC services,� Frontiers of Architectural Research, 2013.
[3] L. Tronchin and K. Fabbri, �Energy performance building evaluation in mediterranean coun-tries: Comparison between software simulations and operating rating simulation,� Energy andBuildings, vol. 40, no. 7, pp. 1176�1187, 2008.
[4] K. Lomas, H. Eppel, C. Martin, and D. Bloom�eld, �Empirical validation of building energysimulation programs,� Energy and Buildings, vol. 26, no. 3, pp. 253�275, 1997.
[5] A. Pedrini, F. Westphal, and R. Lamberts, �A methodology for building energy modelling andcalibration in warm climates,� Building and Environment, vol. 37, pp. 903�912, 2002.
[6] P. Torcellini, M. Deru, B. Gri�th, N. Long, S. Pless, and R. Judko�, �Lessons learned fromthe �eld evaluation of six high-performance buildings,� ACEEE Summer Study on EnergyE�ciency of Buildings, American Council for an Energy-E�cient Economy (Washington DC,USA), p. 3, 2004.
14

[7] Y. Schwartz and R. Raslan, �Variations in results of building energy simulation tools, andtheir impact on BREEAM and LEED ratings: A case study,� Energy and Buildings, vol. 62,pp. 350�359, July 2013.
[8] G. Branco, B. Lachal, P. Gallinelli, and W. Weber, �Predicted versus observed heat consump-tion of a low energy multifamily complex in switzerland based on long-term experimental data,�Energy and Buildings, vol. 36, no. 6, pp. 543�555, 2004.
[9] L. K. Norford, R. H. Socolow, E. S. Hsieh, and G. V. Spadaro, �Two-to-one discrepancybetween measured and predicted performance of a [`]low-energy' o�ce building: insights froma reconciliation based on the DOE-2 model,� Energy and Buildings, vol. 21, no. 2, pp. 121�131, 1994.
[10] V. Fabi, R. Andersen, S. Corgnati, and B. Olesen, �Occupants' window opening behaviour: Aliterature review of factors in�uencing occupant behaviour and models,� Building and Envi-ronment, vol. 58, pp. 188�198, 2012.
[11] J. Page, D. Robinson, N. Morel, and J.-L. Scartezzini, �A generalised stochastic model for thesimulation of occupant presence,� Energy and Buildings, vol. 40, no. 2, pp. 83�98, 2008.
[12] J. Goins and M. Moezzi, �Linking occupant complaints to building performance,� BuildingResearch & Information, vol. 41, no. 3, pp. 361�372, 2013.
15


![Educational research in architecture: ICT tool for ... · Fig. 3 - ICT platform for evaluation of the status of historical buildings conservation: Lezirão. Fig. [3]4 - ICT platform](https://img.dokumen.tips/doc/110x75/60116bcffc95e83300576d26/educational-research-in-architecture-ict-tool-for-fig-3-ict-platform-for.jpg)