Embed Size (px)
Citation preview

International journal of Biomedical Engineering and Science (IJBES), Vol. 2, No. 1, January 2015
1
EEG TIME SERIES DATA ANALYSIS IN FOCAL
CEREBRAL ISCHEMIC RAT MODEL
Sudip Paul1, 3*
, Tapas Kumar Sinha2*
, Ranjana Patnaik3
1Department of Biomedical Engineering, North-Eastern Hill University, India
2Computer Centre, North-Eastern Hill University, India
3School of Biomedical Engineering, Indian Institute of Technology, Banaras Hindu
University, India
*Corresponding Author:
Mr. Sudip Paul
Department of Biomedical EngineeringNorth-Eastern Hill University, India
ABSTRACT
The mammalian brain exists in a number of attractors. In order to characterize these attractors we have
collected the time series data from the EEG recording of rat models. The time series was obtained by
recording of the frontoparietal, occipital and temporal regions of the rat brain. Significant changes have
been observed in the dimensionalities of these brain attractors between the normal state, focal ischemic
state and the drug induced state. Thus, these three states were characterized by unique lyapunov exponents,
correlation dimensions and embedding dimensions. The inverse of the lyapunov exponent gave us the long
term coherence of the rat brain and was found to differ for the three states. The autocorrelation function
measured the mean similarity of the EEG signal with itself after a time t. The degree of decay was high
indicating that there was maximum correlation in the time series. Thus, the autocorrelation functions
clearly indicate the effect of focal cerebral ischemia and drugs induced on the rat brain.
KEYWORDS
EEG; Focal Cerebral Ischemia; Lyapunov Exponent; Embedding Dimension; Correlation Coefficient
1. INTRODUCTION
Brain stroke is a very common and serious neurological disorder. Every year, 15 million people
worldwide suffer a stroke. Nearly six million die and another five million are left permanently
disabled. A stroke is a condition in which the brain cells suddenly die because of a lack of
oxygen. This can be caused by an obstruction in the blood flow, or the rupture of an artery that
feeds the brain. Characterization of the brain stroke EEG plays a vital role.
Electroencephalography (EEG) provides a direct and comprehensive measure of cortical activity
with millisecond resolution. The EEG recordings, which are aperiodic time series, are a result of
the contributions of large number neuronal potentials. We have investigated induced focal
cerebral ischemia and subsequent recovery by application of the Piroxicam drug. Piroxicam drug

International journal of Biomedical Engineering and Science (IJBES), Vol. 2, No. 1, January 2015
2
has been used earlier studies [1]. Ischemic model of rat brain has been extensively studied [2].
However, the EEG data of focal cerebral ischemia has not yet been analyzed in terms of inverse
lyapunov exponent, correlation dimension and autocorrelation functions. In this paper, we have
analyzed the focal cerebral ischemia data in terms of the above parameters and were able to
classify EEG spectra in terms of inverse Lyapunov exponent and correlation dimensions. Via
analysis of the time series [3-7] using MATLAB R2010a based programs useful parameters series
such as lyapunov coefficients, Correlation dimension and autocorrelation function were extracted
from the time series. We have used these parameters to study the effect of induced stroke and
subsequent drug (Piroxicam) based recovery on the rat brain.
2. MATERIALS AND METHODS
Male Charles Foster rats (6 weeks, 270 ± 10 g) were in-bred at the Central Animal House,
Banaras Hindu University were used for the experiments. Animals were kept under standard
laboratory conditions maintained with animal care and housing. In our study, a total of 24 animals
were divided in three groups consisting of control (n=8), induced stroke (n=8) and Piroxicam
drug treated (n=8) for each group. Piroxicam and other chemicals were purchased from Sigma,
USA. They were allowed free access to food and water and maintained at 12 h day/night cycle.
Focal cerebral ischemia was induced by occlusion of the middle cerebral artery (MCA) using a
modification of the intraluminal technique. Animals were anesthetized with ketamine and
xylazine (75 mg/kg and 10 mg/kg i.p, respectively). The neck muscles were separated further to
expose external carotid artery (ECA) and internal carotid artery (ICA). A 4.0 cm length 3-0
monofilament nylon suture (Ethicon) was introduced into the ECA lumen through a small nick
and gently advanced from to the ICA lumen to block the origin of MCA. The approximate length
of filament inserted near the bifurcation point to the MCA blockade site was about 18-22mm. The
ECA stump was tightened by thread around the intraluminal nylon suture to prevent bleeding.
Reperfusion was allowed by gently removing the monofilament after 1 h of ischemia. In sham-
operated animals, all the procedures except for the insertion of the nylon filament were carried
out. Animals were allowed to recover from anesthesia and on regaining the righting reflex, were
transferred to cages in the animal room, with temperature maintained at 26 ± 2.5oC.
EEG electrodes were implanted and placed to the skull at positions that were optimized following
stereotactic coordinates (Paxinos) in pilot experiments. A bipolar electrode montage system was
used for recording the rat brain EEG signal. Electrodes were placed bilaterally in the skull over
the frontoparietal, occipital and temporal regions of the rat brain. A reference electrode was
placed posterior to lambda over the transverse sinus.
2.1. Lyapunov exponents
The dynamics of complex systems (such as the mammalian brain) is constrained to certain paths
or flows. Flows may be analyzed in terms of Gauss’s theorem: time rate of flow into a volume
must equal the flow out of the volume. Consider a volume element of radius ε . Grassberger and
Procaccia [5-6] have shown that as result of the flow the number of points in the volume element
is given by the power law as

International journal of Biomedical Engineering and Science (IJBES), Vol. 2, No. 1, January 2015
3
( ) dC r ε≈ (1)
Where, d is the correlation dimension given by the slope of the log ( )C r versus log( )ε
(Fig. 1-9). Thus distances between trajectories grow exponentially:
0( ) t
t eλδ δ≈
(2)
The plot of ln( ( )tδ
versus t gives a straight line with slope λ (Fig. 1-3) where λ is the
Lyapunov exponent. The existence of the linear plots confirms that equations (1) and (3)
are associated with attractors of the rat brain (Fig. 1-3). In general the mammalian brain
exists in a number of attractors [8].
2.2. Correlation dimension:
Consider the time series:{ }( ), ( ),... ( ( 1) )i i iV t V t V t nτ τ+ + − . The integral correlation
coefficient is obtained via the method outlined in [1]. Here one starts with a reference
point i
V and its distance to the rest of the points is computed. Then one computes how
many points lie within a given distance r fromV . Repeating this process for all I one
arrives at ( )C r , the integral correlation coefficient of the attractor. For small r ,
( ) ~C r rν where ν is the correlation dimension and is given by the slope of the plot of
log( ( ))C r versus log( )r . The slope was computed directly in the Matlab program for
various embedding dimension. The plot of the correlation dimension ν versus embedding
dimension m was obtained (Fig. 4).
2.3. Autocorrelation functions:
The autocorrelation function of a time series is a measure of how the values of the time
series separated by a time τ behave. The autocorrelation coefficient for the time series
defined above is given by [3]
1
2
1
1( ) ( )
( )1
( )
N
i i
i
N
i
i
V t V V t VN
V t VN
τ
ψ τ =
=
− + − =
−
∑
∑ (3)
where,

International journal of Biomedical Engineering and Science (IJBES), Vol. 2, No. 1, January 2015
4
1
1( )
N
i
i
V V tN =
= ∑ (4)
A plot of the autocorrelation function for the control, stroke induced and drug based
recovery is shown in (Fig.5-7).
3. RESULTS
3.1. Lyapunov exponents:
Figure 1. Lyapunov Exponent for Control rat brain EEG Signal
International journal of Biomedical Engineering and Science (IJBES), Vol. 2, No. 1, January 2015
5
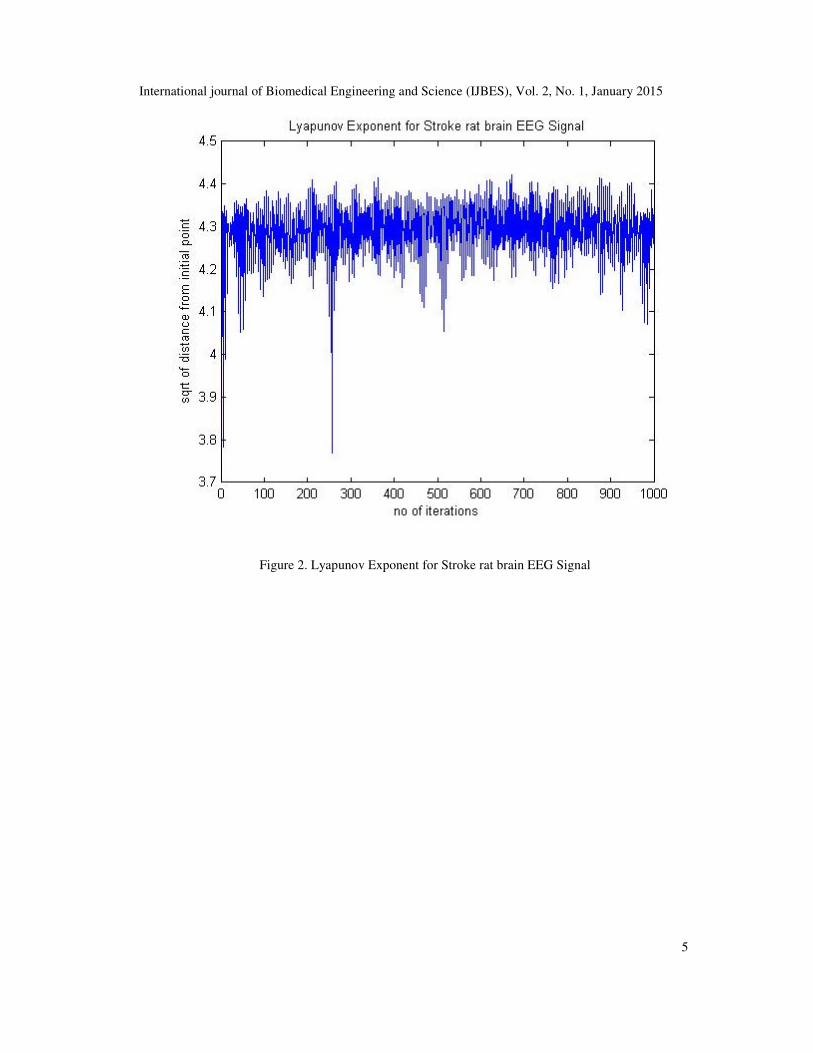
Figure 2. Lyapunov Exponent for Stroke rat brain EEG Signal

International journal of Biomedical Engineering and Science (IJBES), Vol. 2, No. 1, January 2015
6
Figure 3. Lyapunov Exponent for Drug induced rat brain EEG Signal
Lypaunov exponents for the control data were negative, implying that the neurons in the
rat brain were in the stable state (Fig. 1-3). The Lyapunov exponents for the entire stroke
data were positive indicating that there was some instability had been induced in the
system. After application of drug, in some cases the Lyapunov exponents were in some
cases positive and in some cases were negative. The negative Lyapunov exponents
indicated the neurons of the brain have reached the stable state. On the other hand, when
the Lyapunov exponents were positive it meant that the neurons were in the unstable
state.
CASE 1: According to our experimental result, we can say 5 out of 8 sets in fronto-
parietal region; 6 out of 8 sets in occipital region and, 4 out of 8 sets in temporal region
the inverse Lyapunov exponent of the stroke value was less than the corresponding
control value. That signifies the induced stroke in the neurons of the rat brain. The
different regions of the brain are affected differently by the induced stroke; Occipital
region of the rat brain suffers the most damage while the temporal region suffers the
least. The reason for the differential effect of the stroke on the different region of the rat
brain is not known.

International journal of Biomedical Engineering and Science (IJBES), Vol. 2, No. 1, January 2015
7
CASE 2: After the drug was administered in our experiment, we got 4 out of 8 sets in
fronto-parietal region; 3 out of 8 sets in occipital region and, 3 out of 8 sets in temporal
region the inverse Lyapunov exponent of the drug induced value is more than the
corresponding induced stroke value and its effect the different region differently. In these
cases the inverse lyapunov exponents indicative the higher coherence length implying
that the recovery from stroke due to the drug have been more. The degree of recovery
was also different.
3.2. Correlation Dimensions:
Figure 4. Correlation dimensions of rat brain: Control, Stroke and Drug
Correlation Dimension decreases due to the induced stroke with respect to the control value and
increases when drug was administered (Fig. 4).
Case 1: According to our experimental result, we can say that 3 out of 8 sets in fronto-parietal
region; 5 out of 8 cases in occipital region and, 6 out of 8 cases in temporal region, the correlation
dimension of the stroke value was less than the corresponding control value. According to the
correlation dimension, temporal region of the rat brain suffers the most damage while the
Frontoparietal region suffers the least. The reason for the differential effect of the stroke on the
different region of the rat brain is not known.
CASE 2: After the drug was administered in our experiment, we got 4 out of 8 sets in fronto-
parietal region; 3 out of 8 sets in occipital region and, 4 out of 8 sets in temporal region the
correlation dimension of the drug induced value is more than the corresponding induced stroke
value and its effect the different region differently. Further in those cases where correlation
dimension in the drug induced data were less compared with the stroke value, the recovery was
not optimum.

International journal of Biomedical Engineering and Science (IJBES), Vol. 2, No. 1, January 2015
8
3.3. Autocorrelation functions:
Figure 5. Autocorrelation Function- Control rat brain EEG Signal
Figure 6. Autocorrelation Function- Stroke rat brain EEG Signal
International journal of Biomedical Engineering and Science (IJBES), Vol. 2, No. 1, January 2015
9
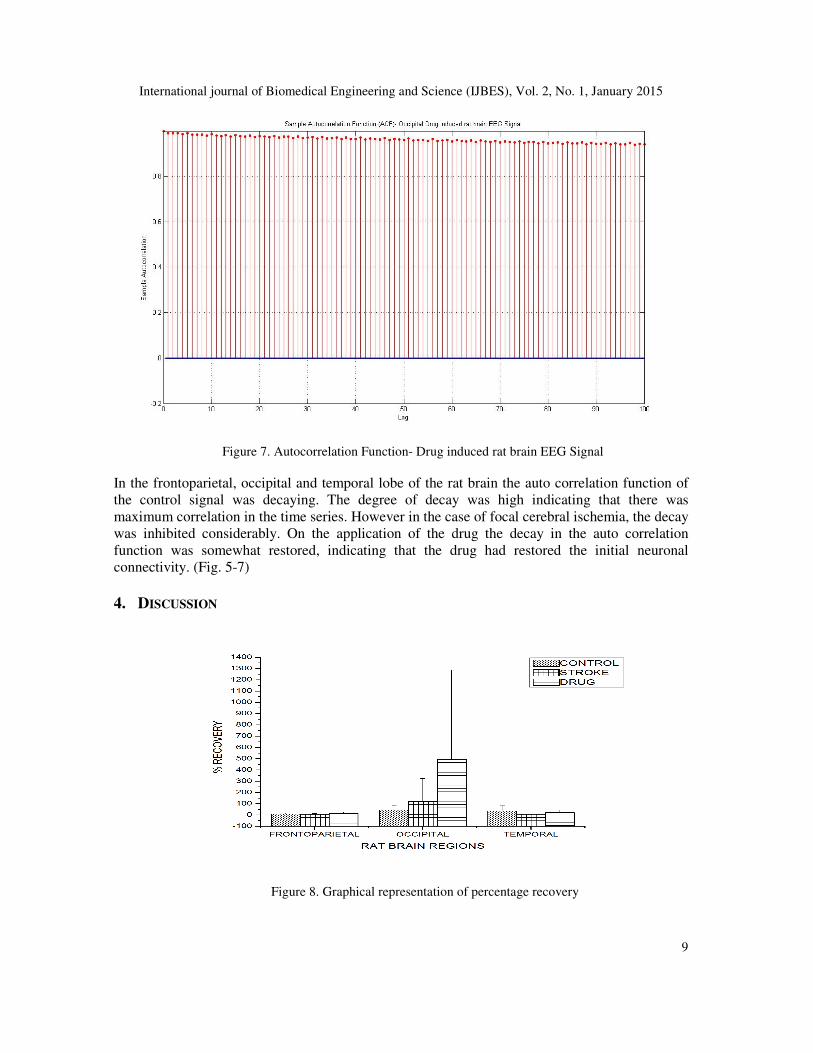
Figure 7. Autocorrelation Function- Drug induced rat brain EEG Signal
In the frontoparietal, occipital and temporal lobe of the rat brain the auto correlation function of
the control signal was decaying. The degree of decay was high indicating that there was
maximum correlation in the time series. However in the case of focal cerebral ischemia, the decay
was inhibited considerably. On the application of the drug the decay in the auto correlation
function was somewhat restored, indicating that the drug had restored the initial neuronal
connectivity. (Fig. 5-7)
4. DISCUSSION
Figure 8. Graphical representation of percentage recovery

International journal of Biomedical Engineering and Science (IJBES), Vol. 2, No. 1, January 2015
10
In this study, we have found that occipital region of the rat brain suffers the most damage and
after inducing the drug we can say that occipital region recovered most compared with the other
regions (Fig. 8). Further in those cases where inverse lyapunov exponents and correlation
dimensions in the drug induced data were less compared with the stroke value, the recovery was
not optimum.
5. CONCLUSION
Significant changes have been observed between the dimensionalities of these brain attractors
between the normal state, focal ischemic state and the drug induced state. We have found that
there are significant changes in both inverse lyapunov exponent and correlation diminutions.
They indicate both the coherence time and the number of interacting neuron are affected by the
induced stroke and restored partially by the application of drug. This result is also visually seeing
in the graphs of the auto correlation functions.
CONFLICT OF INTEREST
The authors declare no conflict in interests. And there are no ethical issues associated
with this work.
REFERENCES
[1] Dirangle, U., Iadecola. C,, Moskowitz, M.A. (1999). Pathobiology of ischemic stroke: an integrated
view. Trends Neurosci, Vol. 22, No.9, pp391–7.
[2] Vartiainen, N., Huang, C.Y., Salminen, A., et al. (2001). Piroxicam and NS-398 rescue neurones from
hypoxia/reoxygenation damage by a mechanism independent of cyclo-oxygenase inhibition. J Neuro-
chem, Vol. 76, No. 2, pp 480–489.
[3] Babloyantz, A., Destexhe, A. (1986). Low-Dimensional chaos in an instance of epilepsy. PNAS, Vol.
83, pp 3513-3517.
[4] Bartosz Swiderski, Stanisław Osowski, Andrzej Cichocki, and Andrzej Rysz. (2007). Epileptic
Seizure Prediction Using Lyapunov Exponents and Support Vector Machine. Springer-Verlag Berlin
Heidelberg ICANNGA. Part II, LNCS Vol. 4432, pp 373 – 381.
[5] Grassberger, P., I. Procaccia, I. (1983). Measuring the strangeness of strange attractors. Physica D.,
Vol. 8, pp 189-208.
[6] Grassberger, P., Procaccia, I. (1983). Characterization of Strange Attractors. Phys. Rev. Lett, Vol. 50,
pp 346-349.
[7] Murugavel, A. S. M., Ramakrishnan, S., Balasamy, K., Gopalakrishnan, T. (2011). Lyapunov
Features based EEG Signal Classification By Multi-Class SVM. IEEE World Congress on
Information and Communication Technologies. pp 197-201.
[8] Walter J. Freeman. (1988). Strange Attractors that Govern Mammalian Brain Dynamics Shown by
Trajectories of Electroencephalographic (EEG) Potential. IEEE Transactions on circuits and systems,
Vol. 35, No. 7, pp 781-783.

![Focal hemodynamic patterns of status epilepticus detected ... · epilepticus or subtle status epilepticus [4]. Electroenceph-alogram (EEG), the diagnostic gold standard, may not be](https://img.dokumen.tips/doc/110x75/6074493ed430437ef144c30f/focal-hemodynamic-patterns-of-status-epilepticus-detected-epilepticus-or-subtle.jpg)