Embed Size (px)
Citation preview

DEBUGGING IN VISUAL STUDIO
(BASIC LEVEL)Larry Nung

AGENDA
Break Point & Trace Point
Code Stepping
Edit variable value
Debug with Object ID
Set the Next Statement
Edit and continue
Q & A
2

BREAK POINT & TRACE POINT
3

BREAKPOINT GLYPHS
4

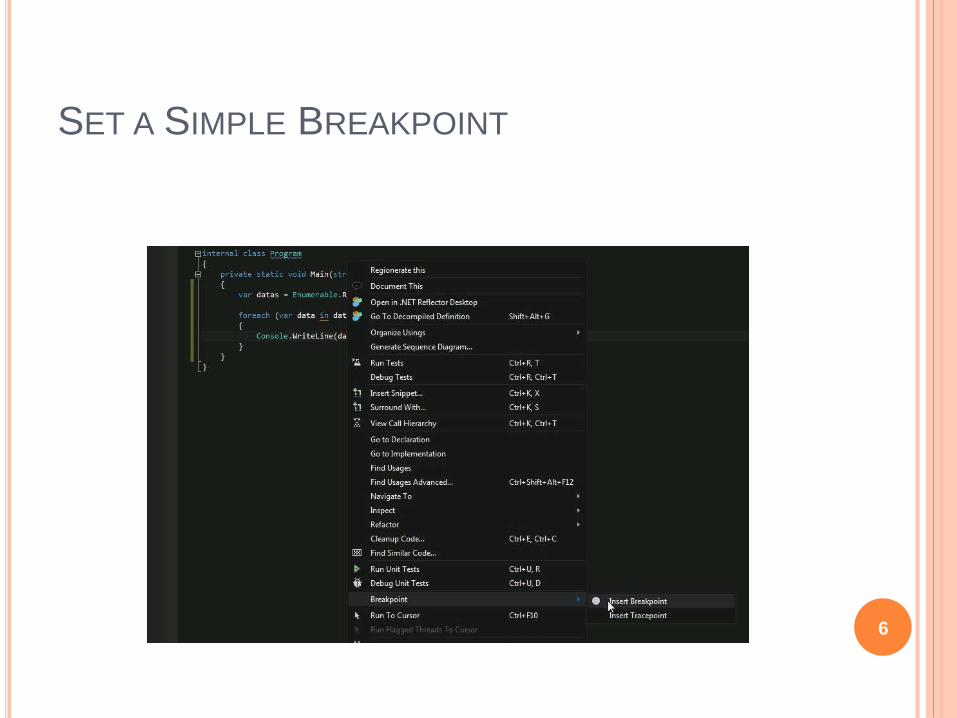
SET A SIMPLE BREAKPOINT
1. [Debug | Toggle Breakpoint]
2. [Breakpoint | Insert Breakpoint] from context
menu in source window.
3. Click on left margin
4. Shortcut
F9
5
SET A SIMPLE BREAKPOINT
6

SET A SIMPLE BREAKPOINT
7

SET A BREAKPOINT ON A FUNCTION CALL
FROM THE CALL STACK WINDOW
[Breakpoint | Insert Breakpoint] from context
menu in Call Stack window.
8

DELETE A BREAKPOINT
In the Breakpoints window, choose a breakpoint,
and click Delete button from the toolbar
In the Breakpoints window, right-click on a
breakpoint, and choose [Delete] from context menu.
In a source window or Disassembly window, click
on the breakpoint glyph.
Shortcut
F9
9

DELETE A BREAKPOINT
10

DISABLE A BREAKPOINT
In a source, Disassembly, or Call Stack window,
right-click on a line containing an enabled
breakpoint glyph and choose [Breakpoint |
Disable Breakpoint] from the shortcut menu.
In the Breakpoints window, clear the checkbox
next to an enabled breakpoint.
Shortcut
Ctrl + F9
11

DISABLE A BREAKPOINT
12

DISABLE A BREAKPOINT
13

ENABLE A BREAKPOINT
In a source, Disassembly, or Call Stack window,
right-click on a line containing a disabled
breakpoint glyph and choose [Breakpoint |
Enable Breakpoint] from the shortcut menu.
In the Breakpoints window, set the checkbox next
to a disabled breakpoint.
Shortcut
Ctrl + F9
14

ENABLE A BREAKPOINT
15

ENABLE A BREAKPOINT
16
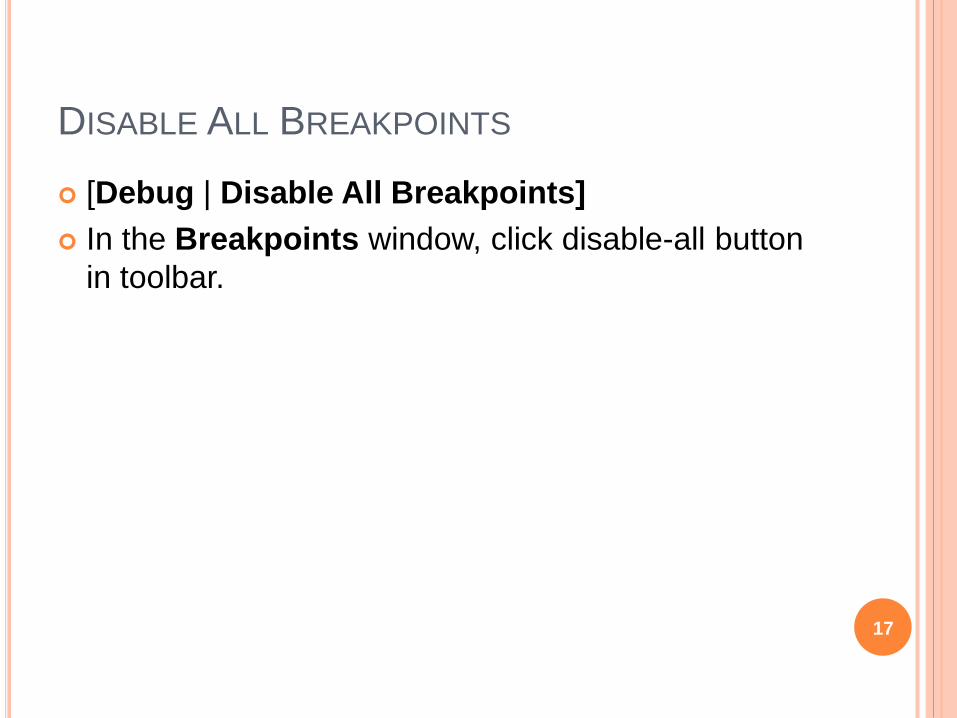
DISABLE ALL BREAKPOINTS
[Debug | Disable All Breakpoints]
In the Breakpoints window, click disable-all button
in toolbar.
17

DISABLE ALL BREAKPOINTS
18

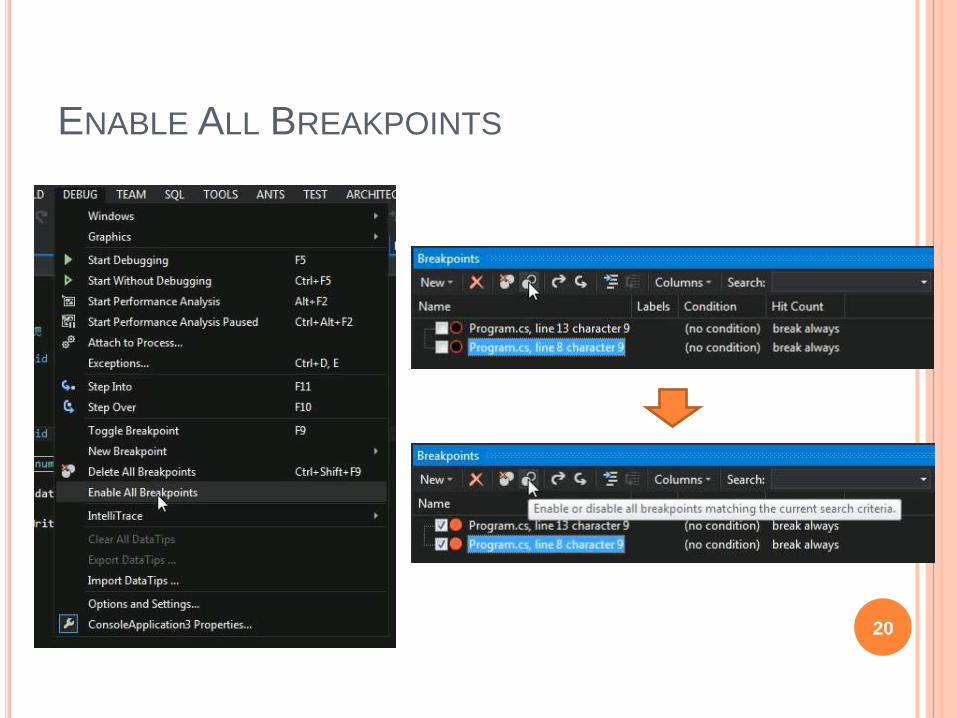
ENABLE ALL BREAKPOINTS
[Debug | Enable All Breakpoints]
In the Breakpoints window, click enable-all button
in toolbar.
19
ENABLE ALL BREAKPOINTS
20

DELETE ALL BREAKPOINTS
[Debug | Delete All Breakpoints]
21
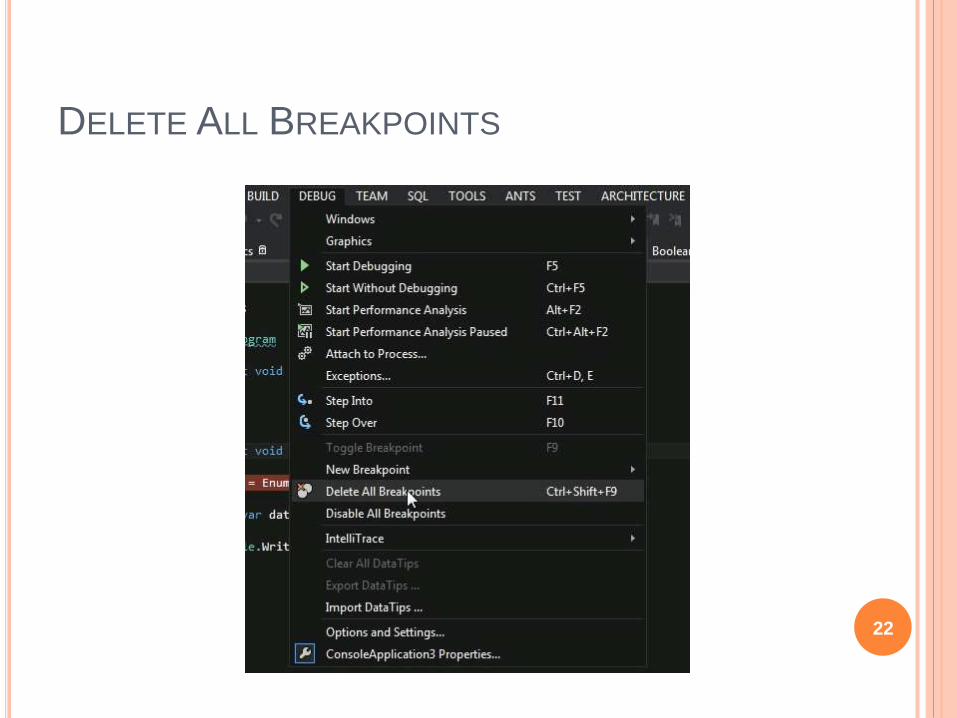
DELETE ALL BREAKPOINTS
22

BREAKPOINT FILTER
Function
Limit the behavior of a breakpoint to specified machines,
processes, and threads.
[Filter] from the context menu in the Breakpoints
window.
In a source, Disassembly, or Call Stack, right-click a
line containing a breakpoint glyph and
choose Filter from Breakpoints in the shortcut
menu.
[Filter] from context menu in breakpoint glyph.
23

BREAKPOINT FILTER
24

BREAKPOINT FILTER
25

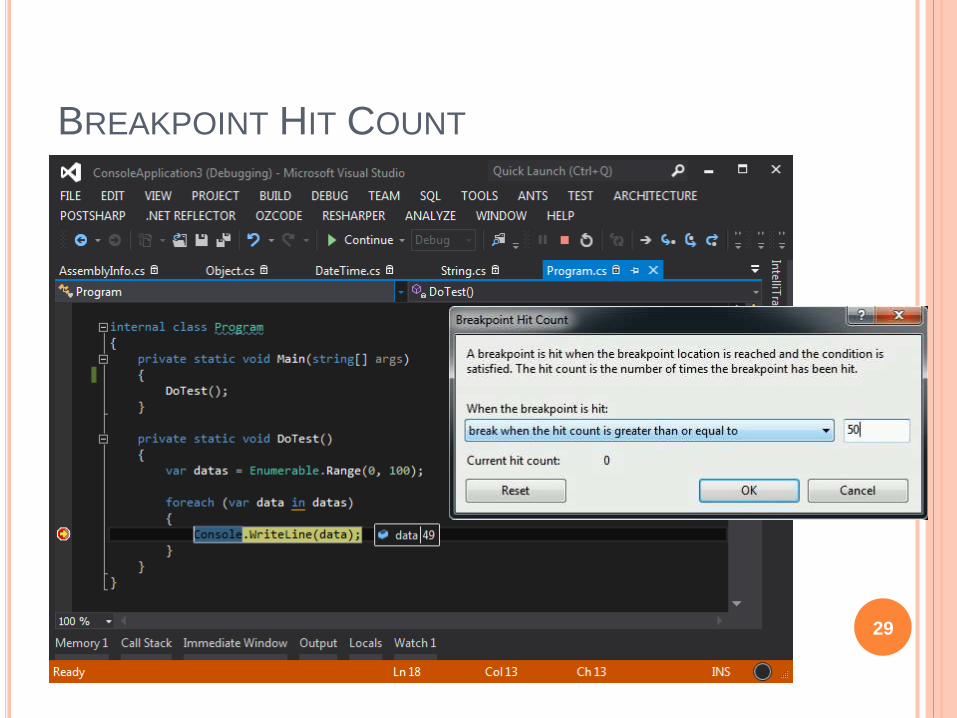
BREAKPOINT HIT COUNT
Function
Keep track of how many times a breakpoint is hit.
In the Breakpoints window, right-click on a
breakpoint and choose Hit Count from the shortcut
menu.
[Hit Count…] from context menu in breakpoint
glyph.
In a source, Disassembly, or Call Stack window,
right-click on a line containing a breakpoint and
choose [Breakpoints | Hit Count] in the shortcut
menu.26

BREAKPOINT HIT COUNT
27

BREAKPOINT HIT COUNT
28
BREAKPOINT HIT COUNT
29

BREAKPOINT CONDITION
Function
An expression that the debugger evaluates when a
breakpoint is reached.
In the Breakpoints window, right-click the line
containing a breakpoint glyph and
choose Condition from the shortcut menu.
In a source, Disassembly, or Call Stack, right-click a
line containing a breakpoint glyph and
choose Condition from Breakpoints in the
shortcut menu.
[Condition…] from context menu in breakpoint
glyph. 30

BREAKPOINT CONDITION
31

BREAKPOINT CONDITION
32
TRACE POINT
Function
A tracepoint is a breakpoint with a custom action
associated with it.
In a source window, click a line where you want to
set a tracepoint and choose Insert
Tracepoint from Breakpoints in the shortcut menu.
In a source, Disassembly, or Call Stack window,
right-click a breakpoint glyph and choose When Hit.
In the Breakpoints window, right-click a breakpoint
glyph and choose When Hit.
33

TRACE POINT
34
CODE STEPPING
35

STEP INTO
Function
If the line contains a function call, Step Into executes
only the call itself, then halts at the first line of code
inside the function. Otherwise, Step Into executes the
next statement.
ShortCut
F11
36

STEP INTO
37
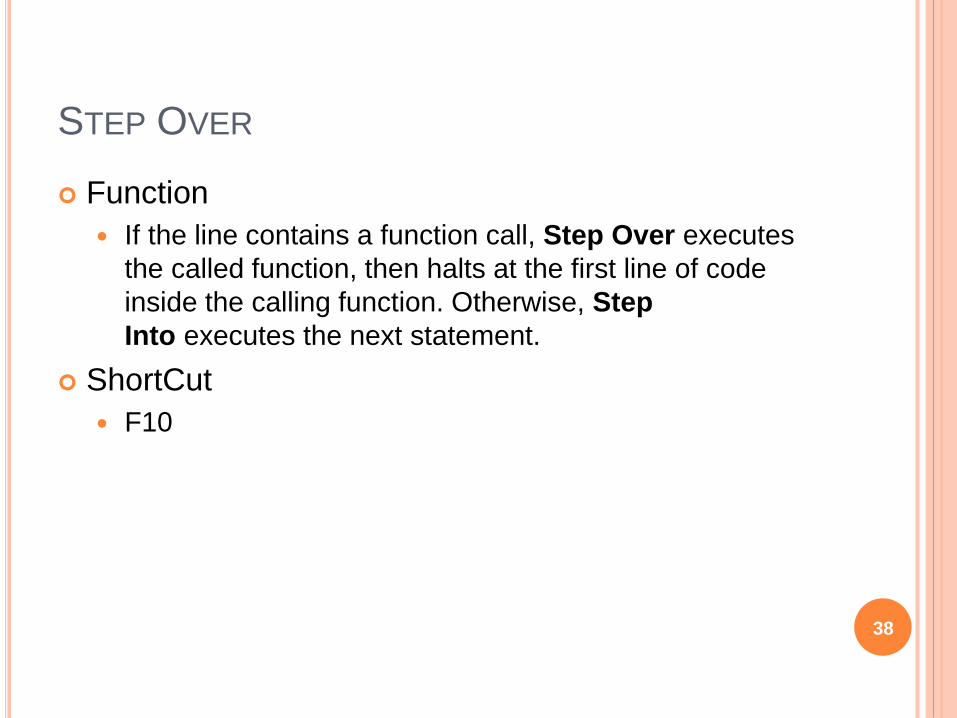
STEP OVER
Function
If the line contains a function call, Step Over executes
the called function, then halts at the first line of code
inside the calling function. Otherwise, Step
Into executes the next statement.
ShortCut
F10
38

STEP OVER
39

STEP OUT
Function
Step Out resumes execution of your code until the
function returns, then breaks at the return point in the
calling function.
ShortCut
Shift + F11
40

STEP OUT
41

EDIT VARIABLE VALUE
42

EDIT VARIABLE VALUE
43

EDIT VARIABLE VALUE
44

EDIT VARIABLE VALUE
45

EDIT VARIABLE VALUE
46

DEBUG WITH OBJECT ID47

DEBUG WITH OBJECT ID
Function
Identify debugging object
48

DEBUG WITH OBJECT ID
49

SET THE NEXT STATEMENT
50

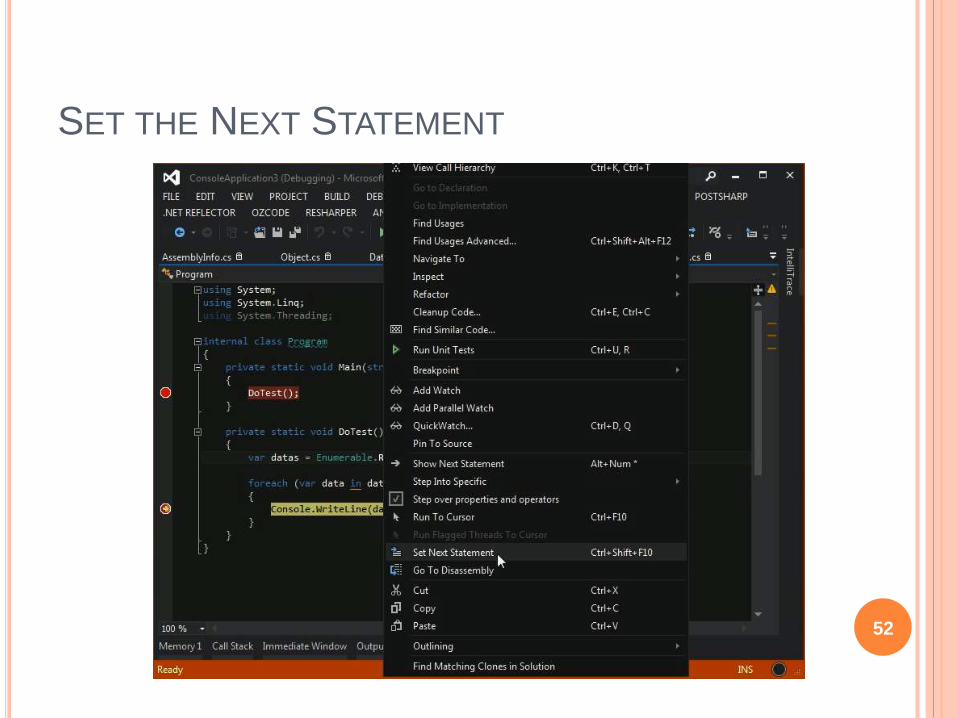
SET THE NEXT STATEMENT
Function
Move the execution point to set the next statement of code to be executed
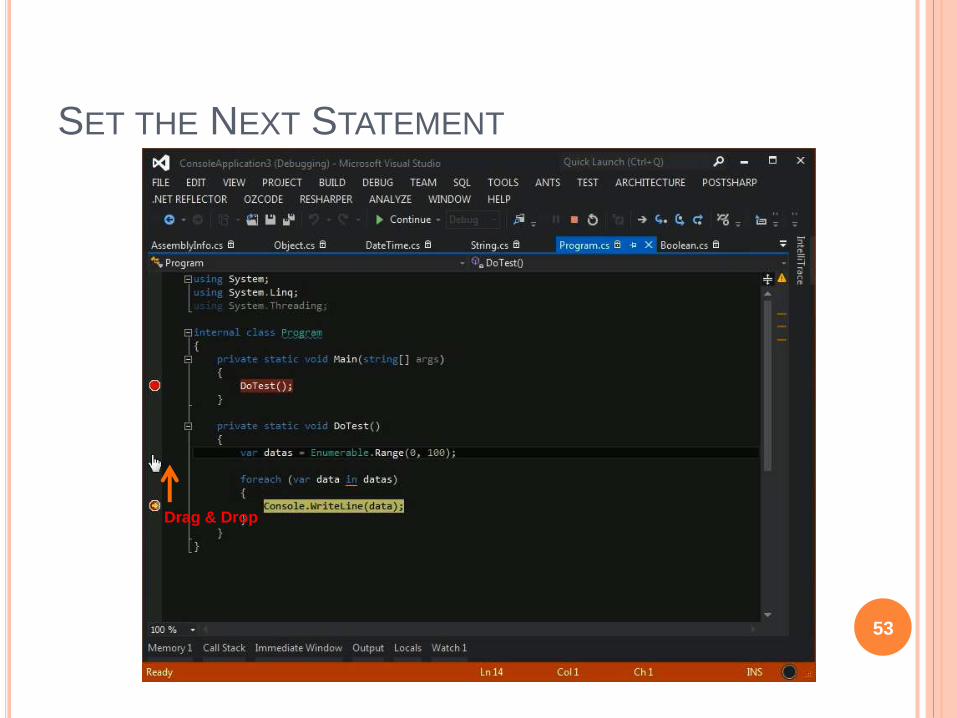
In a source window, click the yellow arrowhead and drag it to a location where you want to set the next statement (in the same source file), or
In a source window, right-click on the statement you want to execute next and choose Set Next Statement from the shortcut menu.
In the Disassembly window, right-click the assembly-language instruction that you want to execute next and choose Set Next Statement from the shortcut menu. 51
SET THE NEXT STATEMENT
52
SET THE NEXT STATEMENT
53
Drag & Drop

SET THE NEXT STATEMENT
54

EDIT AND CONTINUE
55

EDIT AND CONTINUE
Function
A time-saving feature that enables you to make changes
to your source code while your program is in break
mode
56

EDIT AND CONTINUE
57

EDIT AND CONTINUE
58
REFERENCE
59
REFERENCE
Breakpoints and Tracepoints
https://msdn.microsoft.com/en-us/library/ktf38f66(v=vs.90).aspx
Edit and Continue
https://msdn.microsoft.com/en-us/library/bcew296c.aspx
Debugger Tips, Tricks and Tools #6 - Gooey Bugs -Site Home - MSDN Blogs
http://blogs.msdn.com/b/jimgries/archive/2005/11/16/493431.aspx
[C#][Visual Studio]Debug With Object ID - Level Up-點部落 http://www.dotblogs.com.tw/larrynung/archive/2011/05/0
5/24296.aspx 60

REFERENCE
[Visual Studio]追蹤點(Tracepoint)的使用 - Level Up-
點部落
http://www.dotblogs.com.tw/larrynung/archive/2009/11/0
4/11399.aspx
How to: Set the Next Statement
https://msdn.microsoft.com/en-
us/library/09yze4a9%28VS.80%29.aspx
Start, Break, Step, Run through Code, and Stop
Debugging in Visual Studio
https://msdn.microsoft.com/en-us/library/y740d9d3.aspx
61

Q & A62

QUESTION & ANSWER
63