Embed Size (px)
Citation preview

TOPIC: DATA FLOW DIAGRAM
PRESENTED BY:
Shreya Chattopadhyay

DEFINITION:
A data-flow diagram (DFD) is a graphical representation of the "flow" of data through an information system.

PURPOSE OF DFD:to provide an indication of how data are
transformed as they move through the system.
to depict the functions (and subfunctions) that transform the data flow.
The DFD provides additional information that is used during the analysis of the information domain and serves as

DFD
DFD shows “ flow of Data”
Allows reader to determine
what kinds of data will be input to and output from the system, where the data will come from and go to,where the data will be stored .
FLOW CHART
Flow chart shows “ flow of Control ”
allows a reader to determine what operations will be performed, in what order, and under what circumstances.

COMPONENTS OF DFD:

. Entities/input-output:
The sharp cornered rectangles(or simply boxes) in a DFD indicates entities.
are called sources if they are external to the system and provide data to the system, and sinks if they are external to the system and receive information from the system
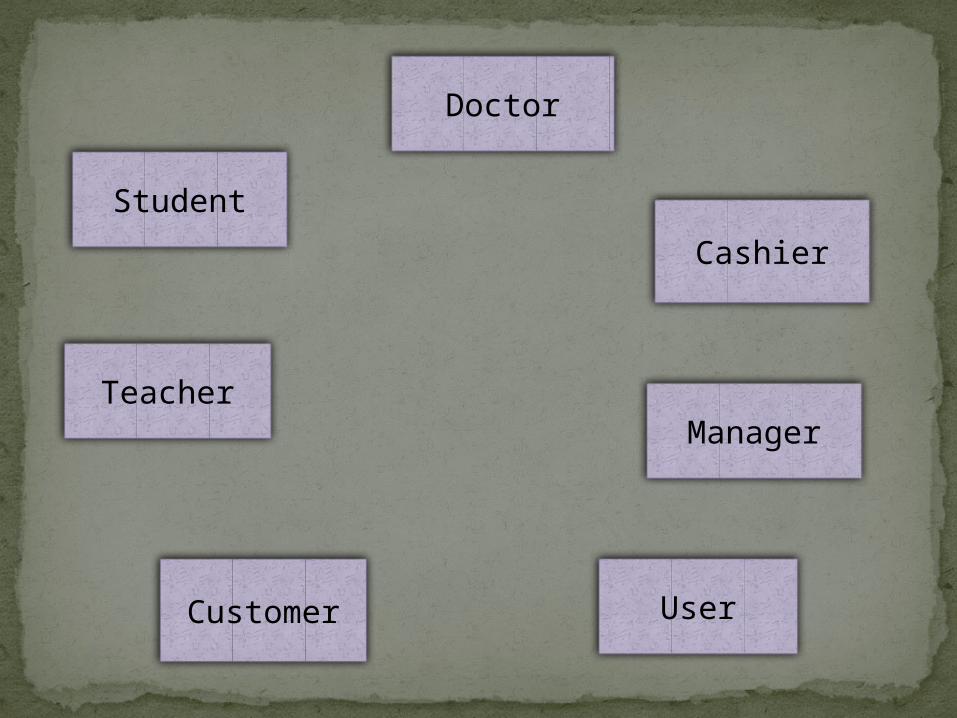
Student
Doctor
TeacherManager
Cashier
UserCustomer

Processes/functions:
The circles in a DFD indicate processes.The Process symbol represents an activity
that transforms or manipulates the data (combines, reorders, converts,Prints etc.).

Accounting System
Reservation System
Patient Administr
ation System
Marketing System
Grading System

Data Store:
Two parallel lines in DFD indicate Data Store
A Data Store is a repository of data.Data can be written into the data store.
This is depicted by an incoming arrow.Data can be read from a data store.
This is depicted by an outgoing arrow.Two data stores cannot be connected
by a data flow.
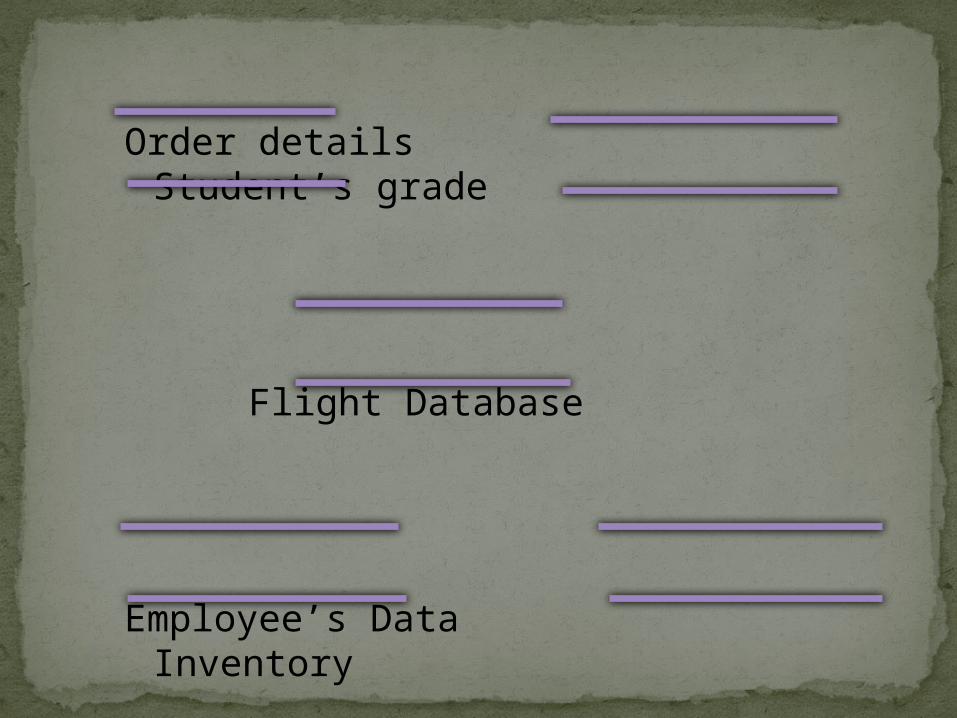
Order details Student’s grade
Flight Database
Employee’s Data Inventory

Data Flow:
Arrow symbol in DFD indicate data flow.
The Data Flow symbol represents movement of data.


Synchronous Operations:If two bubbles are directly connected by a
data flow arrow:They are synchronous

Asynchronous Operations:
If two bubbles are connected via a data store: They are not synchronous

How to draw DFD?Context Diagram :
The highest level in a data flow diagramContains only one process, representing
the entire systemThe process is given the number 0All external entities, as well as Major data
flows are shown

How to create context diagram?
Identify your main system
Identify the external people who interact with
the system
Decide what data these entities will enter into
the system
Determine what these entities expect as output
from the system

Level 1 DFD.
The basic module of the system are
represented in this phase and how data
moves through different module is shown.
The level 1 DFD provides a high –level view
of the system that identifies the major
processes and data stores.

Creating Child DiagramsEach process on diagram 0 may be exploded to create a
child diagramA child diagram cannot produce output or receive input
that the parent process does not also produce or receiveThe child process is given the same number as the parent
processProcess 3 would explode to Diagram 3Entities are usually not shown on the child diagrams
below Diagram 0If the parent process has data flow connecting to a data
store, the child diagram may include the data store as wellWhen a process is not exploded, it is called a primitive
process

Example: RMS calculating software
Accept input numbers from the user: Validate the numbers,Calculate the root mean square of the input numbers
Display the result.


registers retrieves
& stores
DFD of Password Management Software
PasswordBook
System
0
Customer

Level 1:
select process retrieves pass
stores Pass
Save_Pass
Login Form
Authentication form
User’s accountProcess Executio
n
Exit

Level 2: