Embed Size (px)
Citation preview
Complex Systems
Session 2.
Pareto distribution, long-tails, scaling and self-similarity
Zipf’s law
SzEEDSM Complex Systems 2017

George K. Zipf (1902-1950)
SzEEDSM Complex Systems 2017
Rank-order plot
Zipf’s law (1941)

SzEEDSM Complex Systems 2017

Log-log plot
A power law relationship between two variables yields
a linear relationship between the logarithms of the quantities.
If we plot the quantities on a log-log plot we should see a
line.
SzEEDSM Complex Systems 2017

Zipf’s law
SzEEDSM Complex Systems 2017

City size distribution
SzEEDSM Complex Systems 2017

SzEEDSM Complex Systems 2017

SzEEDSM Complex Systems 2017

SzEEDSM Complex Systems 2017
SzEEDSM Complex Systems 2017

Vilfredo Pareto (1848-1923)
SzEEDSM Complex Systems 2017

Pareto principle
80/20 rule
Italian land ownership
British tax records
Peapods in Pareto’s
garden
SzEEDSM Complex Systems 2017

Pareto distribution
Tail distribution
Power law tail
Long tail
Fat tail
α= 1+ ε
epsilon is a symbol of a small number
SzEEDSM Complex Systems 2017

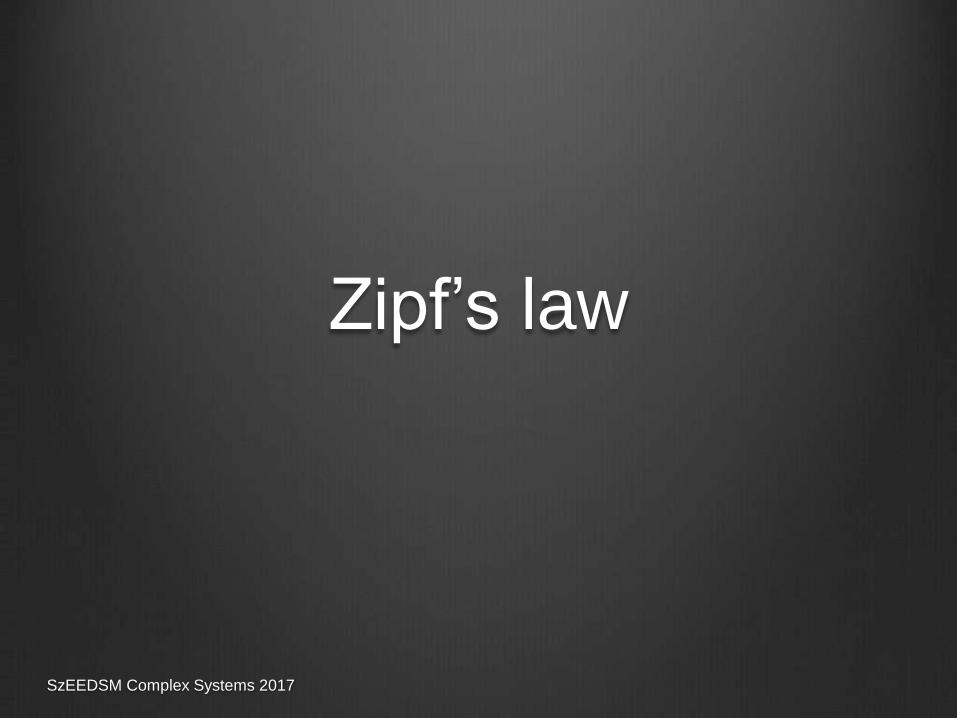
The 80/20 rule
SzEEDSM Complex Systems 2017

The 80/20 rule
SzEEDSM Complex Systems 2017

Inequality and Gini coefficient
SzEEDSM Complex Systems 2017
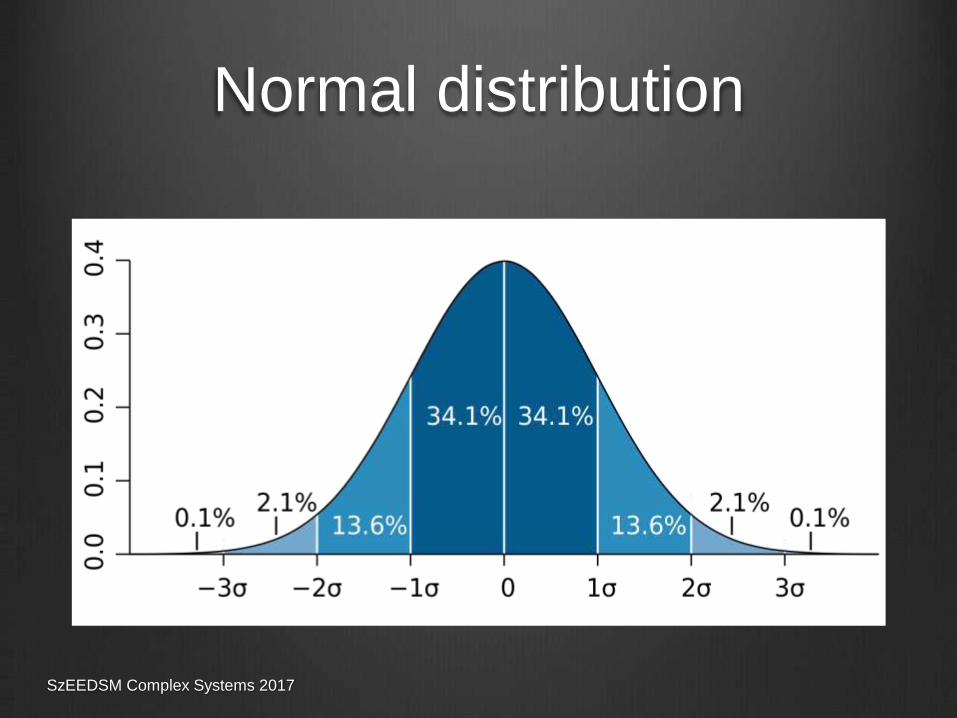
Normal distribution
SzEEDSM Complex Systems 2017

Complementary cumulative
distribution or Tail Distribution
SzEEDSM Complex Systems 2017

The Power Law DistributionPower law distributions are ubiquitous, occurring in diverse phenomena, including city sizes, incomes, word frequencies, and earthquake magnitudes.
Power laws easy to spot on log-log (doubly logarithmic) plots:
Power Law PDF - Linear Scale Power Law PDF – Log-Log scale
α=0.5α=1.0α=2.0

Scale invariance
and self-similarity
SzEEDSM Complex Systems 2017

Scale invariancePareto: distribution of wealth exceeding a minimum xm
Change the SCALE and take those, who exceed xt
Pareto remains the same on the new SCALE x/xt
There is a lack of natural SCALE in the problem
Only Power Laws are invariant under change of scaleSzEEDSM Complex Systems 2017

Scaling (scale invariance)
Distribution of height of people is NOT scale invariant.
Humans do have a typical height scale (1-2 meters).
There are no 10 m tall humans.
Tallness is not power law distributed
Number of people you can relate to (Dunbar number) 150
Number of years you can live (no one lived for 150 years)
Number of followers 1,10,100,1000,…,10 million
Number of sexual partners 1,10,100,1000 ...
Attraction, hype, fanship ...SzEEDSM Complex Systems 2017

Self-similar objects:
Fractals
SzEEDSM Complex Systems 2017

Benoit Mandelbrot (1924-2010)
SzEEDSM Complex Systems 2017

Mandelbrot set Z2+C
SzEEDSM Complex Systems 2017

SzEEDSM Complex Systems 2017

SzEEDSM Complex Systems 2017

Internet vs. Phone
SzEEDSM Complex Systems 2017

Lorenz Attractor
SzEEDSM Complex Systems 2017

The Universe
SzEEDSM Complex Systems 2017

Coastline of Britain
SzEEDSM Complex Systems 2017

Barnsley Fern
SzEEDSM Complex Systems 2017

Fractal dimension
SzEEDSM Complex Systems 2017

Fractal Dimension
SzEEDSM Complex Systems 2017

Urban Scaling
SzEEDSM Complex Systems 2017

SzEEDSM Complex Systems 2017

Metabolic rate of mammals
SzEEDSM Complex Systems 2017

Road length vs. GDP
SzEEDSM Complex Systems 2017

Scaling vs. complexity
SzEEDSM Complex Systems 2017

Scaling and Politics
SzEEDSM Complex Systems 2017

Universality
Biology
City
Land ownership
Japanese company
sales
Retail industry
Earthquakes
…
SzEEDSM Complex Systems 2017