Embed Size (px)
Citation preview


2
Outline • Aim and scope of the Smart boiler project
• Process of the development phases – air and fuel
• Description of the type of sensors and the integration
• Introduction to LoadCycleTest
• Impact of fuel versus boiler
• Results of successful integration of components as basis for a smart boiler
– Including results showing reduction potential with the intelligent boiler
• Outlook, perspective and benefits from a smart boiler

3
Aim and scope of the project • Nationally funded by the Danish EPA
• Cooperation between NBE production and Danish Technological Institute(DTI)
• Research and development project
• Scope – Development of a smart boiler by introducing a measurements techniques in the boiler for
improvement of the combustion, reduce the emissions and provide the user with a boiler that is optimized for use and not for testing.

4
Idea of the smart boiler

5
Idea of the smart boiler – Information to the end-user

6
Description of the development phases 1. Towards actual control of air
– Essential to be able to adapt the amount of air to the amount of fuel added
2. Measurement of added fuel – Essential to know the actual mass of fuel in order to optimize combustion
3. Development and definition of a LoadCycleTest – Development of boilers for use in real life
7
Type of sensors and integration in the boiler - Air
• Venturi flow meter
8
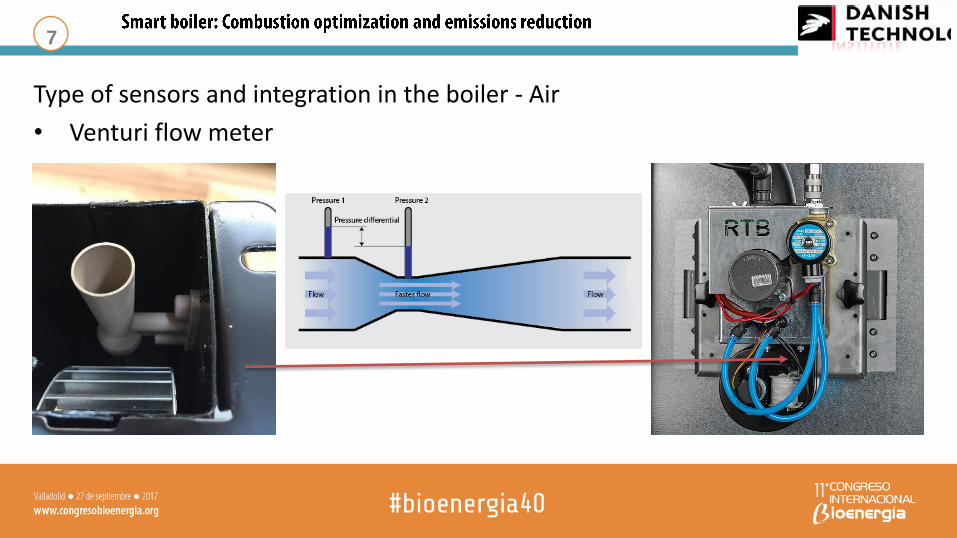
Type of sensors and integration in the boiler - Fuel
• Acustic technique for measurement of mass
Low load Low load Nominal load Nominal load

0,00
2,00
4,00
6,00
8,00
10,00
12,00
0:00 2:24 4:48 7:12 9:36 12:00 14:24 16:48 19:12 21:36 0:00
kW
TID
Spring
Kenneth_85 Kongsgaden m mike
mtjell togmanden Gennemsnit
9
LoadCycleTest - Why is it relevant?
0,00
2,00
4,00
6,00
8,00
10,00
12,00
0:00 2:24 4:48 7:12 9:36 12:00 14:24 16:48 19:12 21:36 0:00
kW
TIME
Summer
Kenneth_85 Kongsgaden m mike
mtjell togmanden Gennemsnit
0,00
2,00
4,00
6,00
8,00
10,00
12,00
0:00 2:24 4:48 7:12 9:36 12:00 14:24 16:48 19:12 21:36 0:00
kW
TID
Fall
Kenneth_85 Kongsgaden m mike
mtjell togmanden Gennemsnit
0,00
2,00
4,00
6,00
8,00
10,00
12,00
0:00 2:24 4:48 7:12 9:36 12:00 14:24 16:48 19:12 21:36 0:00
kW
TIME
Winter
Kenneth_85 Kongsgaden m mike
mtjell togmanden Gennemsnit
10
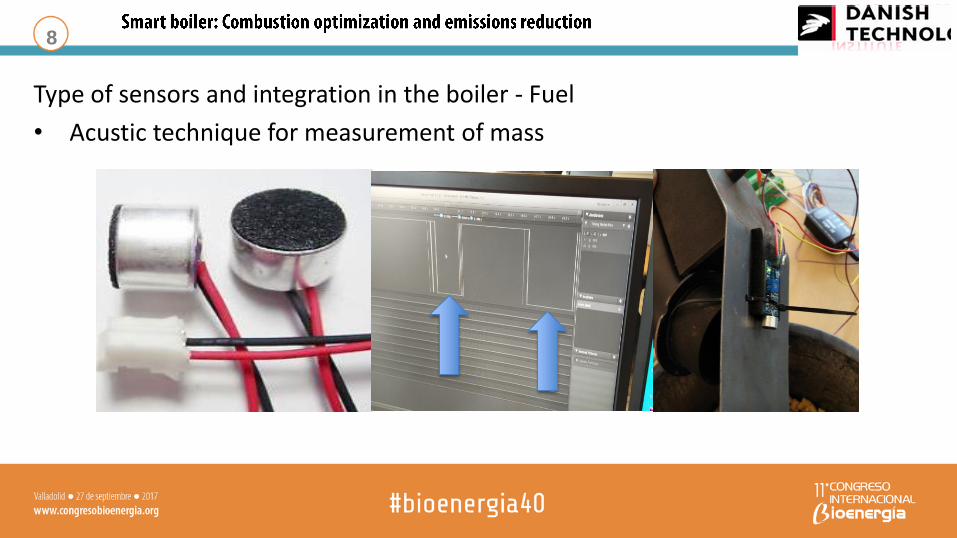
LoadCycleTest
• Initially 24 h with 4 seasons included
• Next step 24 h testing per season(72h) – Spring/Fall
– Summer
– Winter
• Stress test of system
• Realistic test of system performance – Efficiency
– Emissions
0%
20%
40%
60%
80%
100%
0 2 4 6 8 10 12 14 16 18 20 22 24
Po
wer
ou
tpu
t se
tpo
int
Hours
24h
24h

11
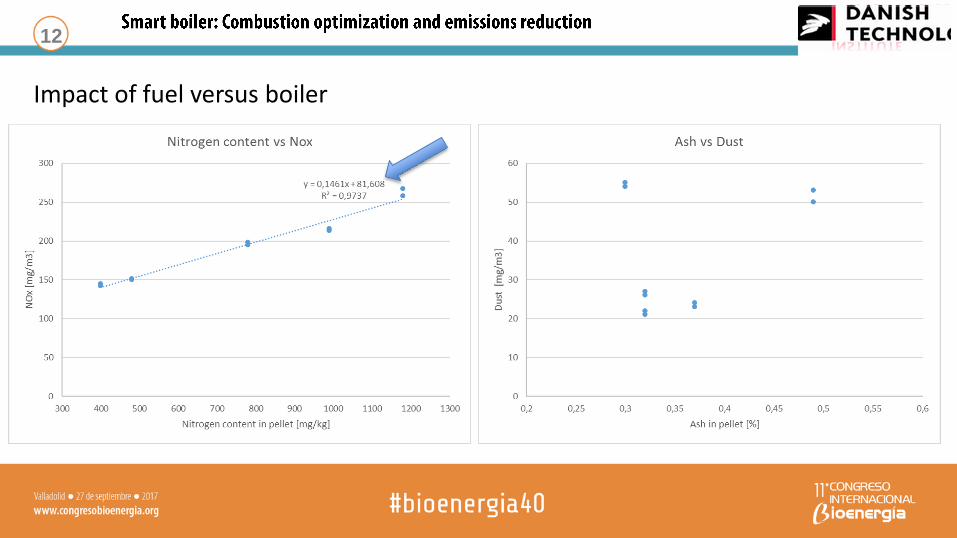
Scientific results - Identification of correlation between fuel and emissions
As Ak Bs Bk Cs Ck Ds Dk Es Ek N [mg/kg] 400 400 780 780 480 480 990 990 1180 1180
Calorific value [MJ/kg] 19,18 19,18 18,73 18,73 19,12 19,12 18,37 18,37 19,11 19,11
Ash content [%] 0,32 0,32 0,49 0,49 0,37 0,37 0,3 0,3 0,32 0,32
Prefix s – Skamol in burner
Prefix k – Ceramic in burner
12
Impact of fuel versus boiler

13
Results of successful integration of components as basis for a smart boiler
14
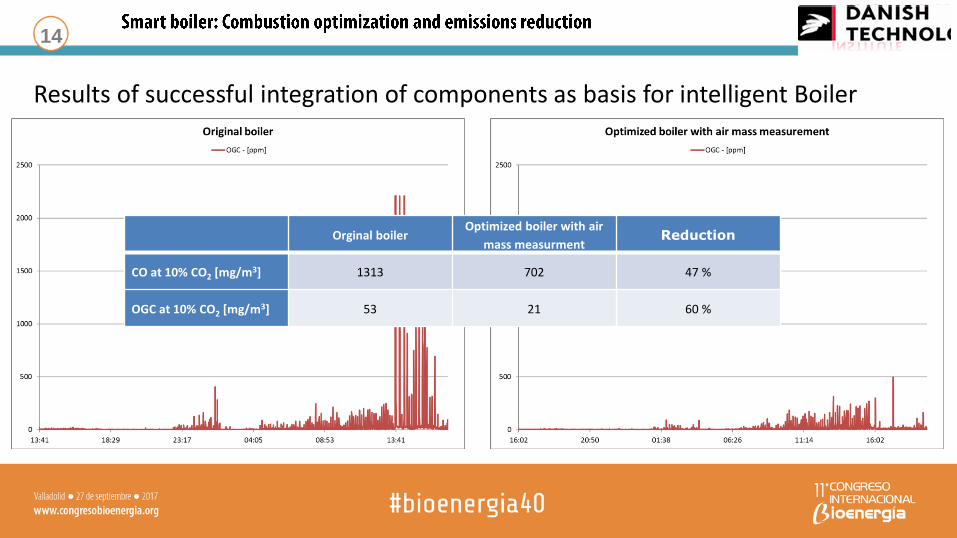
Results of successful integration of components as basis for intelligent Boiler
Orginal boiler Optimized boiler with air
mass measurment Reduction
CO at 10% CO2 [mg/m3] 1313 702 47 %
OGC at 10% CO2 [mg/m3] 53 21 60 %
15
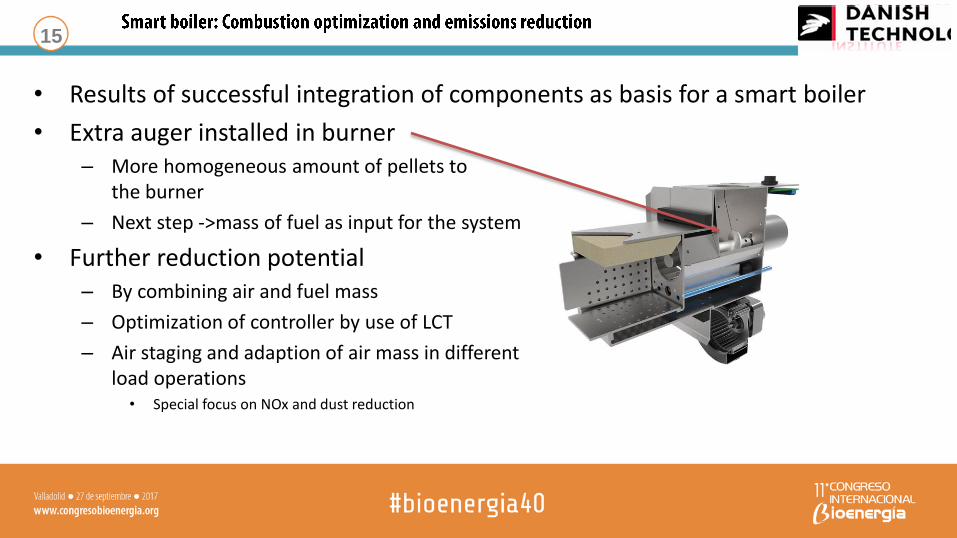
• Results of successful integration of components as basis for a smart boiler
• Extra auger installed in burner – More homogeneous amount of pellets to
the burner
– Next step ->mass of fuel as input for the system
• Further reduction potential – By combining air and fuel mass
– Optimization of controller by use of LCT
– Air staging and adaption of air mass in different load operations
• Special focus on NOx and dust reduction

16
Outlook, perspective and benefits from a smart boiler
• Improved emissions during real life emissions
• Feedback to the user – Active customer service
– Trouble shooting on the entire system
– Feedback on user-behavior of heating systems
– Service contracting
• Future possibilities – New optimized algorithms can be added directly
– System can be extended to suggest improved overall heating system of the house
• Solar heat/power, heat storage, distribution to the house etc.
– Direct ordering of fuel based on data collected

17
•
•
•