Embed Size (px)
Citation preview

1
monitoring water networks
David KennyUK Regional Director, TaKaDu9th February 2015
Big Data in the Water Sector:Integrated Water Network Management

World Economic ForumGlobal risks 2015
Water Crisis – highest impact risk

World Economic ForumGlobal risks 2015
The International Energy Agency projects water
consumption will increase by 85% by 2035 to meet the needs of energy generation
and productionGlobal water
requirements are projected to be pushed
beyond sustainable water supplies by
40% by 2030

World’s population
x3
Water consumption
x6
In the 20th century:

Lifestyle = Water
7,000 L Cotton t-shirt
11,000 LHamburger
15,000 L Pair of jeans

6
We have an addiction!
We love…

Recognition to: ABB, i2O, Gutermann,
Incertameter, HWM, Primayer, Syrinix,
SebaKMT, Technolog

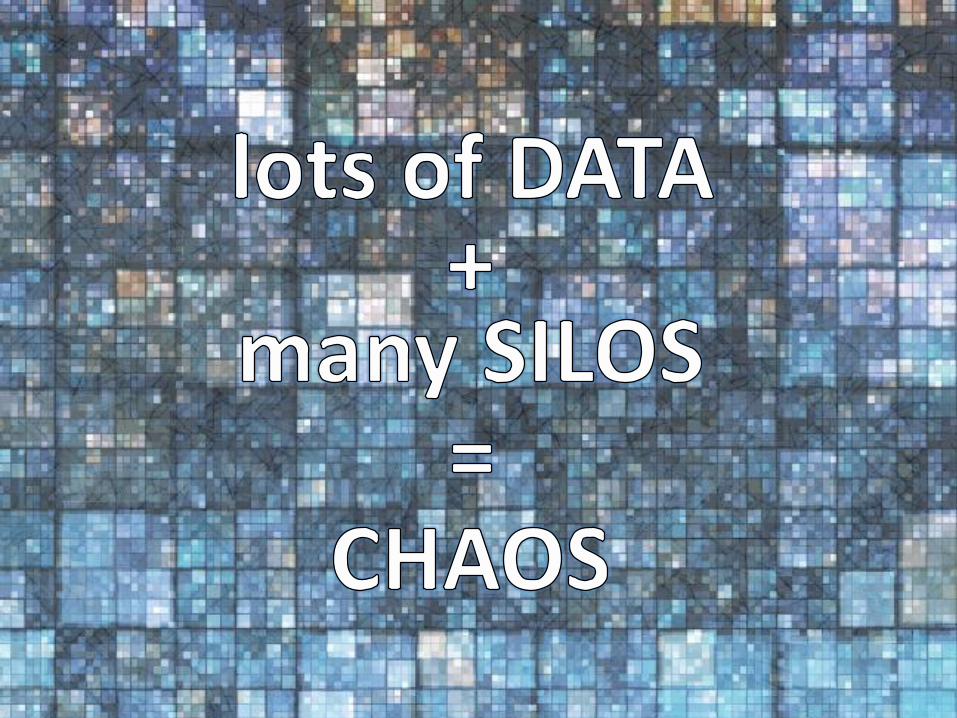
Utilities collect millions of pieces of data each day
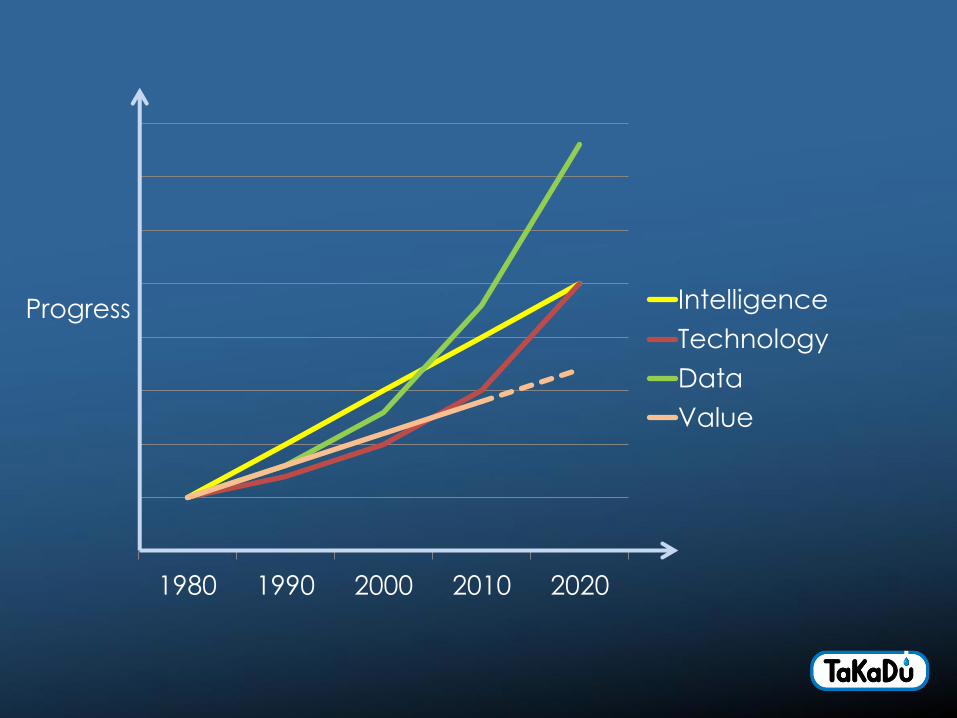
1980 1990 2000 2010 2020
Intelligence
Technology
Data
Value
Progress
10
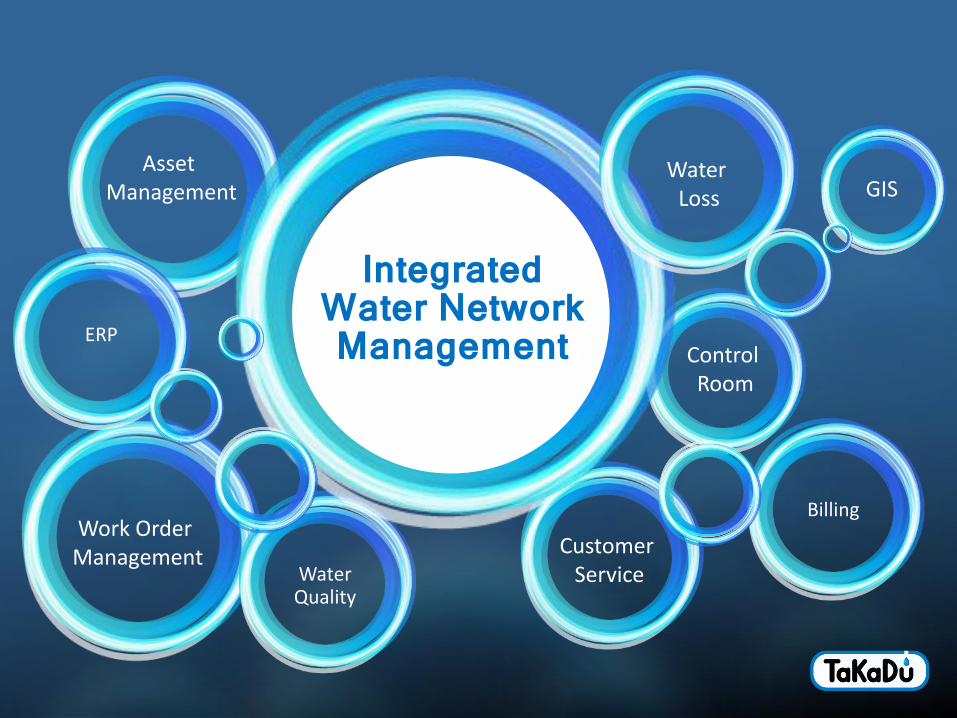
ERP
Billing
Water Quality
GIS
Integrated Water Network Management
Water Loss
Asset Management
Control Room
Customer Service
Work Order Management
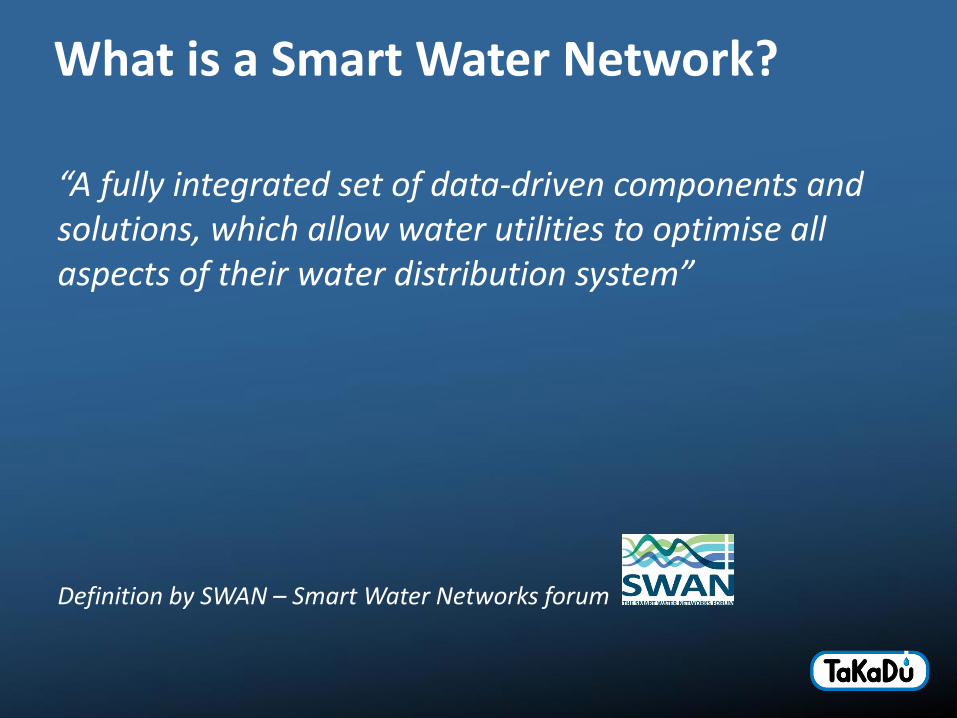
What is a Smart Water Network?
“A fully integrated set of data-driven components and solutions, which allow water utilities to optimise all aspects of their water distribution system”
Definition by SWAN – Smart Water Networks forum

A leak is born
A smart water solution detects, measures and locates it
A job is automatically raised, prioritised and scheduled
Automated street works approval!
The repair team arrives with correct schematic and equipment
The leak is repaired
Smart technology confirms that everything is back to normal
Fantasy network – the leaky dream

14
Are older pipes worse performers?
0
5
10
15
20
25
30
35
40
45
50
0-10 10-30 30-50 50-80 80+
Age vs repairs
all
repaired
x2
x1.5
x1/4
x2
%
Dataset: 19 DMAs; 28k pipes; 500 repairs
15
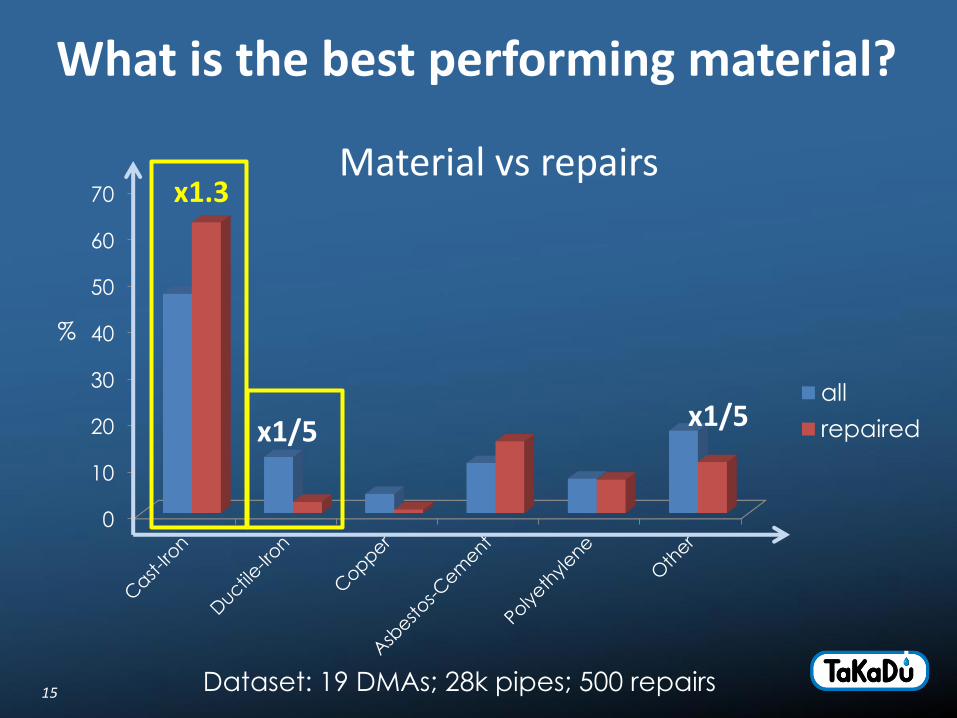
0
10
20
30
40
50
60
70
Material vs repairs
all
repaired
x1.3
x1/5
Dataset: 19 DMAs; 28k pipes; 500 repairs
%
What is the best performing material?
x1/5

Big DataCloud Computing
Smart AnalyticsSaaS Model

SaaS paradigm shift
Set up in 5 weeks
No customer testing
Free upgrades
Free training
Web-based software
Unlimited users

REAL-LIFE EXAMPLES
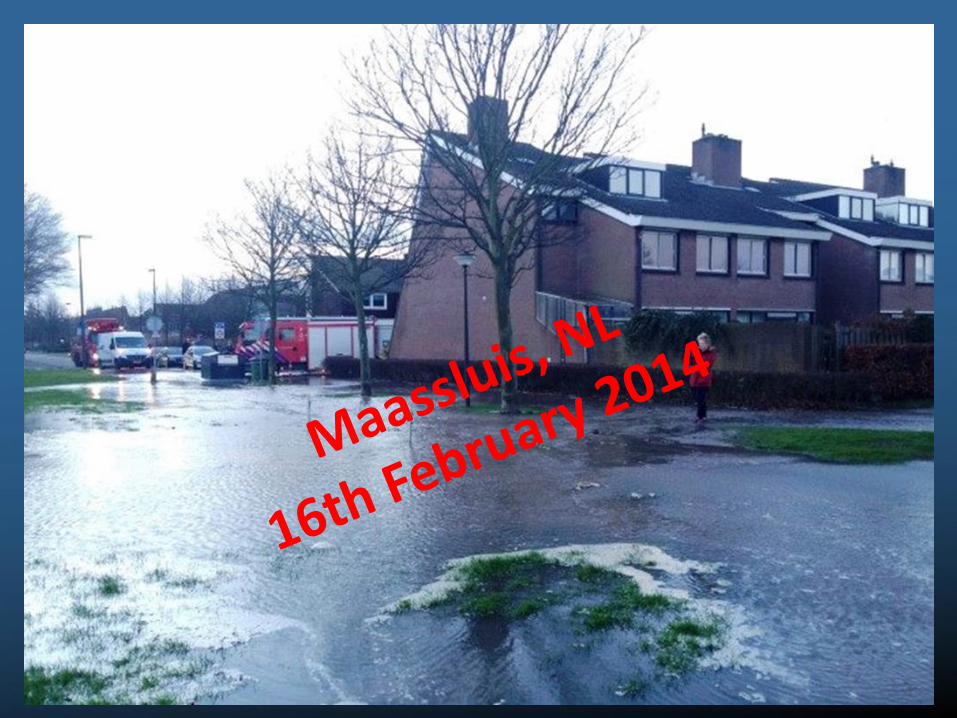
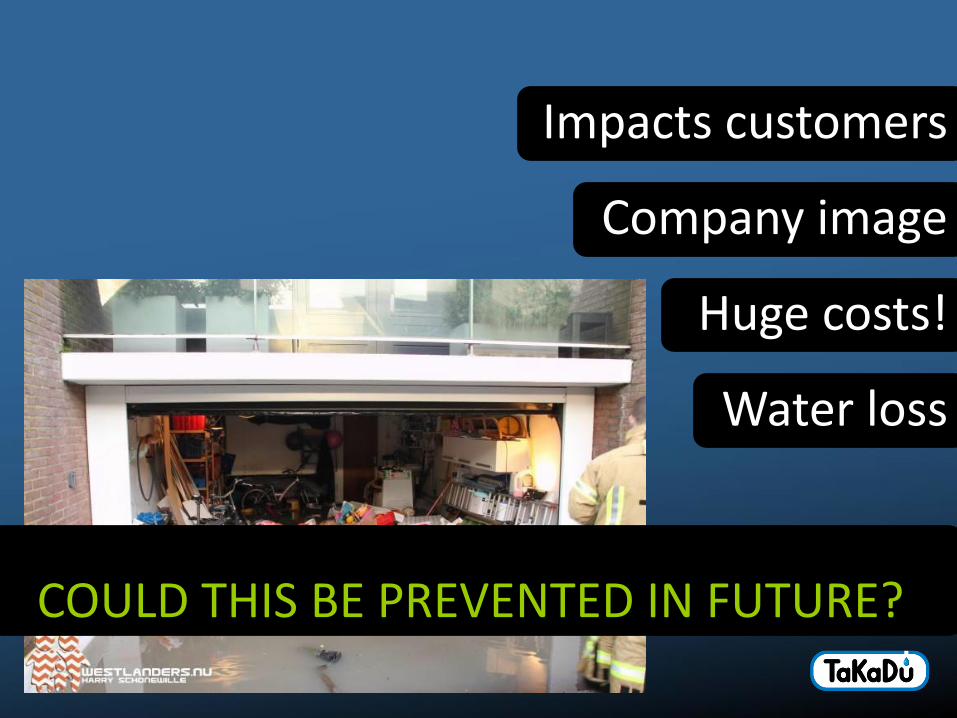
Impacts customers
Company image
Huge costs!
Water loss
COULD THIS BE PREVENTED IN FUTURE?

Event recognition using TaKaDu

Early detection

TaKaDu’s algorithms
• Learn network behaviour patterns • Predict expected future behaviour• Statistically compare readings to predicted behavior to
detect anomalies
Event recognition is based on two prediction types:
• Historic prediction historical data for same area• Network prediction current behaviour across the
network• Together they improve detection accuracy, reducing false
alarms
TaKaDu’s unique prediction algorithms

Appears to be a leak
Reciprocal effect on adjacent DMA
Breach detection using TaKaDu

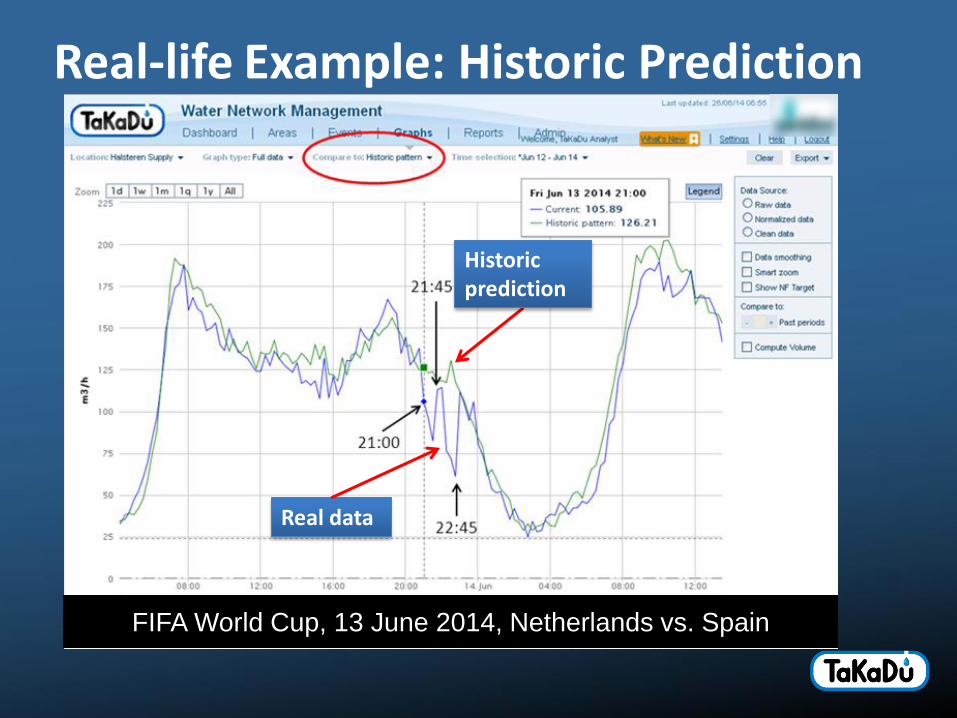
Real-life Example: Historic Prediction
Historic prediction
Real data
FIFA World Cup, 13 June 2014, Netherlands vs. Spain
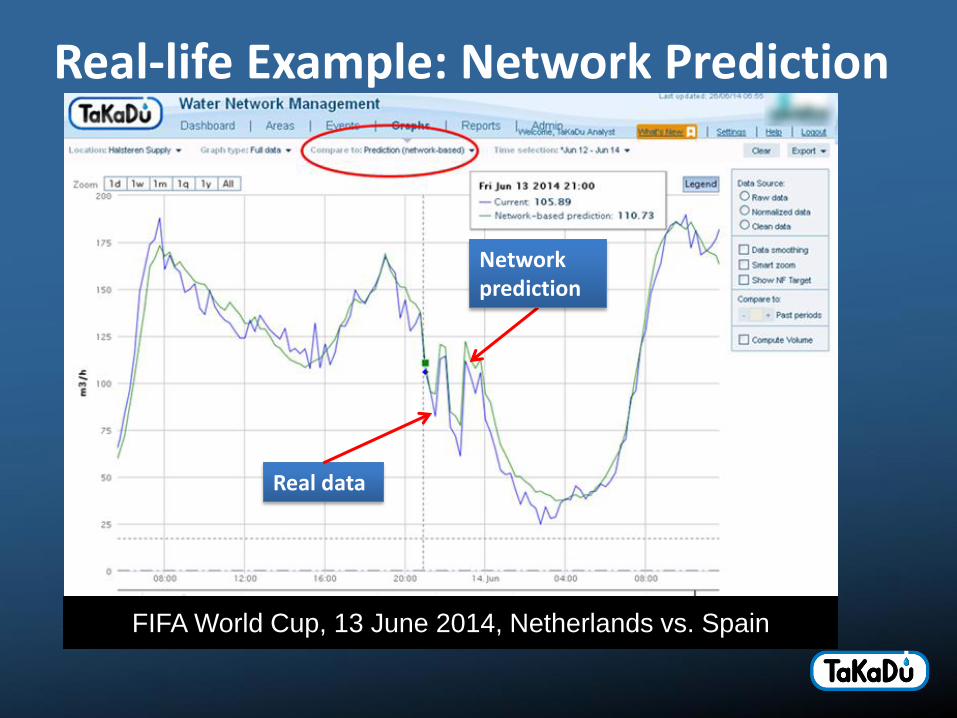
Real-life Example: Network Prediction
FIFA World Cup, 13 June 2014, Netherlands vs. Spain
Networkprediction
Real data


THANKS