Embed Size (px)
Citation preview
PROFIBUS is the digital fieldbus technology with the highest distribution worldwide, providing advantages for all types of applications.
Even with proper installation, however, the operating reserves of the fieldbus communication will progressively decrease and, in the end, may lead to severe communication failures causing immediate production downtimes and considerable financial losses. Thus it is essential to continu-ously keep an eye on the PROFIBUS network. This task is supported by appropriate diagnostic tools.
This White Paper discusses the state-of-the-art of diagnosing PROFIBUS networks and provides helpful hints for avoiding a communication breakdown and resulting unplanned production downtimes.
White Paper
Best Practice in PROFIBUS Network Diagnostics
EXECUTIVE SUMMARY

White Paper
Table of Contents
1. Introduction ............................................................................................................................. 1
2. PROFIBUS Overview ............................................................................................................. 2
3. Diagnosing a PROFIBUS Network ......................................................................................... 8
3.1 Physical Analysis of PROFIBUS DP Networks .................................................................... 9
3.1.1 Cable Test ...................................................................................................................... 9
3.1.2 Topology Scan .............................................................................................................. 11
3.1.3 Quality Index ................................................................................................................ 13
3.1.4 Signal-to-Noise Ratio .................................................................................................... 14
3.1.5 Rise Time ..................................................................................................................... 15
3.1.6 Signal Waveform in Oscilloscope Display ..................................................................... 16
3.2 Physical Analysis of PROFIBUS PA Networks .................................................................. 17
3.2.1 DC Voltage Measurement ............................................................................................. 17
3.2.2 Signal Voltage .............................................................................................................. 17
3.2.3 Bit Rate Deviation ......................................................................................................... 18
3.2.4 Polarity ......................................................................................................................... 18
3.3 Logical Analysis of PROFIBUS Networks .......................................................................... 18
3.3.1 Baud Rate .................................................................................................................... 18
3.3.2 Live List ........................................................................................................................ 19
3.3.3 Network Information ..................................................................................................... 19
3.3.4 PROFIBUS Master Information .................................................................................... 20
3.3.5 PROFIBUS Slave-Informationen .................................................................................. 20
3.3.6 Frame Analysis ............................................................................................................. 21
4. Approaches for Analyzing a PROFIBUS Network ................................................................. 22
4.1 General Notes on Analyzing a PROFIBUS Network .......................................................... 22
4.2 Interpreting the Quality Index ............................................................................................ 22
4.3 Use Case: Acceptance of a PROFIBUS Network .............................................................. 24
4.4 Use Case: Troubleshooting a PROFIBUS Network ........................................................... 25
4.4.1 Troubleshooting a Working PROFIBUS Network .......................................................... 25
4.4.2 Troubleshooting a Non-Working PROFIBUS Network .................................................. 26

White Paper
5. Analysis Tools for PROFIBUS Networks ............................................................................... 27
5.1 Mobile PROFIBUS Diagnostics Tool ................................................................................. 27
5.2 PROFIBUS Diagnostics Software ..................................................................................... 28
5.3 Stationary PROFIBUS Diagnostics Tool ............................................................................ 30
6. Summary .............................................................................................................................. 32
7. Terminology Related to PROFIBUS Diagnostics .................................................................. 35
8. About Softing ........................................................................................................................ 39
9. Authors ................................................................................................................................. 40
10. References ........................................................................................................................... 40
11. List of Figures ....................................................................................................................... 41
12. List of Tables ........................................................................................................................ 41

Best Practice in PROFIBUS Network Diagnostics 1
White Paper
1. Introduction
Available for more than 20 years, the PROFIBUS standard today offers a mature digital fieldbus technology. It is used in factory as well as process automation applications and can also be found in hybrid industries like food and beverages or pharmaceuticals. In addition, PROFIBUS is also applicable in other markets like building automation and railway applications. PROFIBUS is thus the only fieldbus technology serving all these different application areas.
According to the PROFIBUS & PROFINET International (PI) association about 51 million PROFIBUS devices were sold by the end of 2014 and this number is still growing rapidly. This large installed base suggests PROFIBUS as a leading fieldbus technology which definitely will be relevant for years, if not decades, to come. Consequently, PROFIBUS installations can be found all over the world, often comprising several thousand devices.
As PROFIBUS acts as the communication backbone of production plants, its reliable operation is essential for optimal plant productivity. Nonetheless, application malfunctions can be experienced during commissioning as well as operation and often, besides peripheral faults, this behavior is caused by physical faults. Due to the fact that PROFIBUS is a very mature and robust technology, the causes of these failures typically are not a deep technical issue. Rather, the real problem often is simply a faulty connector or an incorrect bus termination.
However, finding the root of an observed faulty behavior is not always an easy feat: For instance, the PROFIBUS communication may only malfunction occasionally or errors may be detected in seemingly unrelated parts of the overall network. Also, earthing faults may be slowly damaging the fieldbus operation, creating a general distrust in the overall network.
Various types of tools are available for detecting PROFIBUS malfunctions. They provide a wide range of functionality for conducting cable tests, electrical signal analysis and logical network analysis. This White Paper discusses the different measurements that can be performed for a PROFIBUS network and describes the best practice to keep the fieldbus up and running throughout the complete communication life cycle and to avoid expensive unplanned production downtimes.
As extensive documentation regarding the correct installation of a PROFIBUS network is available, this topic is not addressed in this White Paper.

Best Practice in PROFIBUS Network Diagnostics 2
White Paper
2. PROFIBUS Overview
PROFIBUS (PROcess FIeld BUS) is a world leading fieldbus communication standard in automa-tion technology. It supports the digital data exchange within a network using a single bus cable, resulting in a high data transmission reliability. Based on numerous protocol extensions, it provides solutions for a wide range of application areas including manufacturing and process automation (see Figure 1).
Figure 1: Different Market Segments Supported by PROFIBUS (Source: PROFIBUS & PROFINET International)
In 1993, the PROFIBUS Decentralized Peripherals (DP) standard was released, focusing on the simple and fast deterministic communication between controllers and remote I/O field devices (sensors and actuators).
In the different application areas PROFIBUS typically uses the EIA-485 transmission technology as the physical layer unless it is not applicable due to specific requirements (e.g. power supply to the field devices via the bus cable, heavy interference, or long distances). EIA-485 is based on a shielded copper cable with a pair of twisted wires providing an impedance of 150 Ω. It allows the connection of up to 126 stations to one PROFIBUS DP network1, supporting a linear bus topology. For ensuring a defined bus idle voltage (also called “quiescent level”) on the transmis-sion lines while no frames are being exchanged and for minimizing the line reflections, each end of a PROFIBUS DP segment is connected to a terminator. Transmission rates from 9.6 KBit/s to 12 MBit/s are supported. PROFIBUS DP enables the non-reactive coupling and de-coupling of stations and the incremental commissioning of the overall PROFIBUS network. In particular, this allows the subsequent expansion of the network without affecting stations already in operation.
1 A PROFIBUS network including more than 32 stations has to be structured in segments using repeaters. Each segment may contain up to 32 stations, including the repeater(s). The combination of the individual segments can be seen as one logical PROFIBUS network.

Best Practice in PROFIBUS Network Diagnostics 3
White Paper
The PROFIBUS Data Link Layer is defined by the Fieldbus Data Link (FDL) protocol. Within this protocol a Token Passing method defines the network access (see Figure 2). It differenti-ates between master stations (stations controlling the data exchange via the fieldbus) and slave stations (sensors and actuators responding to individual read requests or receiving data via the fieldbus) and controls the timeslots of the individual masters.2 Based on this master/slave tech-nology, the fieldbus is accessed and the reliable data exchange between PROFIBUS stations is performed.
The PROFIBUS DP standard defines different versions. The PROFIBUS DP-V0 version provides the basic functionality of the communication protocol, including, in particular, cyclic communication and device-, module- and channel-specific diagnostics for quick fault localization (both for commu-nication faults as well as application-specific errors, e.g. “Excess Temperature” or “Short Circuit on Output”). The PROFIBUS DP-V1 version supplements the PROFIBUS DP-V0 version with functionality for acyclic communication, i.e. supporting tasks of intelligent stations, such as param-eterization, operation, monitoring, alarm handling, and maintenance. For this purpose PROFIBUS DP-V1 defines the online access to fieldbus stations via engineering tools. In comparison to PROFIBUS DP-V1, the PROFIBUS DP-V2 version provides extended functionality, including time synchronization, isochronous real-time functionality as required for drive control as well as time-stamping and slave-to-slave communication.
PROFIBUS DP defines different device types which are described in Table 1.
2 The timeslots of the individual masters are defined as part of the (offline) configuration process. The user has to ensure that every master receives a timeslot which is long enough to perform all its communication tasks and that all the data exchange between the individual masters and the various slaves is performed in real-time with minimal time overhead.

Best Practice in PROFIBUS Network Diagnostics 4
White Paper
PROFIBUS DP Device Type
Description
PROFIBUS DP Master Class 1
The PROFIBUS DP Master Class 1 controls the communication process for exchanging process values with individual slaves using the defined cyclic commands during the configured timeslots.3
Typical PROFIBUS DP Master Class 1 devices include controllers and PCs.
PROFIBUS DP Master Class 2
The PROFIBUS DP Master Class 2 accesses the fieldbus by using acyclic services.4 These allow the configuration and parameterization of intelligent field devices.
Engineering and operator panels typically act as PROFIBUS DP Master Class 2.
PROFIBUS DP Slave The PROFIBUS DP Slave is a peripheral device that reads input information and sends output information to the periphery. The amount of supported input and output information depends on the device; a maximum of 246 Bytes of input data and 244 Bytes of output data can be processed.
Table 1: PROFIBUS DP Device Types
Different network architectures are supported based on the PROFIBUS DP device types from Table 1, providing a high flexibility. These architectures include:
• Single Master Network Here only one master station (PROFIBUS DP Master Class 1) is connected to the PROFIBUS DP network during operation. While a controller acts as the central control unit, the individual slaves are connected to the fieldbus at remote locations. The single master network provides the shortest fieldbus cycle time.
• Multi Master Network Here several master stations (PROFIBUS DP Master Class 1 and PROFIBUS DP Master Class 2, respectively) are connected to the PROFIBUS DP network. These either build individually independent sub-networks, each consisting of one PROFIBUS DP Master Class 1 and the appropriate slaves, or they include additional stations for development and diagnostics. While all masters can read the input and output values of the slaves, only the PROFIBUS DP Master Class 1 station configured for this slave is allowed to write the output values of a particular slave.
3 The PROFIBUS DP Master Class 1 can also use acyclic services as defined by the Master Slave Acyclic Communication of Class 1 (MSAC_C1).
4 These services are defined by the Master Slave Acyclic Communication of Class 2 (MSAC_C2). Despite the name acyclic services can be performed by the PROFIBUS DP Master Class 2 on a regular time base, e.g. for providing data as required by a SCADA system.

Best Practice in PROFIBUS Network Diagnostics 5
White Paper
Figure 2 shows a PROFIBUS DP architecture example illustrating the data exchange of one PROFIBUS DP Master Class 1 station and one PROFIBUS DP Master Class 2 station based on the Token Passing method.
Figure 2: Cyclic and Acyclic PROFIBUS DP Communication (Source: PROFIBUS & PROFINET International)
The capabilities of individual PROFIBUS devices are described by the General Station Description (GSD) and the Electronic Device Description (EDD) files. The GSD file contains the key data of an individual PROFIBUS device, information about its communication capabilities and, e.g. diag-nostic values. It supplies all the information necessary for the cyclic exchange of measured values and manipulated variables between the field device and the PROFIBUS master, and supports the configuration of the PROFIBUS network. The EDD provides additional information describing application-specific functions and the parameters of complex field devices. It comprises a descrip-tion of the device capabilities exchanged acyclically, including graphics-based options, and device information such as order data, materials, maintenance instructions, etc.5
5 EDD files are primarily used in PROFIBUS Process Automation (PA) applications.

Best Practice in PROFIBUS Network Diagnostics 6
White Paper
In 1996, the PROFIBUS Process Automation (PA) application profile was released. It uses the PROFIBUS DP communication technology and especially addresses process automation needs. PROFIBUS PA is suitable for use in hazardous and potentially explosive areas (Ex zones 0 and 1). Thus, in contrary to using the transmission technology EIA-485 for PROFIBUS DP networks, the data transfer in PROFIBUS PA networks typically is performed based on Manchester Coded Bus Powered (MBP)6, which is capable of supplying power to the individual field devices via the bus wire. As a consequence, the wiring overhead can be reduced significantly. PROFIBUS PA requires a passive line termination at each end of the network.
MBP communication requires only 8 Bits for encoding a character.7 Thus, PROFIBUS PA meets the requirements for a much simpler and safer installation and incorporates all the benefits of digital transmission right down to the field device. PROFIBUS PA also supports intrinsically safe applications providing explosion protection by limiting the power supplied by the bus or the installa-tion components in the field. It is widely used in chemical, oil, and gas industry applications.
The MBP transmission technology basically supports a variety of different topologies, including linear and simple tree structures. In practice, the “Trunk & Spur Topology” (see Figure 3) has established itself as the de-facto standard, as it is particularly clear and well laid out. Thanks to the technically mature installation technologies available on the market, it also exhibits a high degree of robustness. The overall length of a segment may not exceed 1,900 m, and the length of the spurs in intrinsically safe applications is limited to 30 m and must be taken into account when calculating the overall length.
PROFIBUS PA is based on the PROFIBUS DP-V1 version. It uses the PROFIBUS DP protocol at a data transfer rate of 31.25 KBit/s and is connected to a PROFIBUS DP network by using a coupling device such as a segment coupler or a link. PROFIBUS DP then acts as a backbone network for transmitting process signals to the controller.
6 The Manchester Coded Bus Powered transmission technology has been developed and standardized independently of the PROFIBUS communication and addresses the demands of process automation. MBP is used by other fieldbuses as well, e.g. by FOUNDATION™ fieldbus H1.
7 In comparison, standard PROFIBUS DP uses the serial UART NRZ (Non-Return-to-Zero) communication, which is based on 11 Bit character encoding.

Best Practice in PROFIBUS Network Diagnostics 7
White Paper
Figure 3: Trunk & Spur Technology Used by PROFIBUS PA and Coupling of PROFIBUS PA Segments to PROFIBUS DP8 (Source: PROFIBUS & PROFINET International)
The PROFIBUS PA application profile defines functions and parameters for process control devices, such as transmitters, actuators, valves, and analyzers. These functions and param-eters are used to adapt the devices to the respective application and process conditions. The functions are based on Function Blocks, and the associated parameters are classified as input, output, and internal parameters. The PROFIBUS PA application profile also determines how the various services of the PROFIBUS communication protocol are used. This means, for example, that process data that is exchanged cyclically is based on a standard format for all devices. In addition to the measured value and/or manipulated measurement value, this format also features a status supplying information about the quality of the value and possible limit violations. It thereby provides the foundation for harmonized applications, simplified engineering, device exchange-ability and increased reliability by means of standardized diagnostic information.
The latest version V3.02 of the PROFIBUS PA application profile especially addresses user requests for comprehensive diagnostic and status information as well as the requirements of system-oriented asset management for field devices within process automation applications.
8 As an alternative, the barrier can also be implemented within the segment coupling device. Here no barriers are required within the field distributors, but less electrical power is available.
Best Practice in PROFIBUS Network Diagnostics 8
White Paper
3. Diagnosing a PROFIBUS Network
A PROFIBUS network is a very sensitive transmission system with transfer characteristics in the VHF range, especially when using high transfer rates of 1.5 MBit/s or higher. It is therefore important to strictly follow the PROFIBUS & PROFINET International installation guidelines when setting up a PROFIBUS network.
Any deviation from an optimally installed bus line has a negative impact on the transmission behavior. In addition, any improperly installed connector, illegal spur cable or transition between two different cable types changes the impedance at that location and causes reflections that dete-riorate the signal.
To overcome this vulnerability, the PROFIBUS standard defines a very robust communication system for exchanging data between PROFIBUS Masters and Slaves. Its communication capabili-ties include specific robustness features, which ensure a reliable communication without loss of control and corrupt data even when communication errors occur. A PROFIBUS network installation according to the standard thus supports a communication operating reserve.
Each PROFIBUS frame contains some redundant information (parity bits, frame check sequence, specific start and end delimiters) providing bit error detection capabilities up to Hamming Distance 4. If, by those means, the receiving station detects an error, it does not respond and thus causes the sender to repeat the frame (up to seven times depending on the network configuration).
The existence of that operating reserve within a PROFIBUS network, however, may result in the status indicators showing a correct mode of operation at the individual controllers and devices of the network. This fact can lead a user to assume that the network is working properly, even if this is not true. Only when the rate of data corruption reaches a critical threshold will the fault become visible to the user. At this stage, however, the communication has typically already stopped and caused production downtime.
By analyzing the PROFIBUS communication in more detail, a progressive decrease of the operating reserves for the bus communication can be identified before the communication stops working. As soon as the user is aware of this decrease, corrective action can be taken to avoid unplanned downtime.
This chapter discusses the various types of PROFIBUS DP and PROFIBUS PA network analyses, including the physical measurement of the PROFIBUS cable, the electrical signal analysis as well as the communication analysis at the PROFIBUS frame level. As the physical layer differs between PROFIBUS DP and PROFIBUS PA, different analysis methods have to be applied here (see Sections 3.1 and 3.2, respectively). The PROFIBUS frame level, however, is identical for both protocols, allowing use of the same logical analysis methods for communication in PROFIBUS DP as well as PROFIBUS PA networks (see Section 3.3).

Best Practice in PROFIBUS Network Diagnostics 9
White Paper
Additional chapters will then provide some hints on how to combine the individual diagnosis methods efficiently to perform an overall analysis of PROFIBUS networks at different stages of the PROFIBUS installation life cycle, e.g. during commissioning of a PROFIBUS network or as part of preventive maintenance actions (see Chapter 4). Chapter 5 gives an overview about different types of tools that are available on the market for analyzing PROFIBUS networks.
3.1 Physical Analysis of PROFIBUS DP Networks
The physical analysis of PROFIBUS DP networks is performed at segment level. It comprises measurements of the PROFIBUS cables used, including the bus terminators, as well as the elec-trical signals of the EIA-485 transmission technology. The tests conducted refer to the physical layer of a PROFIBUS communication.
The physical analysis measurements make use of the differential signal mechanism defined for data transfer within PROFIBUS DP. The actual data signal is transferred via two signal lines (lines A and B) inverted to each other. For PROFIBUS DP communication the differential voltage defining the difference between the two signal lines A and B is interpreted digitally, either representing a logic 0 or logic 1 signal. Any faults occurring here can prevent a correct detection of the communi-cation bit stream.
The most commonly used connector for PROFIBUS DP is the 9-pin D-sub connector. Pin 8 is used for line A, pin 3 for line B. Individual PROFIBUS stations are connected using only these two lines via a twisted pair cable providing a shield in addition. Thus, a PROFIBUS cable connects just these two pins.
The goal of the physical analysis is the creation of a general bus status statement. For this purpose, the signals on the PROFIBUS line are recorded at different locations and times. These records are compared and analyzed to detect and locate physical problems that may lead to bus faults.
The physical analysis of PROFIBUS DP networks consists of different types of measurements. They are discussed in the following sections.
3.1.1 Cable Test
The cable test provides a first indication of the physical status of a PROFIBUS installation. It detects cabling faults, which may cause sporadic and non-reproducible errors due to interference susceptibility or even communication malfunctions.The cable test examines the cabling and the terminators of PROFIBUS segments by means of Time Domain Reflection (TDR) measurements. It determines the cable segment length, scans for unwanted reflections on the line and verifies the proper termination of the cable. Thus cabling errors like short circuits and broken wires or shields can be found.

Best Practice in PROFIBUS Network Diagnostics 10
White Paper
In detail, the cable test allows to detect the following cabling faults:• Wire or shield breakage• Crossed wires• Short circuits between the PROFIBUS signal lines A and B• Short circuits between the PROFIBUS signal lines A or B and the shield• Branch lines• Inhomogeneous line segments• Incorrect and non-powered terminators
The cable test is performed at either end of the PROFIBUS segment. It consists of three steps that have to be successively completed: First, the cable test is carried out on the open cable without terminators at either end of the segment. This step helps to detect the cable segment length, to check the proper installation of the cable and to determine whether non-conformant terminators or resistors have been installed. Next, the cable is tested together with the terminator at the other (remote) end of the line. This test identifies a defective bus terminator as well as a missing supply voltage for this bus terminator. In the third step, the cable test is performed with the terminators connected at both ends of the PROFIBUS segment. The successful pass of all these steps is a sign that the cabling has been properly installed.
In case of a fault an error description and, if possible, the distance from the test location are displayed as part of the cable test (see Figure 4 and Figure 5). This information can be used for troubleshooting.
Figure 4: PROFIBUS Cable Test Results (While the left screenshot shows the successful pass of the open cable test step, the right screenshot indicates a terminator error at the remote end of the cable.)

Best Practice in PROFIBUS Network Diagnostics 11
White Paper
Figure 5: Detailed Results from PROFIBUS Cable Test
The cable test requires that there is no PROFIBUS DP Master (e.g. controller) in the network. It can be performed regardless of whether PROFIBUS DP Slaves are connected and powered or not.
3.1.2 Topology Scan
The topology scan can be used as an indication of whether the cabling of the segments within a PROFIBUS network has been set up correctly.9 In the test a PROFIBUS Master simulator is connected directly to a powered terminator at either end of the network. The PROFIBUS Master simulator addresses each existing station and modifies the cable impedance while the station is answering, thus causing reflections on the bus. The time difference between the original and the reflected signal can be used to calculate the distance to the measured station. Based on the results, the sequence as well as the distances of all passive PROFIBUS Slaves from the PROFIBUS Master simulator are determined (see Figure 6).
9 A successful performance of the topology scan requires a properly installed segment cable that is free of unwanted reflections. Any failure during the topology scan suggests a faulty PROFIBUS cabling installation.

Best Practice in PROFIBUS Network Diagnostics 12
White Paper
Figure 6: Topology Scan Result Indicating a Healthy PROFIBUS Network
The topology scan requires that no PROFIBUS Master station, such as a controller or an MPI panel, is active in the PROFIBUS network during the measurement.10 To identify the overall topology including the individual PROFIBUS Masters, the relative distance of each master from the test location has to be entered manually after the topology scan.
For a plausibility check the topology scan can be repeated from the other end of the PROFIBUS network. If the two tests are largely comparable, the test results are likely to be correct. Proper cable installation and physical health of the PROFIBUS network11 can thus be assumed.
10 As a PROFIBUS Master simulator is used instead of regular PROFIBUS Masters during the topology scan, a different network load and communication behavior apply. Thus this setup cannot be used to examine the network load as well as the timing behavior of the actual PROFIBUS communication.
11 A key requirement to ensure the physical health of a PROFIBUS network is that bus terminators are powered and connected at both bus ends. In addition, all cables of the PROFIBUS network have to be connected correctly. Long dead-end branches, significant differences in the cable types, incorrect or missing bus terminators as well as additional PROFIBUS connectors that are not connected reduce the quality of the PROFIBUS network.

Best Practice in PROFIBUS Network Diagnostics 13
White Paper
3.1.3 Quality Index
The quality index12 combines an assessment of the voltage level and the signal waveform into a general statement about the physical transmission quality of the PROFIBUS communication for the individual stations in the network. The quality index summarizes different types of information describing the quality of a PROFIBUS network, including voltage measurements and the calcu-lated results for rise time, overshoots and undershoots as well as level drops caused by reflec-tions.
The quality index is based on a waveform scan with 16 samples per bit. The first 3 scans and the last 3 scans of each bit relate to the edges (rise and fall time) while the 10 scans in the middle are used to evaluate the signal quality.
To calculate the quality index, the PROFIBUS communication is analyzed for each station. A reference voltage is iteratively adjusted in several steps towards a final value for which there are less than 20 violations (glitches, edge and level errors) per 1,000 transferred bits from a particular PROFIBUS station. In other words, the quality index can be seen as the height of a rectangle that can be placed in the inner 10/16 of a bit without touching the signal waveform. As soon as the reference voltage has been determined, the test captures the number of glitch, edge and level errors that occurred at that voltage.
Thus, permanent signal distortions caused by the transmission line itself (e.g. reflections, signal “rounding” due to low-pass behavior) have a direct impact on the resulting quality index, whereas sporadic disturbances caused by external electromagnetic disturbances are not included in the quality index. Sporadic disturbances that concern less than 2% of the bits do not affect the quality index, either.
Figure 7 shows an example of the quality index display for a given test location, indicating the quality index of each station within the PROFIBUS network.
12 The PROFIBUS signal quality index is a criterion for assessing the physical quality of an electrical signal during the PROFIBUS communication. It has been defined by Softing and is used within the Softing PROFIBUS diagnostic tools.

Best Practice in PROFIBUS Network Diagnostics 14
White Paper
Figure 7: Quality Index Bar Graph of All Stations Showing Good Operational State (The test tool is connected to station 2. At this test location the quality index of station 2 is very high. The bars are sorted in topological order. The farther away a station, the lower its quality index.)
By monitoring the quality index for an extended duration, fluctuations in the quality index of a signal, e.g. during the course of a day or week, can be found. The long-term monitoring of the quality index, for instance, allows to detect electromagnetic disturbances which are caused by machines operated only temporarily, or which occur during the machinery start-up, e.g. at shift change. In addition, voltage or climatic fluctuations (like temperature or condensation changes) in the course of a day or week can be identified as well.
As with the topology scan (see Section 3.1.2) it is recommended to perform the quality index measurement from both ends of the PROFIBUS network. Network problems can then be located by comparing the results.
Section 4.2 gives tips on how to analyze a quality index diagram recorded at different test locations.
3.1.4 Signal-to-Noise Ratio
The signal-to-noise ratio indicates the frequency of deviations from the ideal signal waveform. These deviations can have external causes (electromagnetic disturbances) or result from detri-mental effects in the cabling (reflections, damping) or defective bus drivers in the stations. Distur-bances can also be coupled into the bus through a station. Even sporadic disturbances are detected using the signal-to-noise ratio.

Best Practice in PROFIBUS Network Diagnostics 15
White Paper
The signal-to-noise ratio refers to the minimum voltage difference between the logic 0 level and the logic 1 level of the PROFIBUS signal. It is defined by the interference-free range of the differ-ential voltage (see Figure 8) and indicates the level of vulnerability of the PROFIBUS communica-tion to disturbances at a specific station within the PROFIBUS network.
Figure 8: Definition of Signal-to-Noise Ratio Within PROFIBUS Signal
The signal-to-noise ratio is determined by adapting the reference voltage during ten iterations performed over ten frames of the tested station. During these steps any interference of the PROFIBUS signal that exceeds the higher or lower limit of the actual reference voltage during the evaluation period leads to a continuous adaptation of the reference voltage until the final value is reached. As a result, disturbances directly influence the measured signal-to-noise ratio.
3.1.5 Rise Time
The rise time (also called “edge steepness”) is another important aspect in the physical analysis of a PROFIBUS DP network. This test examines the transitions between the logic 0 level and the logic 1 level of the PROFIBUS signal and vice versa. Flattened edges reduce the time during which the appropriate voltage is applied constantly at the required level. In an extreme case this situation may prevent the receiver modules in PROFIBUS devices to correctly decode the trans-mission signal, thus resulting in transmission errors. As a rule of thumb the appropriate voltage has to be constantly applied at the required level for at least one half bit time.
Signal-to-NoiseRatio
SignalLevel
Time
Diff
eren
tial V
olta
ge
Evaluation Period
Best Practice in PROFIBUS Network Diagnostics 16
White Paper
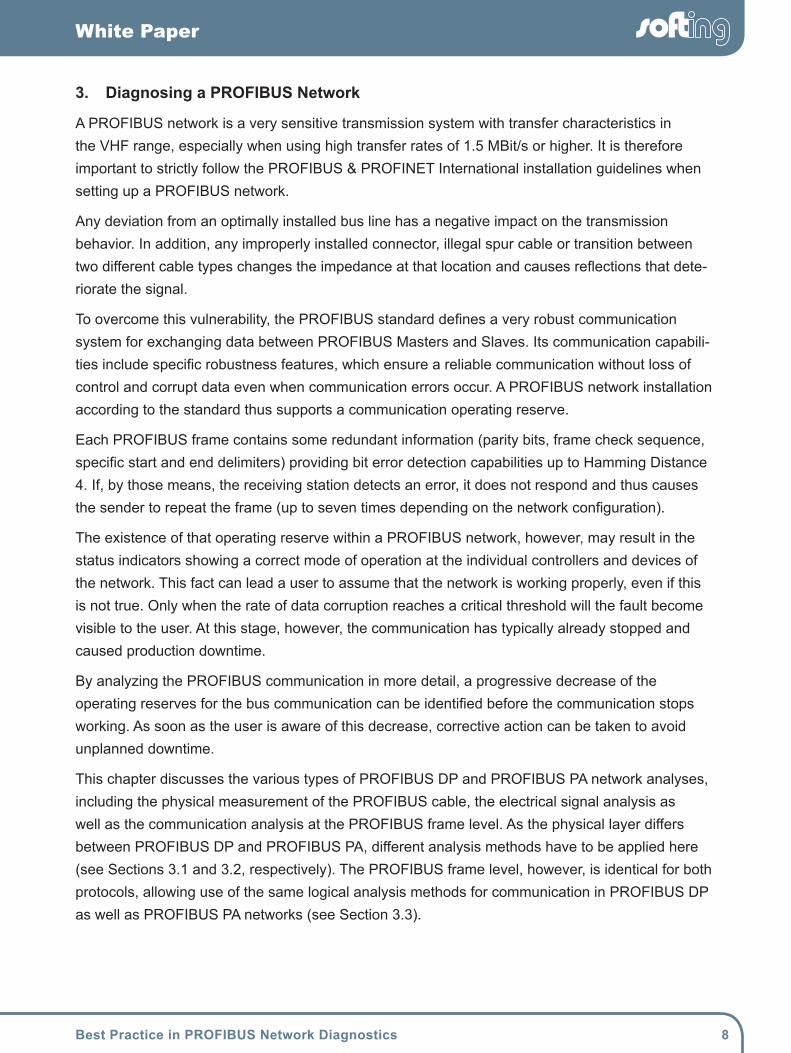
To determine the rise time, threshold voltage values are defined at 10% and 90% of the difference between the logic 0 level and the logic 1 level of the PROFIBUS signal. The time required for the differential voltage to change between these two threshold values is measured for both rising and falling edges. The resulting rise time and fall time indicate how close a PROFIBUS signal is to the ideal square waveform. The electrical properties related to the use of longer PROFIBUS cables or a data transmission at higher baud rates cause a “rounder” signal waveform due to the damping at high frequencies.
Figure 9: Example Display Showing the Rise Time of a PROFIBUS Communication
3.1.6 Signal Waveform in Oscilloscope Display
Another way to analyze the electrical signal of a PROFIBUS DP communication is to use the oscilloscope display, which shows the voltage signal waveform for line A and line B. The display is based on user-selectable triggers for recording the signal of a relevant frame. The signal waveform allows to detect distortions of the signal voltage waveform as well as reflections on the cable resulting from an incorrectly installed cable or physical faults within the network. The position of the reflections in the display as well as their length give an indication of the distance between the interference location and the current test location.
There are different modes which provide additional means for detecting disturbances: While the standard mode compares the signals on line A and line B, the other two modes allow comparing line A and line B, respectively, with the ground level. This functionality enables the detection of disturbances that affect the two signal wires in the same way and thus cannot be detected using the differential voltage.

Best Practice in PROFIBUS Network Diagnostics 17
White Paper
By analyzing the voltage signal waveform, various cabling issues can be identified. For instance, a transient signal dip may refer to the use of spur cables while a long reflection and signal dip may indicate the use of significantly different cable types. Other problems, such as short circuits or faults in the bus termination, can also be detected. In addition, the voltage signal waveform provides an indication of an unwanted load or an increased resistance between line A and line B.
The signal waveform allows a more accurate identification of different fault causes than is possible using condensed test results like the quality index (see Section 3.1.3) or the signal-to-noise ratio (see Section 3.1.4). The detailed interpretation of the signal waveform, however, requires experi-ence and expertise.
3.2 Physical Analysis of PROFIBUS PA Networks
The physical analysis of PROFIBUS PA networks is performed at segment level.
It comprises various measurements of PROFIBUS cables and electrical signals in PROFIBUS PA networks using the Manchester Coded Bus Powered transmission technology. The tests conducted refer to the physical layer of a PROFIBUS communication.
A PROFIBUS PA segment provides power to the connected stations. For this, a “power condi-tioner” applies a DC voltage of up to 32 V to the bus line. At the far end of the segment a minimum voltage of 9 V is required for proper operation. The PROFIBUS frames are transmitted as a symmetric AC signal on top of the DC supply voltage of roughly 900 mV peak-to-peak. When a PROFIBUS PA station transmits a frame, it modulates its current consumption of at least 10 mA according to the Manchester encoding scheme and thus generates an AC signal carrying the infor-mation of the frame. Due to a low-pass filter in the power conditioner the AC signal is not elimi-nated by the voltage regulation in the power supply.
The physical analysis of PROFIBUS PA networks consists of different types of measurements. They are discussed in the following sections. The individual physical analysis methods can be combined for an overall segment check to assess the physical health of the connected PROFIBUS PA segment.
3.2.1 DC Voltage Measurement
The DC voltage measurement determines the DC voltage of the connected PROFIBUS PA segment. PROFIBUS PA segments may have a length of up to 1900 m. As each station draws at least 10 mA from the bus, there is a voltage drop along the line. The standard requires a supply voltage in the range from 9 V to 32 V at any bus location. If the measured DC voltage is less than a user-configurable limit (typically 9 V) an error is displayed.
3.2.2 Signal Voltage
The signal level of the modulated AC signal is measured for each station and gives an indication of the signal quality. The nominal range is 700 mV to 1000 mV peak-to-peak.

Best Practice in PROFIBUS Network Diagnostics 18
White Paper
3.2.3 Bit Rate Deviation
The bit rate deviation from the nominal value of 31.25 KBit/s is measured for each station. The standard requires a deviation less than 0.2 %.
3.2.4 Polarity
This measurement detects the polarity of the communication signal for each station.
3.3 Logical Analysis of PROFIBUS Networks
As the PROFIBUS communication (PROFIBUS DP as well as PROFIBUS PA) takes place across the individual segments within the overall network, the logical analysis is performed at network level.
PROFIBUS DP and PROFIBUS PA both use the same protocol, which allows the application of the same methods for analyzing both networks at a logical communication level. The focus is on monitoring the PROFIBUS communication in order to assess the logical state of the PROFIBUS network and the connected stations from the acquired information. The logical analysis of PROFIBUS networks allows to identify parameter and configuration errors in the individual PROFIBUS stations as well as to analyze the PROFIBUS data, error frames and retries.
The logical analysis of PROFIBUS networks indicates that the PROFIBUS communication is working properly if no unwanted events like diagnostic messages, error frames, retries, etc. occur during standard data exchange between PROFIBUS Masters and PROFIBUS Slaves. However, the PROFIBUS communication is fault tolerant and does not require a perfect electrical situation.
This section describes different aspects of analyzing the communication in a PROFIBUS network.
3.3.1 Baud Rate
PROFIBUS DP supports a variety of transmission rates in the range from 9.6 KBit/s to 12 MBit/s. Thus, the first step in any logical network analysis is to determine the actual transmission rate.
Typically, a tool for performing the logical analysis of PROFIBUS networks is able to automati-cally detect the baud rate used. This is only possible, however, if there is traffic on the PROFIBUS network. Otherwise the transmission rate to be used for the logical network analysis has to be set manually. Specifying a baud rate that differs from the one actually used in the PROFIBUS network will result in detecting many frame errors. The logical analysis of PROFIBUS networks cannot be carried out correctly, either, in that case.

Best Practice in PROFIBUS Network Diagnostics 19
White Paper
3.3.2 Live List
Once the baud rate is set, the monitored PROFIBUS communication can be used to scan for PROFIBUS stations connected to the network. All stations participating in the communication are included in the live list.
For a graphical presentation of the live list, the pure list of connected PROFIBUS stations can be extended by additional station information, such as the assigned PROFIBUS station address, the detected station status or further details like the device name given in the station’s GSD file. An example of a live list is shown in the middle window shown in Figure 10.
3.3.3 Network Information
The network information provides an overview about the status of the PROFIBUS communication monitored in the PROFIBUS network. The details available at this level include, for example, the minimum/average/maximum bus cycle durations as well as the number of observed retry frames, diagnostic messages and restarts of PROFIBUS stations (derived from the identification of param-eterization frames). An example of the displayed network information can be seen in Figure 10.
Figure 10: Network Information Display

Best Practice in PROFIBUS Network Diagnostics 20
White Paper
3.3.4 PROFIBUS Master Information
The PROFIBUS Master information summarizes the specific characteristics of the individual PROFIBUS Masters available in the PROFIBUS network. They are derived from the analysis of the logged PROFIBUS communication.
The PROFIBUS Master information includes the individual station addresses used by the PROFIBUS Masters within the PROFIBUS network as well as the current operating states. A distinction is made between the regular data exchange, the stopped operation without any cyclic data exchange as well as the state in which input data is read but no output data is written and which may cause PROFIBUS Slaves to switch to the fail-safe state if this state is supported. Furthermore, the PROFIBUS Master information comprises the following: the current poll cycle defined by the duration of the complete set of cyclic communication frames exchanged between the PROFIBUS Master and all the PROFIBUS Slaves; the idle time resulting from 33 bit times plus an additional delay depending on the actual bus parameters; and the slot time derived from the timing behavior of the various PROFIBUS stations.
3.3.5 PROFIBUS Slave-Informationen
All the PROFIBUS DP versions (PROFIBUS DP-V0 through to PROFIBUS DP-V2) define diag-nostic information on the slave, including standard diagnostics as well as device-specific diagnos-tics.
The logical analysis of the PROFIBUS communication delivers very detailed information on the individual PROFIBUS Slaves, including general information about each PROFIBUS Slave. If the slave´s identification number is recorded, it is possible to provide vendor and device model details. The contents of the respective GSD file can also be used to display meaningful diagnostic messages or the vendor and device model. In addition, information about the cyclic input and output as well as the acyclic data of this device can be shown.
If a PROFIBUS Slave is (re-)started during the analysis period, the PROFIBUS Master sends a parameterization frame to this slave. The parameters given in this frame include a minimum set of parameters defined by the standard as well as additional application-specific parameters. To decode these parameters, the appropriate GSD file for the PROFIBUS Slave has to be available.
In response to a (re-)started PROFIBUS Slave the PROFIBUS Master checks the configuration by transmitting a configuration frame. The configuration information in this frame is displayed. For modular I/O devices this information can be accompanied by additional details on the indi-vidual module structure, which is obtained from the appropriate GSD file, if available. When the PROFIBUS Slave is running stable, however, no configuration information is provided.
Best Practice in PROFIBUS Network Diagnostics 21
White Paper
If an error or an exception occurs within a PROFIBUS Slave, the slave notifies the PROFIBUS Master of this situation by setting the diagnostic flag as part of a cyclic response. The PROFIBUS Master then gathers additional information on the error or exception from the slave by using the PROFIBUS GetDiag service. Individual errors and exceptions that have occurred during the analysis period can be listed.
The diagnostic information derived from the PROFIBUS communication can be divided into three groups: Device-specific diagnostic information is based on a freely defined device-specific byte string, which requires the device GSD file for decoding. The identifier-specific diagnostic informa-tion describes individual faults that have occurred with a certain set of I/O data, e.g. for a specific module. Identifier-specific diagnoses can be further detailed using channel-specific diagnoses, which indicate an error type for each I/O channel. Frequently occurring error types are pre-defined in the PROFIBUS standard while other error types can be specified by the device manufacturer by assigning text in the associated GSD file. The PROFIBUS DP-V1 standard defines additional diagnostic messages, e.g. for adding and removing remote I/O modules.
3.3.6 Frame Analysis
Frame sequences can be recorded during the logical analysis of the PROFIBUS communication. For starting and stopping the recording, various trigger conditions are available. Frame filters can be applied while recording or at a later stage when analyzing the recorded frames. Filter conditions are based on selected station addresses and/or services. All recorded frames contain time stamps with a resolution of 10 ns to allow for timing analysis. The recorded frames are presented in a decoded display format for detailed analyses on different protocol layers.

Best Practice in PROFIBUS Network Diagnostics 22
White Paper
4. Approaches for Analyzing a PROFIBUS Network
4.1 General Notes on Analyzing a PROFIBUS Network
When analyzing a PROFIBUS network some general points should be kept in mind.13
Like all electrical lines, PROFIBUS cables have ohmic resistance, capacitance and inductance. In addition, the bus drivers of the bus stations are ohmic and capacitive loads. Therefore, the voltage levels and the signal waveform determined at different locations on the same PROFIBUS network can differ significantly.
Furthermore, crossed wires or interrupted lines cause a failure of the PROFIBUS network from the fault location onwards. Corroded contacts in connectors can significantly weaken the signal from the fault location onwards.
To find these faults, it is recommended to measure the signal quality at different locations on the bus, at least at both line ends. If a PROFIBUS network comprises multiple segments connected through repeaters, each segment has to be measured separately.
One way to find the cause of an observed problem is to divide the complete PROFIBUS network into smaller segments and to test these using a PROFIBUS Master simulator. While this approach only allows to test the PROFIBUS network step by step, it is a reliable way to locate physical issues.
4.2 Interpreting the Quality Index
A key criterion in analyzing and assessing a PROFIBUS network is the quality index (see Section 3.1.3). The measured quality index depends on the station type and the overall length of the currently tested cable segment.
If the overall length of the PROFIBUS network is relatively short and the bus has been recently installed and commissioned, all measured quality indexes should be significantly above 4,00014. For a longer segment, the quality index will decrease with increasing distance. A lower measured quality index can also be observed for tests taken from the other end of the PROFIBUS cable, if the baud-rate dependent maximum cable length has not been exceeded.
A measured quality index below 2,500 always indicates defective cabling and/or connectors or incorrect network terminators.
13 In general, it is important to understand that all PROFIBUS diagnostic tools influence the PROFIBUS transmission behavior. This applies particularly to the individual test locations, i.e. the location where the diagnostic tool is connected to the fieldbus.
14 The Softing quality index ranges between 0 and 5,000. A gradual deterioration of the quality indexes of the PROFIBUS stations from the test location to the remote end of the fieldbus is standard behavior and caused by the cable’s resistivity. A long cable length in combination with older EIA-485 drivers may result in a quality index of less than 4,000, which in this case is not an indication of PROFIBUS problems.

Best Practice in PROFIBUS Network Diagnostics 23
White Paper
While a PROFIBUS installation with a measured quality index of 1,000 may still be running, the operating reserves for the bus communication are definitely almost depleted and the noise immunity is very low, resulting in sporadic faults.
For evaluating the quality index of the various stations within a PROFIBUS network it is recom-mended to combine the quality index measurement with the topology scan (see Section 3.1.2) and to review the quality index of the individual stations in topological order.15
If a station shows a low quality index while the quality index of the neighboring station is at a normal level, the cause is usually related to that station. For instance there may be a problem at the PROFIBUS connector. On the other hand, if a complete group of neighboring stations shows a low quality index, the cause is related to the PROFIBUS cabling between the last station with a good quality index and the first station with a bad quality index. Here it is a good idea to repeat the PROFIBUS analysis from the other end of the bus line and to compare the results. If a significant drop in the quality index can be seen at the same location when measuring from both sides, the contact resistance is too high there. If the location of the quality index drop differs between the measurements from the two ends of the PROFIBUS line, a wire break and an interruption of the fieldbus are a probable cause.
A gradual deterioration of the quality indexes from the test location to the remote end of the bus is basically normal and caused by the resistivity. An excessive drop in the quality index, however, indicates a poor transmission behavior of the bus.
If tests performed at different locations show considerable quality index differences, the cause may be reflections due to different cable types, spur cables or connectors as well as missing bus termi-nators. The error cause can be found near the test location that delivered the worst quality index results (see Figure 11).
Figure 11: Example of the Quality Index Measured from Either End of the PROFIBUS Segment (Here the terminating resistor is missing at the beginning of the bus, near station 2.)
15 In case of cable defects or unwanted reflections on the cable, the topology scan will not deliver reliable results. In this case the user has to manually sort the individual stations in topological order.

Best Practice in PROFIBUS Network Diagnostics 24
White Paper
4.3 Use Case: Acceptance of a PROFIBUS Network
After installation the acceptance of a PROFIBUS network is a very important step to document the status of the PROFIBUS network at an initial stage before starting the daily production. The network status test results that are documented during the acceptance test are very useful for verifying the proper performance of the PROFIBUS network after maintenance activities.
The cable test (see Section 3.1.1) can be used as a first test during the installation and commis-sioning phase of a PROFIBUS network. The installer can directly check the assembled cable system after laying the cable and screwing together the PROFIBUS connectors. Very often installation and commissioning of the PROFIBUS cable are performed by different field service personnel. In this case the person in charge of commissioning the PROFIBUS network can carry out cable testing in order to verify that the PROFIBUS cable segments have been properly installed. It is also a good idea to create a test report containing detailed information about the tested cable segments during the acceptance of a PROFIBUS network.
Another indicator of a healthy PROFIBUS network is the result of a topology scan (see Section 3.1.2). The successful detection of the correct PROFIBUS network topology proves that the physical network installation, including proper termination at both ends, has been performed correctly and that the cable segment is free of unwanted reflections.
The next step is to run a network analysis based on the network information (see Section 3.3.3). In this test the PROFIBUS network traffic is logged for some time (i.e. longer than 10 minutes) and checked for retry frames. A low number of retry frames indicates that the PROFIBUS has been configured correctly and that the individual PROFIBUS Slaves are working properly and are correctly connected to the network.16
The quality index of the individual PROFIBUS stations is determined next (see Sections 3.1.3 and 4.2). Besides taking a snapshot of the quality index of the individual PROFIBUS stations it is also important to perform this measurement over a prolonged period of time to be able to detect fluctu-ations of the communication quality during this period. The test should run for at least one produc-tion cycle in order to ensure that every component which could affect the quality index has been tested (e.g. trailing cables and sliding contacts were moved). This step also monitors the signal waveform (see Section 3.1.6) by means of the oscilloscope function to check the signal voltage of the PROFIBUS stations.
In the last step a long-term analysis is conducted over several hours to ascertain the communica-tion quality of the PROFIBUS physics as well as the PROFIBUS communication (e.g. by checking the number of communication faults, retry frames, etc.).
16 The requirements regarding a maximum tolerable number of retries within a certain time period strongly depend on the application. In slowly running control systems (e.g. water treatment) with long reaction times, the occurrence of retries has hardly any impact on the application. On the other hand, in fast running control systems (e.g. bottling plants) or in feedback control systems, the occurrence of retries may have a considerable impact on the operational availability and stability of the application. Here there should be no retry frames during acceptance of a network. However, within systems running in an electromagnetically polluted environment, retries might be inevitable.

Best Practice in PROFIBUS Network Diagnostics 25
White Paper
Figure 12: Detailed Test Report Summarizing the Results of a PROFIBUS Network Acceptance Test
The result of a PROFIBUS network acceptance test is documented in a formal report comprising the network analysis results. The contents of the test report can be adapted with a configuration tool to suit individual needs (see Figure 12).
4.4 Use Case: Troubleshooting a PROFIBUS Network
The individual measurement methods described in Chapter 3 help to troubleshoot at least partially working PROFIBUS networks as well as PROFIBUS networks that are not working properly any longer or that sporadically or continuously stop working.
4.4.1 Troubleshooting a Working PROFIBUS Network
An increasing number of communication problems that occur during the regular operation of a PROFIBUS network are a sign that the quality of the PROFIBUS installation has deteriorated since the time of its initial installation. Troubleshooting helps to identify and locate the weak points in the PROFIBUS installation and trigger targeted maintenance actions for improving the overall quality of the PROFIBUS network and restoring its original quality level.
The cable test (see Section 3.1.1) is a useful method for detecting cable faults due to worn PROFIBUS cable components, such as a defective trailing cable or broken cable wires.
The first step in troubleshooting a PROFIBUS network that is still working is to acquire the network information (see Section 3.3.3). If test results are available from previous troubleshooting activities or acceptance tests, they should be compared with the current results in order to find further clues. In this step, the PROFIBUS network traffic is logged for some time (i.e. longer than 10 minutes) and checked for retry frames. A large number of retry frames suggests that the PROFIBUS network’s operating reserves for the bus communication have decreased compared to the initial status and that the PROFIBUS communication is in a state of growing instability.

Best Practice in PROFIBUS Network Diagnostics 26
White Paper
Then the quality index (see Sections 3.1.3 and 4.2) is determined for each station. To obtain a general overview, this measurement is performed over a few minutes at two or three different locations within each cable segment of the PROFIBUS network. For stations with low quality indexes, the oscilloscope view can be used for further analysis (see Section 3.1.6). Low signal levels in the middle of each bit indicate faulty EIA-485 transceivers or increased resistance in the connector or cable, whereas any deviation from the rectangular shape is caused by irregular capacitive or inductive loads.
The occurrence of retry frames, restarts/parameterizations and frame errors as well as the obser-vation of low quality indexes or a signal waveform that does not represent correct PROFIBUS communication behavior are important clues to identify a PROFIBUS communication problem, find its cause within the network and determine the appropriate maintenance actions.
On completion of the maintenance work it is recommended to perform the set of troubleshooting actions recommended for a PROFIBUS network acceptance test (see Section 4.3). This ensures reliable PROFIBUS communication.
4.4.2 Troubleshooting a Non-Working PROFIBUS Network
If the PROFIBUS network is not working any longer, the available operating reserves have decreased to a point where PROFIBUS communication is no longer possible.
The first step therefore is to bring the PROFIBUS network into a state where the individual trou-bleshooting actions described in Chapter 3 can be carried out. This can usually be achieved by subdividing the affected PROFIBUS section into individual working PROFIBUS subsegments and by performing the individual steps described in Section 4.4.1 for each of these subsegments.
The division of a PROFIBUS network typically disconnects the PROFIBUS Master from the indi-vidual PROFIBUS stations in the subsegment. It is thus recommended to connect the Master simulator to the relevant PROFIBUS segment in order to run a physical analysis of the bus (such as quality index, rise time, signal-to-noise ratio, topology or the cable itself).17
17 As the Master simulator does not act as a regular PROFIBUS DP Master, the information provided in the protocol view will only be of limited use when the Master simulator is active.

Best Practice in PROFIBUS Network Diagnostics 27
White Paper
5. Analysis Tools for PROFIBUS Networks
To accommodate the wide variety of use cases, different analysis tools are available for trouble-shooting a PROFIBUS network. This chapter introduces the individual tools and explains their functionality.
5.1 Mobile PROFIBUS Diagnostics Tool
Designed for troubleshooting a PROFIBUS network directly on site in the production plant, a mobile diagnostics tool18 provides a comprehensive set of functionality, as described in Chapter 3. It is used during setup and commissioning of the PROFIBUS network as well as for trouble-shooting, and can also be used for laboratory tests.
Figure 13: Mobile Tool for PROFIBUS Network Diagnostics
18 The mobile diagnostics tool described in this section refers to the Softing PROFIBUS Tester 5 BC-700-PB product.

Best Practice in PROFIBUS Network Diagnostics 28
White Paper
The tool provides functionality for testing the PROFIBUS cables and the electrical signals, and for performing the logical network analysis. With its powerful functionality the mobile diagnostics tool thus combines the physical analysis of PROFIBUS DP (see Section 3.1) and PROFIBUS PA (see Section 3.2) networks as well as the logical PROFIBUS analysis (see Section 3.3) in one compact unit.
Due to the variety of diagnostic cases supported by the mobile diagnostics tool, its ease of use is a very important prerequisite. In addition to an intuitive, simple-to-use operator interface, push buttons, a graphical color display and a context-sensitive help system, a mobile device also has to feature a stand-alone mode for use without a PC or notebook so that it can be easily taken to the individual test locations within the plant. Battery support eliminates the need for a power outlet. The functionality is complemented by the ability to log data while working remotely in the plant. A full set of visualization capabilities for presenting the test results in a clear and easy-to-understand manner complete the functionality.
The mobile diagnostics tool supports acceptance testing of installed PROFIBUS networks as well as preventive maintenance activities. It allows the optimization of PROFIBUS installations and the detailed documentation of the installed status.
5.2 PROFIBUS Diagnostics Software
The PROFIBUS diagnostics software19 runs on PC hardware and extends the functionality of the mobile PROFIBUS diagnostics tool (see Section 5.1). The data logged in the mobile device during the diagnostics session(s) can be accessed and analyzed in detail by making optimal use of the graphical capabilities provided by this environment. The PROFIBUS diagnostics software is thus an essential component of an overall PROFIBUS diagnostics concept.
Based on the logged analysis data, the PROFIBUS diagnostics software provides the various signal and logical analysis capabilities for testing PROFIBUS networks as described in Chapter 3. It addresses the full range of commissioning and troubleshooting requirements for a PROFIBUS installation. An example of the information provided by the PROFIBUS diagnostics software is shown in Figure 14.
19 The description of the PROFIBUS diagnostics software is based on the Softing PROFIBUS Diagnostics Suite.

Best Practice in PROFIBUS Network Diagnostics 29
White Paper
Figure 14: PROFIBUS Diagnostics Software Allowing Detailed Analysis of Recorded PROFIBUS Frames
The PROFIBUS diagnostics software offers additional diagnostic functionality compared to the mobile PROFIBUS diagnostics tool. For instance, the PROFIBUS diagnostics software can be used for• Scanning the PROFIBUS topology• Analyzing frames by using trigger and filter conditions• Evaluating the tests performed with the mobile PROFIBUS diagnostics tool• Analyzing the signal waveform by using oscilloscope functionality
Another powerful feature of the PROFIBUS diagnostics software is the possibility to carry out quick tests (i.e. an automated sequence of basic tests), which provide a comprehensive overview of the network status – at the push of a button, in less than one minute. All the information is shown in plain text on the software’s user interface using the content of the respective GSD files of the connected PROFIBUS stations.
The comprehensive functionality also supports the use of the PROFIBUS diagnostics software in acceptance tests. For this, the software provides a special feature for generating a test report as shown in Figure 12.

Best Practice in PROFIBUS Network Diagnostics 30
White Paper
5.3 Stationary PROFIBUS Diagnostics Tool
A stationary diagnostics tool20 (see Figure 15) is designed, in particular, for the long-term diagnosis of the PROFIBUS communication within a network. It logs and analyzes the complete PROFIBUS traffic over a longer timeframe. The stationary diagnostics tool is especially suitable for detecting communication problems with the help of continuous monitoring – without the need for engineers on site.
Figure 15: Stationary Tool for Analyzing the PROFIBUS Traffic
The key advantage of a stationary diagnostics tool is that it allows the continuous analysis of the network, including the measurement of the PROFIBUS cycle times and the detection of critical events, such as the number of frame retries, message retransmissions and restarts of PROFIBUS stations, as well as device faults (see details described in Section 3.3) and diagnostic messages. This data is used for deriving information about the actual decrease of operating reserves for the bus communication at a stage at which the PROFIBUS network itself is still working properly.
20 The stationary diagnostics tool described in this section refers to the Softing TH LINK PROFIBUS product.

Best Practice in PROFIBUS Network Diagnostics 31
White Paper
In addition to the simple display of OK or BAD operating states, the stationary diagnostics tool also provides access to logged information about the PROFIBUS communication. This information can typically be accessed through an integrated web server connected via Ethernet to a central moni-toring and operating station, which eliminates the need for on-site inspections.
The stationary diagnostics tool is installed by connecting it to the PROFIBUS network in series with the other devices. It requires no changes to the bus addresses and the control program.

Best Practice in PROFIBUS Network Diagnostics 32
White Paper
6. Summary
As a digital fieldbus PROFIBUS provides very stable communication capabilities. It is important to understand, however, that the original status at the time of the network installation will not remain in its current state throughout the complete life cycle. The operating reserves for the PROFIBUS communication will rather decrease continuously and maintenance activities will be required in order to counteract the aging of the PROFIBUS communication and prevent age-related downtimes.
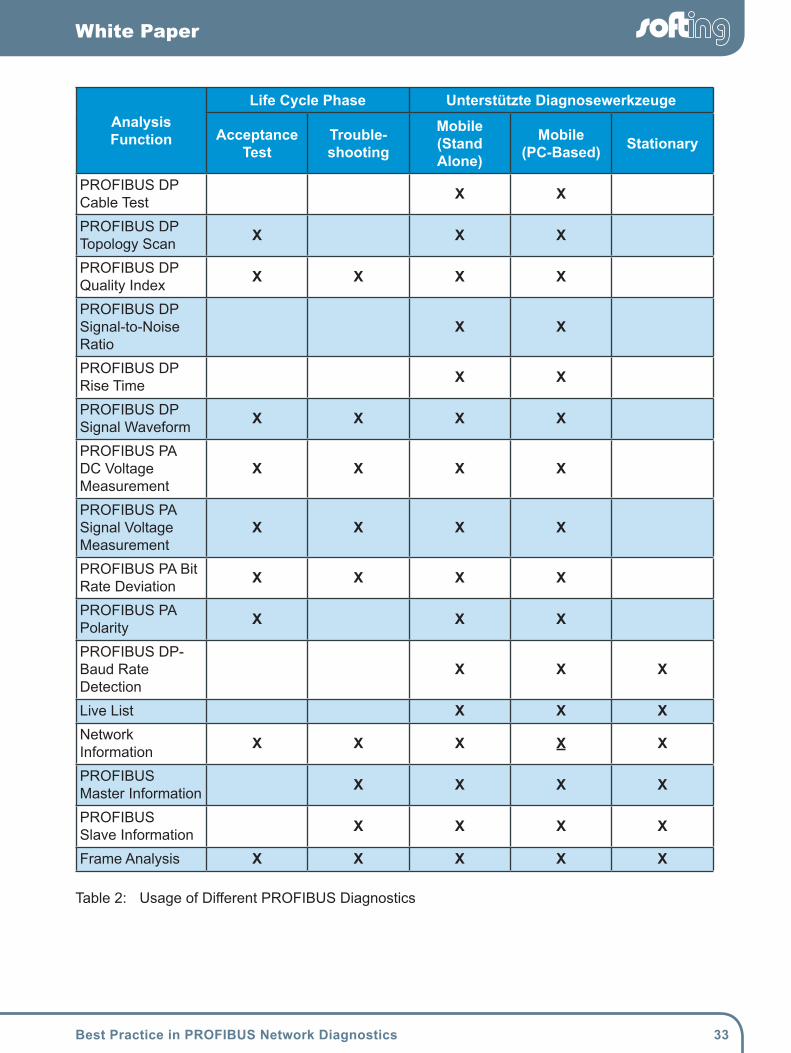
Thus, it is essential to continuously observe the current status of the PROFIBUS installation and to schedule the appropriate maintenance activities prior to the occurrence of expensive downtimes of the plant due to malfunctioning PROFIBUS communication. An extensive set of analysis capabilities are available for this task, including the physical analysis of electrical signals within PROFIBUS DP and PROFIBUS PA networks. In addition, the PROFIBUS communication can be analyzed at logical level. A summary of all these possibilities can be found in Table 2.
Best Practice in PROFIBUS Network Diagnostics 33
White Paper
Analysis Function
Life Cycle Phase Unterstützte Diagnosewerkzeuge
AcceptanceTest
Trouble-shooting
Mobile(Stand Alone)
Mobile(PC-Based) Stationary
PROFIBUS DP Cable Test X X
PROFIBUS DP Topology Scan X X X
PROFIBUS DP Quality Index X X X X
PROFIBUS DP Signal-to-Noise Ratio
X X
PROFIBUS DP Rise Time X X
PROFIBUS DP Signal Waveform X X X X
PROFIBUS PA DC Voltage Measurement
X X X X
PROFIBUS PA Signal Voltage Measurement
X X X X
PROFIBUS PA Bit Rate Deviation X X X X
PROFIBUS PA Polarity X X X
PROFIBUS DP- Baud Rate Detection
X X X
Live List X X XNetwork Information X X X X X
PROFIBUS Master Information X X X X
PROFIBUS Slave Information X X X X
Frame Analysis X X X X X
Table 2: Usage of Different PROFIBUS Diagnostics

Best Practice in PROFIBUS Network Diagnostics 34
White Paper
The available set of diagnostic functionality is designed to suit the different tasks that need to be accomplished over the life cycle of a PROFIBUS installation. On the one hand, it can be used to ensure proper PROFIBUS installation before starting the network operation. Mobile PROFIBUS diagnostics tools are ideal for this task. On the other hand, the PROFIBUS network diagnostics support the early detection of existing PROFIBUS communication problems within a running plant. The challenge here is to continuously monitor the current PROFIBUS installation status and to trigger the appropriate maintenance actions prior to expensive breakdowns. Consequently, this application area focuses on the use of stationary PROFIBUS diagnostics tools.
In summary, the individual PROFIBUS diagnostic capabilities discussed in this White Paper safeguard a high availability and operating reserve of PROFIBUS networks throughout their life cycle. However, using the right diagnostic procedures in the right situation is just as essential as in-depth PROFIBUS expertise. Only this combination ensures that the right action is taken at the right time to keep the PROFIBUS network up and running at all times, without any problems.

Best Practice in PROFIBUS Network Diagnostics 35
White Paper
7. Terminology Related to PROFIBUS Diagnostics
Baud Rate Data transmission rate (1 Baud = 1 Bit/s)PROFIBUS DP supports different transmission rates in the range from 9.6 KBit/s to 12 MBit/s.PROFIBUS PA is based on the Manchester Coded Bus Powered (MBP) transmission technology supporting a fixed data transmission rate of 31.25 KBit/s.
Bit Time Time needed for transmitting one bitThe Bit Time depends on the Baud Rate.
Bus Cycle PROFIBUS communication during a complete Token circulationThe bus cycle includes all PROFIBUS frames sent between the start of the cyclic PROFIBUS communication performed by one PROFIBUS Master and the following start of the cyclic PROFIBUS communication by the same PROFIBUS Master. In a multi master system the bus cycle covers the complete set of the cyclic PROFIBUS communication performed between the individual PROFIBUS Masters and all PROFIBUS Slaves.
Differential Voltage Voltage between the EIA-485 signal lines A (pin 8) and B (pin 3)The Differential Voltage is digitized by the individual PROFIBUS stations into logic 1 or logic 0 information for each individual Bit Time. The Differential Voltage refers to a momentary snapshot and changes permanently.
Edge Error Bit for which the edge Rise Time and Fall Time of the Differential Voltage is more than 6/16th of the Bit TimeAn Edge Error is the result of insufficient Rise Time when transmit-ting a bit.
EIA-485 OSI model physical layer electrical specification of a two-wire, half-duplex, multipoint serial connectionEIA-485 specifies a differential form of signaling. The data is conveyed by the difference between the wires’ voltages. One polarity of voltage indicates logic 1, the reverse polarity indicates logic 0.EIA-485 is the most commonly used physical layer in PROFIBUS DP networks.EIA-485 has been formerly known as RS-485 or RS485.
Evaluation Period 10/16th of the Bit Time around the bit center (EIA-485 transceiver-sample point), within which the Signal-to-Noise Ratio is measured

Best Practice in PROFIBUS Network Diagnostics 36
White Paper
Fall Time Time required for a PROFIBUS signal to change from the logic 1 level to the logic 0 levelThe Fall Time is measured with a resolution of 1/16th of the Bit Time.
Glitch Error Bit for which the measured Differential Voltage is less than the current Reference Voltage for at least 2/16th of the Bit Time and then recoversGlitch Errors are the result of overshoots and undershoots when transmitting a bit.
Idle State Bus condition between two successive frames, either between a response frame and the request frame of the subsequent message cycle or between a request frame for which no response frame is returned and the next request frameIn the Idle State no EIA-485 transmitter of any station is active. The voltage level during the Idle State is ensured by the bus termination.
Illegal Frame Frame not conformant to IEC 61158-3
Level Error Bit for which the measured Differential Voltage does not reach the current Reference VoltageLevel Errors are the result of voltage dips when transmitting a bit.
Logical Analysis Analysis of a PROFIBUS network at the Data Link Layer of the PROFIBUS communicationThe Logical Analysis is based on the analysis of individual PROFIBUS frames. It is performed at the PROFIBUS network level.For a full analysis of a PROFIBUS network the Logical Analysis has to be complemented by a Physical Analysis.
Manchester Coded Bus Powered (MBP)
OSI model physical layer electrical specification of digital bit-synchronous data transmission based on a twisted two-wire, bidirec-tional connectionMBP is widely used for fieldbuses in the process industry.The MBP transmission technology provides a data transmission rate of 31.25 KBit/s and performs at least one transition between the logic 0 level and the logic 1 level or vice versa for transmitting one bit. It requires 8 bits for encoding a character.MBP is capable of supplying power to the individual field devices via the bus wire.PROFIBUS PA uses MBP transmission technology.MBP is standardized in IEC 61158-2.

Best Practice in PROFIBUS Network Diagnostics 37
White Paper
Message Cycle Smallest elementary PROFIBUS communication unitA Message Cycle consists of a request frame sent by a PROFIBUS Master to another PROFIBUS station plus the corresponding response or acknowledgement frame.The timing of a PROFIBUS message cycle has to respect the Idle Time as well as the minimum station delay time defined for the indi-vidual PROFIBUS station.Only PROFIBUS Masters have the right to initiate a Message Cycle as long they possess the Token.
Physical Analysis Analysis of a PROFIBUS network at the physical layer of the PROFIBUS communicationThe Physical Analysis combines the measurement of PROFIBUS cables including the Terminators and the measurement of electrical signals. It is performed at the PROFIBUS segment level.For a full analysis of a PROFIBUS network the Physical Analysis has to be complemented by a Logical Analysis.
PROFIBUS Master Active bus station coordinating the access to the busUsually a controller acts as the PROFIBUS Master. In addition, SCADA stations or MPI panels may act as PROFIBUS Masters. PROFIBUS supports the use of one (single master system) or several PROFIBUS Masters (multi master system) within one network.
PROFIBUS Segment Section of the PROFIBUS network terminated on both line ends using a powered resistor combination (Terminator)A repeater which is either inserted between line ends or else connected to one line end also constitutes a segment termination.
PROFIBUS Slave Bus station which as a rule only sends to the bus upon request by the master (e.g. digital I/O)
Quality Index Value indicating the quality of the PROFIBUS communication for a specific PROFIBUS station by assessing the voltage level as well as the signal waveformThe Quality Index is determined by the final value of the Reference Voltage, which is defined by a total number of 20 Glitch Errors, Edge Errors and Level Errors while transmitting 1,000 bits to/from an individual station.
Reference Voltage Differential Voltage which is modified iteratively according to a specific algorithm towards a final value, which then defines the Quality Index and the Signal-to-Noise Ratio.

Best Practice in PROFIBUS Network Diagnostics 38
White Paper
Retry Frame PROFIBUS Request Frame sent again by the PROFIBUS Master if the PROFIBUS station has not transmitted the requested response or acknowledgement frame within the Slot Time
Rise Time Time required for a PROFIBUS signal to change from the logic 0 level to the logic 1 levelThe Rise Time is measured with a resolution of 1/16th of the Bit Time
Signal-to-Noise Ratio Maximum of the interference-free range of the Differential Voltage determined during the Evaluation Period of the frames for a specific PROFIBUS stationVoltage drops during the Evaluation Period are not taken into account if they are less than 1/16 of the Bit Time.The Signal-to-Noise Ratio is determined by the final value of the Reference Voltage at which no interference with the PROFIBUS signal occurs after evaluating ten frames of a specific station.
Slot Time Maximum waiting time between sending the PROFIBUS request frame and the complete reception of the first bit of the requested response or acknowledgement frame
Terminator Termination at both ends of a PROFIBUS segmentThe Terminator prevents reflections by providing the correct impedance at both ends of the PROFIBUS segment. In addition, the Terminator ensures a Differential Voltage of approximately 1.1 V during the Idle State.
Token Frame (SD4) which is exchanged between the individual active stations (PROFIBUS Masters) in a round-robin fashion to initiate the individual PROFIBUS communication and thus control access to the PROFIBUS networkOnly the station possessing the Token is allowed to start a Message Cycle.In a single master system the Token is passed from the PROFIBUS Master to itself.

Best Practice in PROFIBUS Network Diagnostics 39
White Paper
8. About Softing
The Softing Industrial Automation segment is part of the Softing group founded in 1979.
Softing Industrial Automation is a global specialist in industrial communication technologies such as fieldbuses and Industrial Ethernet. With over 35 years of experience, Softing’s Industrial Auto-mation business units deliver connectivity, diagnostic products, and services to customers in the factory and process automation industry.
Softing has been working on the PROFIBUS technology since the start of the initial PROFIBUS project launched in 1987. Since then Softing has been deeply involved in the development of various kinds of PROFIBUS products. Today, the Softing PROFIBUS offering is proven-in-use in a wide variety of applications by a large number of manufacturers and users around the world.
Softing’s great technical PROFIBUS expertise and experience resulting from implementing a vast number of field-proven products and successful customer-specific projects has also led to the development of efficient PROFIBUS diagnostic tools that are widely used in the market. These products support mobile as well as stationary analyses and include powerful PROFIBUS diagnostic software. As a result the Softing products offer a comprehensive set of functionality for detecting and solving the different types of PROFIBUS problems. To complement this range of products Softing also offers trainings for troubleshooting PROFIBUS networks and performs on-site operations for analyzing and solving individual detected PROFIBUS problems.
The Softing products are tailored to the requirements of system integrators, device vendors, machine and equipment manufacturers, or end users and are known for their ease of use and functional advantages.
Softing Industrial Automation GmbH Richard-Reitzner-Allee 6 DE-85540 Haar Germany Phone: +49 / (0)89 / 45656-340 Fax: +49 / (0)89 / 45656-488 E-mail: [email protected] http://industrial.softing.com

Best Practice in PROFIBUS Network Diagnostics 40
White Paper
9. Authors
Dr. Hans Endl Product Management Softing Industrial Automation GmbH Haar (near Munich), Germany
Georg Süss Product Marketing Softing Industrial Automation GmbH Haar (near Munich), Germany
10. References
• PROFIBUS Diagnostics Suite Getting Started Manual Version 2.11, Revision May 31, 2013 Softing Industrial Automation GmbH, May 2013
• The Insider’s Guide to Maintaining PROFIBUS Networks AnintroductiontocommonPROFIBUSproblems,theirlocationandrectification Hitex Development Tools Available at: http://www.hitex.co.uk/fileadmin/uk-files/downloads/softing/Maintaining_profibus_3.pdf (as of March 26, 2015)
• PROFIBUS Installation Guideline for Commissioning Version 1.0.2, Order No. 8.032 PROFIBUS & PROFINET International, November 2006
• QualityofProfibusInstallations Max Felser, Bern University of Applied Sciences WFCS 2006, 6th IEEE International Workshop on Factory Communication Systems, June 27-30, 2006, Conference Center Torino Incontra, Torino, Italy Available at: http://www.felser.ch/download/FE-TR-0601.pdf (as of March 26, 2015)

Best Practice in PROFIBUS Network Diagnostics 41
White Paper
11. List of Figures
12. List of Tables
Figure 1: Different Market Segments Supported by PROFIBUS ........................................... 2
Figure 2: Cyclic and Acyclic PROFIBUS DP Communication ............................................... 5
Figure 3: Trunk & Spur Technology Used by PROFIBUS PA and Coupling of PROFIBUS PA Segments to PROFIBUS DP ......................................................... 7
Figure 4: PROFIBUS Cable Test Results ............................................................................ 10
Figure 5: Detailed Results from PROFIBUS Cable Test ..................................................... 11
Figure 6: Topology Scan Result Indicating a Healthy PROFIBUS Network ......................... 12
Figure 7: Quality Index Bar Graph of All Stations Showing Good Operational State ........... 14
Figure 8: Definition of Signal-to-Noise Ratio Within PROFIBUS Signal .............................. 15
Figure 9: Example Display Showing the Rise Time of a PROFIBUS Communication ......... 16
Figure 10: Network Information Display ................................................................................ 19
Figure 11: Example of the Quality Index Measured from Either End of the PROFIBUS Segment ........................................................................................... 23
Figure 12: Detailed Test Report Summarizing the Results of a PROFIBUS Network Acceptance Test .................................................................................... 25
Figure 13: Mobile Tool for PROFIBUS Network Diagnostics ................................................. 27
Figure 14: PROFIBUS Diagnostics Software Allowing Detailed Analysis of Recorded PROFIBUS Frames ............................................................................. 29
Figure 15: Stationary Tool for Analyzing the PROFIBUS Traffic ............................................ 30
Table 1: PROFIBUS DP Device Types ..................................................................................... 4
Table 2: Usage of Different PROFIBUS Diagnostics .............................................................. 33


![Siemens Supply info@aotewell.com Automation Inc · Diagnostics and simulation functions, remotely or locally. SITRANS TH400 [2] Fieldbus transmitter in designs for PROFIBUS PA or](https://img.dokumen.tips/doc/110x75/5ed8477f0fa3e705ec0e2de1/siemens-supply-info-automation-inc-diagnostics-and-simulation-functions-remotely.jpg)