Embed Size (px)
Citation preview

Rob Beiko
New approaches to understand the geography of our microbial world
GenGIS 2

Donovan Parks
Mike Porter
Brett O`Donnell
Timothy Mankowski
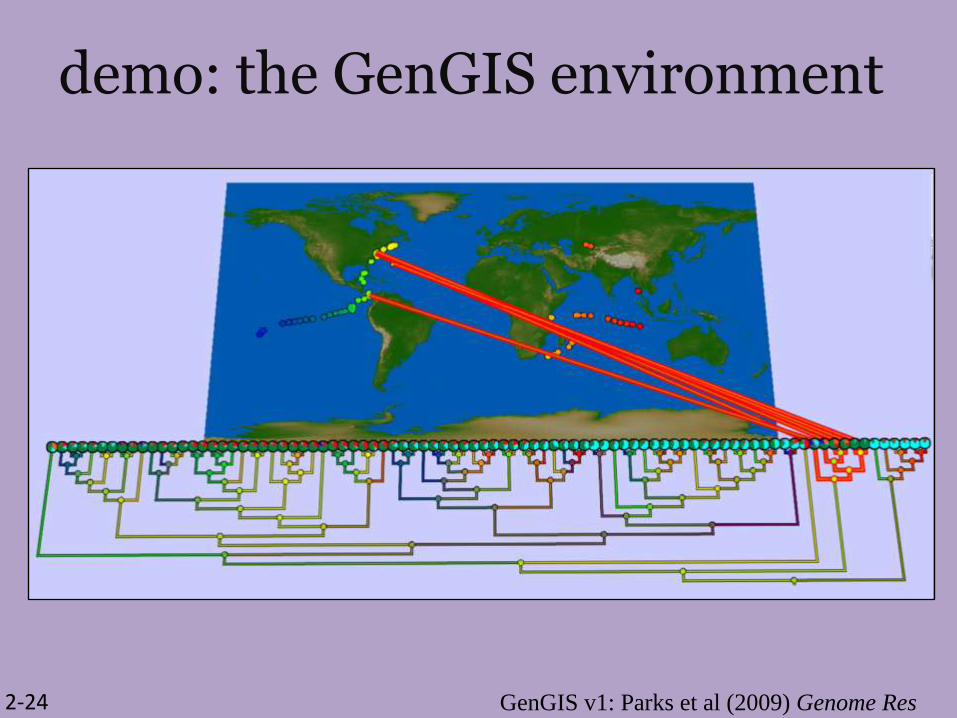
demo: the GenGIS environment
GenGIS v1: Parks et al (2009) Genome Res2-24

DataMap – many formats (GDAL)Samples – CSVSequences – CSVTrees - Newick
GenGIS v1 overview
Core application
(C++)Scripting interface
(Python, R)
GUI (wxPython)
OutputSaved image files
Open source: Creative Commons Attribution – Share Alike 3.0
Supported platforms: Windows XP, Vista, 7; OS X 10.4, 10.5, 10.6
Crossing minimization + statistical test

DataMap – many formats (GDAL)Samples – CSVSequences – CSVTrees - Newick
what's new in v2
Core application
(C++)Scripting interface
(Python, R)
GUI (wxPython)
OutputSaved image files
Save / restore sessions
Python plugins
Stability improvements, various things now work properly on the Mac
Linear axes analysis
Interface updates (legends, data visualizations)
External files

bringing map data into GenGIS
• Maps:
– MapMaker (included application)
– Digital elevation data (Geobase.ca, NASA Shuttle Topography data, etc.)
– Images (.png, .tif, etc.)

three views of the LineP transect
Original data: Jody Wright, Steven Hallam

diversity and depth

clustering based on Canberrabeta-diversity

relative abundance of SUP05

demo: plugins and R scripts
Original data:
Costello et al. Science 326:1694-1697
Linear regression of group frequencies
Heatmap RPy2 script
10-29

clustering of fecal samples
Female subjects: F1 – F3
Male subjects: M1 – M3
Two sampling methods:
- TP
- Direct from feces
Two time points
= 4 samples per individual. Do these
samples cluster with each other?


• Canada’s largest National Park
• UNESCO World Heritage status (Boreal Forest)
• Threatened by encroaching development
– Oil Sands mining (Alberta)
– Metal mining (NWT)
– Hydro-electric dams (Peace River, BC)
• Natural resources sustain traditional use by Métis and
First Nations peoples
Photos: D Baird
Wood Buffalo National Park

biomonitoring 2.0what is being collected
• Benthic invertebrates (COI, 28S) – kick sample
• Water (16S, 18S, 28S) – 1L volume
• Soil (16S, COI, ITS, 18S, 28S, RbcL) - cores
• Terrestrial arthropods (COI, 28S) – malaise / pitfall traps
• All samples replicated 3 times
• 5 time points in initial study
• Lots of metadata (soil chemistry,
flooding, etc.)

biomonitoring 2.0replication results – 2010 trial
• fjej

biomonitoring 2.0sampling progress
• August 2011
• Samples collected, starting analysis of sequences
• 'traditional' taxonomy where applicable (arthropods
si, bacteria no)
• June 2012
• Samples collected
• Future sampling: August 2012, June – August 2013

biomonitoring 2.0our three-year mission (and beyond)
• Develop robust sampling techniques for sequence-
based biomonitoring
• Develop and apply different approaches for
assessing biodiversity (taxon-based and taxon-
free), and compare their performance on WBNP data
• Identify whether “reference conditions” can be
established against which future samples can be
compared

call for collaborators
• Currently underway:
– Combined axis tests (Many trees, one optimal gradient)
– Regional tests of diversity
– Canonical correlation analysis and related
– Bio2.0 analysis
• Goals:
– Integrate with online data sources
– Support more data types (especially vector data)
– More plugins!

the long-term goal
Local data
Online data sources
with APIs
+Automated dataset
generation /
visualization
Analysis:
-Geo gradients
-Diversity vs. habitat
-Diversity networks
-Functional models


acknowledgments
GenGIS developers (Dal)
Donovan ParksMike PorterTimothy MankowskiBrett O'DonnellKathryn DunphySylvia ChurcherMike PorterSuwen WangHarman ClairGreg SmolynStephen BrooksChristian BlouinJacqueline Whalley
(Auckland U Tech)
LineP (UBC)
Jody Wright
Steven Hallam
Bio2.0
Mehrdad Hajibabaei (Guelph)
Donald Baird, Wendy Monk (UNB)
Brian Golding (McMaster)
Jeff Shatford (Parks Canada)

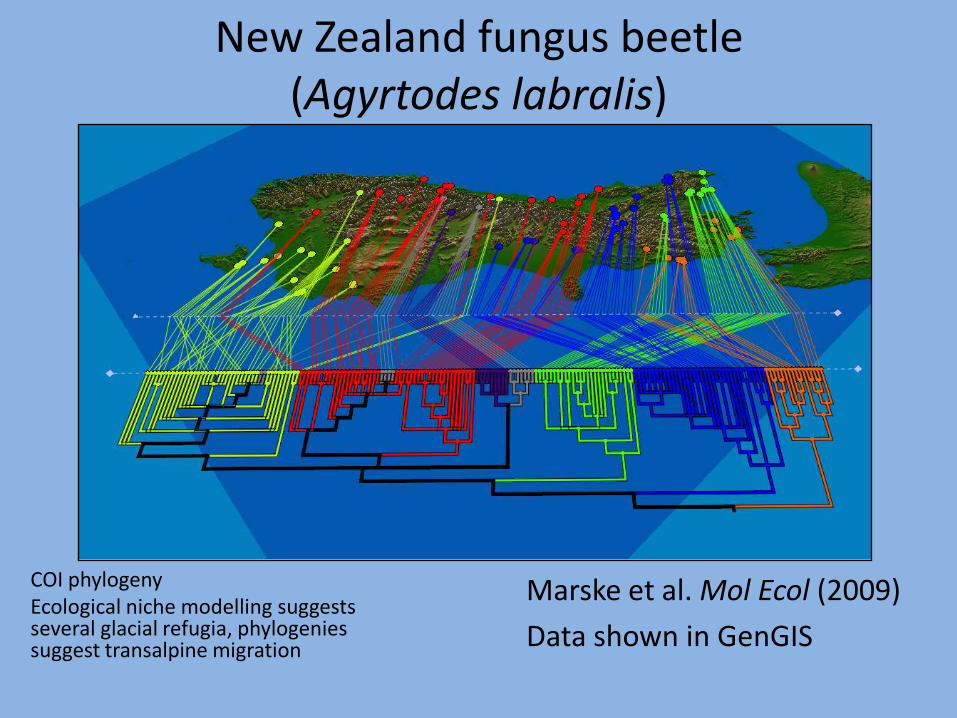
Marske et al. Mol Ecol (2009)
Data shown in GenGIS
New Zealand fungus beetle (Agyrtodes labralis)
COI phylogenyEcological niche modelling suggests several glacial refugia, phylogenies suggest transalpine migration

map

locations

sequence summaries

tree vs geography

axes test

body site data

linear regression

hea
tmap
su
sin
g R