Embed Size (px)
Citation preview

Distributed Tracing Framework(Apache HTrace)
2016. 05. 20.
민형기

About Me
• 삼성SDS - SSA BigData Analysis 전문가 과정 강의• 1~3회(2013.02 ~ 2014.02)• http://www.slideshare.net/hypermin/presentations
• SNDB: 2012~2013.02 (Cassandra)• (Samsung NoSQL DB – Cassandra, AWS DynamoDB 호환API)
• M-Project: 2014.02~2016.03 (HBase)• 용도: 메일 저장소, Queue 저장소• 적용내용
• C++ hbase client• 2nd index / region colocation• hbase thrift server customization• hbase htrace 적용
Contents
• Distribution Tracing
• Why Distribution Tracing
• 주요 Tracing Framework• Google Dapper
• Twitter Zipkin
• Naver Pinpoint
• Apache HTrace
• 비교

Distribution Tracing?
• 배경• 분산환경에서 성능을 진단하는 일은 매우 어려움• 많은 타임아웃과 비정상 상황이 발생• 성능문제는 100% 재현은 불가• 다양한 모듈이 여러 노드에 있고 특정 상황에서 발생함
• 분석방법• LOG• Metrics• APM• Distributed Tracing Tools
Real-World 시나리오
• 클러스터가 가장 최근에 느려졌고, 왜 느려졌지?
• X를 최적화하는데 시간을 들이는 것이 가치가 있을까?
• 왜 클러스터가 주말에 느려졌지?
• 이번 성능문제가, MapReduce 문제인지 HDFS문제인지?
• 왜 EOFException 로그가 많이 발생했지?

Metrics
• 많은 metrics를 사용할 수 있음• JMX• top• vmstat• iostat
• 장점• 좋은 Throughput에 대한 View를 제공함• 안좋은 응답문제를 식별하는데 좋음• 평균 bandwidth, CPU, disk I/O와 같은 정보를 잘 표현함
• 단점• Disk I/O stat이 느린 이유가 I/O 때문인지 병목현상 때문인지에 대한 이유를
찾기가 어려움

Log Files
• 모든 Daemon들은 로그파일을 생성함• audit log• Log4j files• Client log files
• 장점• 가장 손쉽게 정보를 저장할 수 있음• 특정 요청이나 시점에 상세정보를 얻을 수 있음
• 단점• 많은 다양한 파일이 생성됨: per-host, per-project, per-facility• 다수 노드의 로그를 통해 관련된 의미 있는 정보를 얻기가 어려움• 분석을 위해 로그를 추가하면 과다한 로그가 남게 되고, disk I/O 에 부담

Distributed Tracing Framework을 이용
• Apache HTrace와 같은 Tracing Framework을 이용• Apache HTrace• Twitter Zipkin• Naver Pinpoint
• 장점• 특정 요청에 대한 클러스터내의 연관정보 확인• 특정 요청에 대한 End-to-End tracing이 가능함
• 단점• Metrics과 같은 요약정보를 보여주는 것에는 한계• 특정시점에 대한 상세정보에는 한계

Distribution Tracing Tools구분 연도 개발사 특징
Dapper 2010 Google Large-scale Distributed Systems Tracing Infrastructure• Collects traces from production requests• Low overhead• Minimum of extra work for developers
Zipkin 2012 Twitter Distributed Systems Tracing system• Google Dapper 모델 이용• Scribe, Finangle, Cassandra 등을 이용하여 구성됨• Performance bottleneck 발견 등
Naver Pinpoint 2015 Naver Open source APM tool for large-scale distributed systems written in Java.• Google Dapper 모델 이용• 분산 트랜잭션 추적, 애플리케이션 토폴로지 자동 발견• Bytecode instrumentation 기법 사용
Apache HTrace 2014 Cloudera, Apache Tracing framework intended for use with distributed systems written in java.• Google Dapper 모델 이용• HDFS/HBase Performance 문제를 해결하기 위해 적용됨• Apache incubation project
Magpie 2007 Microsoft Online modelling and performance-aware systems• Capacity planning, Tracking workload level shifts, Detecting component failure,
Performance debugging
X-Trace 2007 UC Berkeley A Pervasive Network Tracing Framework
Pinpoint 2002 UC Berkeley, Stanford Detecting system problems and isolating their root causes.

Google Dapper
• 개요
• Google 20010년 4월 발표됨
• 대용량 분산 시스템 트레이싱 인프라
• 구글 Web 검색은 수많은 sub-system과 다양한 머신으로구성되고, latency가 아주 중요한 요소임
• Black-box와 annotation-based monitoring schema지원
• 특징
• Collects traces from production requests
• Low overhead
• Minimum of extra work for developers

Twitter Zipkin
• 개요• 분산시스템을 위한 트레이싱 프레임워크
• 구글 Dapper 논문의 영향
• Twitter에서 개발 (2012)
• 목표• 퍼포먼스 최적화

Naver Pinpoint
• 개요• 대규모 분산 시스템 추적 플랫폼• 구글 Dapper 논문의 영향• Naver에서 개발 (2015)
• 목표• 분산된 애플리케이션의 메시지를 추적할 수 있는 분산 트랜잭션 추적• 애플리케이션 구성을 파악할 수 있는 애플리케이션 토폴로지 자동 발견• 대규모 서버군을 지원할 수 있는 수평 확장성• 코드 수준의 가시성을 제공해 문제 발생 지점과 병목 구간을 쉽게 발견• bytecode instrumentation 기법으로 코드를 수정하지 않고 원하는 기능을 추
가

Apache HTrace
• 개요• 분산시스템을 위한 트레이싱 프레임워크
• 구글 Dapper 논문의 영향
• Cloudera에서 개발 (2014)
• Apache Incubator project (2015)
• 목표• Effective for finding bottleneck
• Effective for code analysis
• Low Overhead
참고: http://research.google.com/pubs/pub36356.html

Distributed Tracing Framework 비교HTrace Zipkin Pinpoint
설명 Distributed Tracing Framework Distributed Tracing Framework Open source APM tool
URL http://htrace.incubator.apache.org/ http://zipkin.io/ https://github.com/naver/pinpoint
회사 Cloudera, Apache Twitter Naver
License Apache 2.0 Apache 2.0 Apache 2.0
버전 4.1(incubating) ? ?
언어 Java/C/Go Java Java
API Reference 문서 약함 보통 약함
특징 • 기본 Stack + 확장(Pluggable): Zipkin / Flume / Hbase에 연동
• 트레이싱 코드 추가필요• 분산지원 가능(연계 코드 필요)• WebApp 기능 약함• 주목적: 퍼포먼스 최적화
• 전용 Stack: Scribe, Finangle,Cassandra
• 트레이싱 코드 추가필요• 분산 지원 우수• WebApp 기능 보통• 주목적: 퍼포먼스 최적화
• 전용 Stack: Bytecode instrumentation
• 트레이싱 코드 추가 필요없음• 분산 지원 우수• WebApp 기능 강함 (운영관점)• 주목적: APM
적용사례 Hadoop/hbase/Hive 등 Twitter / Armeria Naver
3rd party 지원 많음 보통 적음

HTrace - HTrace Goals
•운영환경에서 시스템 성능을 모니터
•성능 이슈, Node 장애, 하드웨어 문제를 진단
•병목구간을 식별하는데 도움

HTrace – Trace Span (1/2)
Htrace에서 Trace Span은 시간거리(length of time)
• Trace Span• A description
• Start time in milliseconds
• End time in milliseconds
• Unique identifier
• Tracer ID
• Other metadata
{"s": "092d6961d7e7a5a2","b": 1424813328586,"e": 1424813328595,"d": "ClientNamenodeProtocol#getListing","i": "51fbdaf67e364d18","p": ["9840b24cedd01fcc"],"r": "FsShell"}
HTrace – Trace Span(2/2)
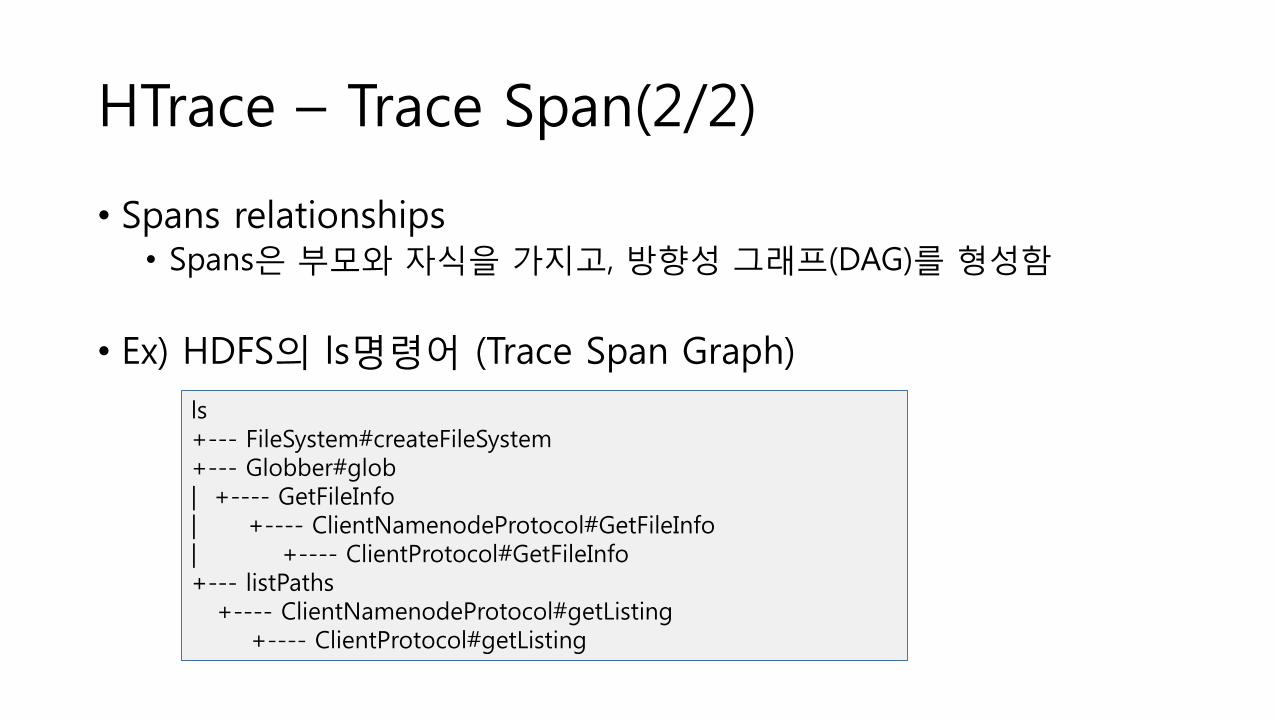
• Spans relationships• Spans은 부모와 자식을 가지고, 방향성 그래프(DAG)를 형성함
• Ex) HDFS의 ls명령어 (Trace Span Graph)
ls+--- FileSystem#createFileSystem+--- Globber#glob| +---- GetFileInfo| +---- ClientNamenodeProtocol#GetFileInfo| +---- ClientProtocol#GetFileInfo+--- listPaths
+---- ClientNamenodeProtocol#getListing+---- ClientProtocol#getListing
HTrace – Sampling
• 모든 request를 trace하기는 매우 어려움(극단적으로 많은 trace데이터가 생성된)
• Sampler를 이용하여 sample데이터에 대해서만 trace 데이터가저장
• 운영환경에서 사용 가능 (1% 이하만 트레이싱)
• 시스템 부하 측면에서 유용
• Sampling rate와 type은 설정 가능함• CountSampler – 고정 주기에 따른 샘플
• ProbabilitySampler –일정한 확률로 샘플

HTrace – Tracer
• 서비스와 클라이언트가 트레이스 중임을 나타냄
• 예를들어 FsClient, DataNode, NameNode는 각각 자신의Tracer 객체를 가지고 있음
• Tracer#Builder를 이용하여 생성됨
• 다양한 Tracer를 생성• Logger의 name과 같은 의미
• Tracer의 이름으로 trace종류를 구분할 수 있음
• 전형적인 tracer ID: NameNode/192.168.0.1

HTrace – TraceScope
• Tracer#newScope를 이용하여 생성됨
• TraceScope 객체는 Span 객체의 수명을 관리함
• TraceScope가 생성될때, Span 객체에 관계가 생기고, TraceScope가 닫힐때 span도 같이 닫힘.
• Scope를 닫힐때 SpanReceiver를 통해 span이 처리됨
TraceScope computationScope = tracer.newScope("CalculateFoo");try {
calculateFoo();} finally {
computationScope.close();}

HTrace – SpanReceivers
Trace 정보(Span data)를 받아서 처리
다양한 SpanReceiver를 사용할 수 있음• LocalFileSpanReceiver: 로컬 파일로 span data를 저장
• HBaseSpanReceiver: hbase에 span data를 저장
• ZipkinSpanReceiver: Twitter Zipkin에 span data를 저장
FoobarApplication|V
htrace-core4|V
HTracedSpanReceiver OR LocalFileSpanReceiver OR StandardOutSpanReceiverOR HBaseSpanReceiver OR ZipkinSpanReceiver OR ...

HTrace – API Misc.
• Tracing을 위한 각종 Wrapper를 제공• TraceRunnable
• TracerCallable
• TraceExecutorService
• TracerPool• Tracer를 그룹으로 관리할때 사용됨
Runnable myRunnable = tracer.wrap(myPiRunnable, “calculatePi”);

HTrace – API Internal Classes

Appendix.

Reference.
• 기존• Magpie: online modelling and performance-aware systems
• Pinpoint: Problem Determination in Large, Dynamic Internet Services
• X-Trace: A Pervasive Network Tracing Framework
• Google Dapper• Dapper, a Large-Scale Distributed Systems Tracing Infrastructure
• Paper: Dapper, Google’s Large-Scale Distributed Systems Tracing Infrastructure
• Twitter Zipkin• Distributed Systems Tracing with Zipkin(2012)
• Zipkin: a Distributed Tracing Framework
• Zipkin – Strangeloop
• The Last Pickle: Distributed Tracing from Application to Database
• Introducing CallTracing™, based on RabbitMQ, Spring and Zipkin

Reference.
• Naver Pinpoint• Naver Pinpoint: open source APM tool for large-scale distributed systems
• 대규모 분산 시스템 추적 플랫폼, Pinpoint
• Apache HTrace• Introducing Apache HTrace
• Htrace: Tracing in Hbase and HDFS(Hbase Meetup)
• New in Cloudera Labs: Apache HTrace(incubating)
• Introducing Apache HTrace | SCALE 15x