Embed Size (px)
Citation preview

4 Key Priorities for ACO Success
People, Process, Technology and Financials

Doris SteinHealthcare Partner
Optimity AdvisorsDoris, with over 20 years of consulting and industry experience, leads the government programs practice for Optimity Advisors and is a frequent industry speaker about ACOs. Most recently, she presented at the European Health Conference and the ACO Southeast Regional Conference.
April 30, 2015 INFORM | TRANSFORM | OUTPERFORM Page | 2
Dennis R. HorriganPresident and Chief Executive Officer
Catholic Medical PartnersDennis and his management team at Catholic Medical Partners are
managing over $1 billion in healthcare expenditures using a
population health/business model. CMP was one of the top
performing Shared Saving Accountable Care Organization (ACO) in
the country.
Presenters:

• ACO Network Options
• ACO Maturity Model
• Integrated Care System
• Examples Contributing to ACO Success:
o People
o Process
o Technology
o Financials
• Managing Risk & Margin
• Catholic Medical Partners (CMP) case study
• Questions?
April 30, 2015 INFORM | TRANSFORM | OUTPERFORM Page | 3
Agenda

ACO Network Options
• Physician Group Structure
• Physician – Hospital Network (Independent & Employed)
• Physician – Hospital Network (Employed Only)
• Academic Medical Center Network
• Fully integrated – Physician / Hospital / Insurance
• Health Plan / Physician
• Health Plan / Hospital
• Employer Group/Hospital
April 30, 2015 INFORM | TRANSFORM | OUTPERFORM Page | 4

* Develop Business Plan
* Leadership/Governance Structure
* Business Partnerships
* Gain Sharing, Benchmarks & Patient Assignment
* Change Management Plan
* Organizational Readiness
* Identify Sponsors/Champions
* Define Health & Wellness Programs
* Define Cost and Utilization Benchmarks for Local Market
* Define Reporting Requirements -Financial, Clinical, Operations, Compliance
* Define Enterprise Architecture -Business, Operations, Systems, Data
* Establish Real-time Feedback
* Evaluate Clinical Strategy
* Conduct regular Stakeholder Meetings
* Enterprise Dashboards
* Report to Internal ACO Stakeholders and Patients
* Trend & Predictive Analyses
ACO Maturity Model
0-9 MonthsAssess & Plan
9-18 MonthsImplement & Sustain
18-36 MonthsMonitor, Evaluate & GrowKey Activities and Milestones Across the ACO Lifecycle
April 30, 2015 INFORM | TRANSFORM | OUTPERFORM Page | 5
April 30, 2015 INFORM | TRANSFORM | OUTPERFORM Page | 6
Integrated Care System
Member
• Integrated Data Reporting
• Provider/ Payment System Integration
• Patient Accessibility Member Portal
• Electronic Heath Records
• Cost Reporting
• Aligned Incentives
• Pay for Performance Modeling
• Capital Budget Planning
• Governance
• Communication
• Culture Change Management
• Human Capital Management
Process
• Quality Reporting
• Clinical Integration
• Population Focus
• Health and Wellness
• Care Management
Primary Care
CommunityCare
AcuteCare
Behavioural/Social Support
People Process
Financials Technology

Examples Contributing to ACO Success - People
• People
People
• Culture/Change Management
• Communication Plan
• Organizational/Governance Structure
• Human Capital Management
• Recruitment, Training & Development
• Physician Incentive Plan
• Performance Monitoring
• Catastrophic Patient Management
• ACO Steering Committee provides oversight and direction, develops policies, and manages implementation
• All provider groups in the ACO are represented in leadership/executive committee with shared accountability
Governance Structure
• Single, consistent physician and contracting strategy across system with appropriate incentive plans
• Physician engagement to change practice patterns (practice in teams, implement EHRs, etc.)
Physician Engagement/P
ayment
• Organization’s culture supports physician alignment and leadership
Culture/Change
Management
• More focused cost-containment strategies in order to control the smaller population that is spending significant expenses
Catastrophic Patient
Management
April 30, 2015 INFORM | TRANSFORM | OUTPERFORM Page | 7

Examples Contributing to ACO Success - Process
• Marketing & Product Development
• Contracting/Network Management
• Reimbursement
• Value Based Benefits
• Coaching, Health & Wellness Programs
• UM/CM/DM
• Clinical Decision Support Guidelines
• Meaningful Use
• Admission Diversion
• Readmission Reduction
• Expand Primary Care Services
• Nutritionist
• Care Coordinators
• Nurse Practitioners
• Encouraging patients to take an active role in care through shared decision making and communication about self-management, medications and change in lifestyle
Health and Wellness
• Directing physicians to highest risk patients and to weightiest quality measures for a Phase 1
• Developing goals for admission diversion and readmission reduction
Focused Goals
• Care Delivery model "integrates" services from Health & Wellness to Disease/Case Management
Care Delivery
• Referral patterns must be monitored
• Assignment of patient populations and movement in and out of network must be monitored
Network Management
April 30, 2015 INFORM | TRANSFORM | OUTPERFORM Page | 8
Process

Examples Contributing to ACO Success - Technology
• Connect EHRs across organizations (hospitals, providers, etc.)
• Hire technology support staff to maintain functionality of EHR system
EHR
• Enterprise reporting addresses individual & population and financial & clinical data
• Standardized reporting metrics across all providersReporting
• Data strategy and information sharing is owned by all participants Data Strategy
• Can track compliance and performance against contractual quality goals and published guidelines – by patient, provider or practice
System Tracking
• Interoperable IT Systems
• EHR
• PHR
• Patient Portals
• Advanced Care Management Systems
• Care Transition Electronic Plans/Monitoring
• Enterprise Reporting Systems
• Clinical, Financial & Operational
• Decision Support
• Predictive Modeling
• Workflow/Automated Triggers
April 30, 2015 INFORM | TRANSFORM | OUTPERFORM Page | 9
Technology

Examples Contributing to ACO Success - Financial
• Financial model offers returns required to support investment and ensure financial goals
• Understanding how market and population impact utilization and capacity to help define financial forecasts around resources, capital and costs
Financial and Capacity Planning
• Populations are monitored directly against contracts, to get every dollar available by closing gaps in care
Pay for Performance
• Understanding of total medical expenditure and cost drivers across the population of patients
• Moving some care to lower cost sites of service (e.g., ambulatory clinics versus hospitals)
Total Medical Expenditures
• Incentive model must account for geographic variability and demographic risk
• Model is based on meeting cost targets, quality targets and efficiencies
Physician Incentive
Model
Financial
• Cost Reporting
• Actuary
• Gains Sharing/Revenue Model
• Capital Budget Planning
• Pay-for-Performance Modeling
• Competitive Cost Benchmarking
April 30, 2015 INFORM | TRANSFORM | OUTPERFORM Page | 10

Managing Risk and Margin
Risk Performance+
+
In-network utilizationMarket Share growth (new patients)
Excellent Expense Management
Market Share loss Poor expense management
Increased volume comesfrom excess utilization in higher
cost settings
Preventable Admissions (PQI)30 Day Readmissions
Care in “Lowest cost setting”
Population Health
Op
era
tin
g M
argi
n
Fee for Service
April 30, 2015 INFORM | TRANSFORM | OUTPERFORM Page | 11

Catholic Medical Partners Path to Clinical Integration (CI)
Registry Program/ Align Clinical
Integration Between Physicians and the
Health System
EHR Adoption, Reporting
& InteroperabilityMeaningful Use
Embedded Care Coordination / Care
Transitions
NCQA AccreditationPatient Centered
Medical Home
High Performing Health Care System
April 30, 2015 INFORM | TRANSFORM | OUTPERFORM Page | 12
CI E
volu
tio
n
April 30, 2015 INFORM | TRANSFORM | OUTPERFORM Page | 13
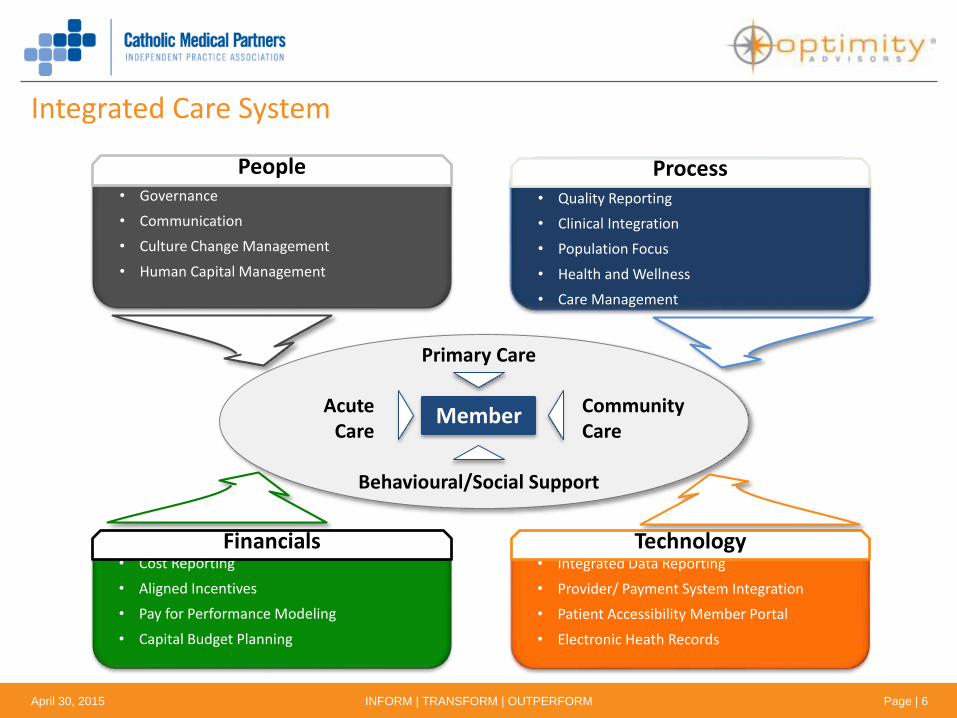
CI Mitigates Incentive Disconnect Between Fee-For-Service, ACO Reimbursement
Source: The Advisory Board

Utilization
• Prevent unnecessary inpatient admissions
• Minimize inappropriate or duplicative care delivery
• Refer patients to most appropriate and efficient specialists, sites of care
Expense Management
• Create and follow evidence-based care pathways
• Streamline costs through adherence to standards
• Develop economies of scale across continuum for all growth service lines
Clinical Outcomes
• Minimize preventable readmissions
• Proactively manage chronic illness to prevent low-margin inpatient utilization
• Promote community wellness for at-risk populations
Physician Assistance Key to Achieving ACO Objectives
April 30, 2015 INFORM | TRANSFORM | OUTPERFORM Page | 14
Source: The Advisory Board
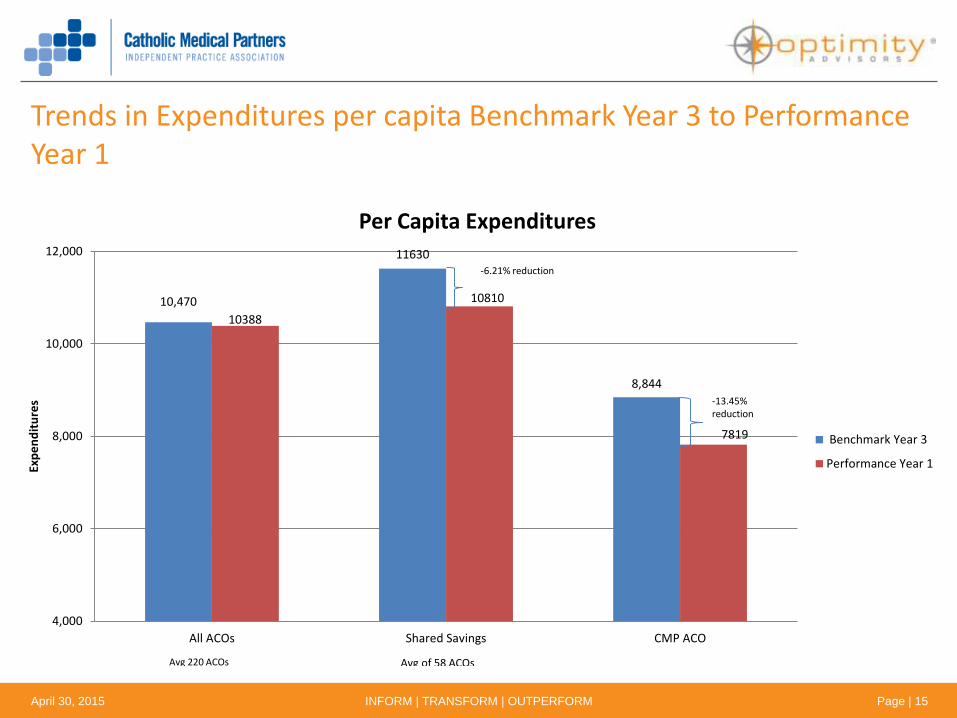
Trends in Expenditures per capita Benchmark Year 3 to Performance Year 1
10,470
11630
8,844
10388
10810
7819
4,000
6,000
8,000
10,000
12,000
All ACOs Shared Savings CMP ACO
Exp
en
dit
ure
s
Per Capita Expenditures
Benchmark Year 3
Performance Year 1
-6.21% reduction
-13.45% reduction
Avg of 58 ACOsAvg 220 ACOs
April 30, 2015 INFORM | TRANSFORM | OUTPERFORM Page | 15

Trends in Expenditures- Average percentage change in Inpatient and other components Benchmark Year 3 to Performance Year 1
• Inpatient expenditures dropped for ACOs
with shared savings.
• ACOs that received shared savings showed
its largest reduction in expenditures in the
following categories:
o DME Expenditures
o Skilled nursing facilities
-19.84%
-12.95%
-9.48%
-45.33%
-14.39%
-17.88%
DME Expenditures
Inpatient and Other Component Expenditures
CMP ACO Other ACOs w/Shared Savings
InpatientExpenditures
Skillednursing facilities
April 30, 2015 INFORM | TRANSFORM | OUTPERFORM Page | 16

Trends in Utilization - Average percent change in hospital and other utilization categories Benchmark Year 3 to Performance Year 1
• ACOs that received shared savings (and
were in the top 25 quartile for percent
changes) showed its largest reduction
in utilization in the following
categories:
o ED visits leading to
hospitalizations
o Hospitalizations
o 30 day readmissions
o SNF discharges (**not provided
data until Jan 2014)-6.99%
-12.06%
-11.16%
-21.00%
-22.00%
-28.00%
Hospitalizations
Utilization Categories
CMP ACO Other ACOs w/Shared Savings
ED visits led to hospitalizations
30 dayreadmissions
April 30, 2015 INFORM | TRANSFORM | OUTPERFORM Page | 17

Performance Year 1 Challenging Measures
CMP ACO exceeded the average by 28% for the diabetes composite measure.
ACO’s, on average, experienced challenges with mean performance rate falling below 50% related to measures for the Diabetes population, Falls Risk and Depression screening.
April 30, 2015 INFORM | TRANSFORM | OUTPERFORM Page | 18

Performance Year 1 Room for Improvement Measures
CMP, ACO out performed other ACOs (on average) in reducing all condition admissions and admissions for
patients with COPD/Asthma, but there is room to improve for admissions related to HF.
April 30, 2015 INFORM | TRANSFORM | OUTPERFORM Page | 19

Washington, DC | Brussels |London | Los Angeles| New York | Zurich
Optimity Advisors
1600 K Street NW, Suite 202Washington, DC 20006
www.OptimityAdvisors.com
Questions?