Embed Size (px)
Citation preview

The Road to OptimizationUtah Broadband Summit
Todd Westberg – UPS Information Technology Director

UPS Facts
2
Founded in Seattle, Washington – 1907, HQ in Atlanta GA
435,000 employees, 220+ countries and territories
99,2892 package cars, vans, tractors, motorcycles, etc.
237 owned airplanes / 302 chartered (9th largest) -1,955 segments
Drive 2.5+ billion miles / year (U.S. alone)
Daily flight segments – 936 U.S. / 755 Int’l
Deliver 18 million packages a day / 8.2 million daily deliveries
UPS / Supply Chain & UPS Freight, UPS Stores and UPS Capital Corp
(Service parts logistics; technical repair and configuration, supply chain design and planning, returns mgmt.)

3
Chief Information Officer Dave Barnes
Number of technology employees 4, 443 + (1,009 FS technicians)
Physical Servers 21,484
Laptops and Desktops 211,278
UPS Global Telecommunications Network
Network Sites 3,479
Operating facilities served 1,990
UPS IT Support
Technology Facts

4
Data Centers Mahwah, NJ / Atlanta, GA
Mainframes 10
Mainframe Capacity (Millions of instructions/second – MIPS) 72,979
Petabytes of mainframe and UNIX storage 16.1
UPS Data Center
Technology Facts

5
www.ups.com Average Daily Usage
Page Views 33.4 million
Peak Day Page Views 50.8 million
Online Tracking Average Daily Usage
Tracking requests 58.2 million / business day
Peak Day Tracking requests 100.9 million
UPS Online
Technology Facts

6
Chasing Big Data

7
Big Data can transform businesses.
Big Data expands customer intelligence. Imagine telling your customer why they are calling
before they even ask the question!
Big Data improves operational efficiencies. Let’s start by looking at a big number:
Keep that number in mind while we look at the progression in data usage that we have
seen at UPS.
Any idea what that number represents?
Why is BIG DATA a BIG Deal?
668950291344912705758811805409037258675274633313802
981029567135230163355724496298936687416527198498130
8157637893214090552534408589408121859898481114389650
005964960521256960000000000000000000000000000

UPS has moved up the data maturity ladder starting with
methods and measurement, and moving to optimization.
70%
30%
16%
3%
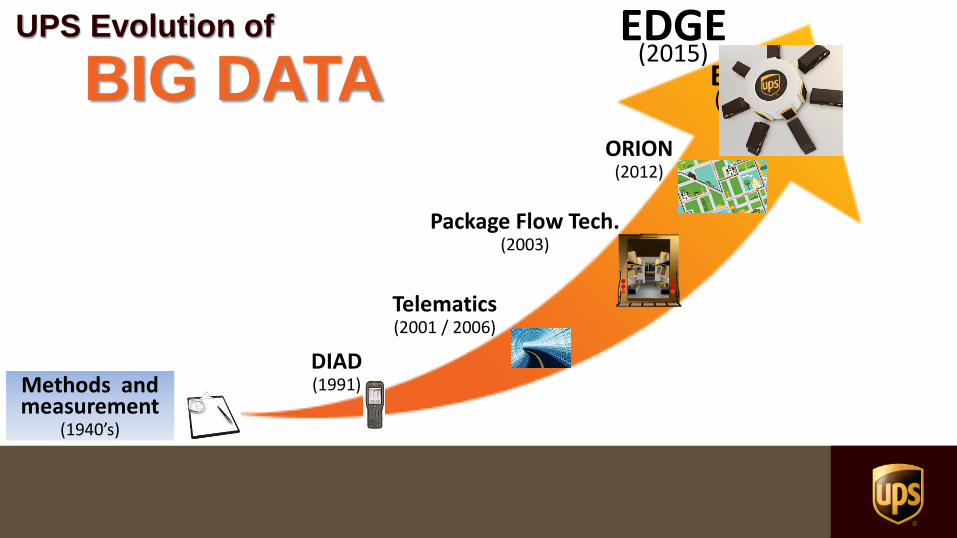
UPS Evolution of
BIG DATA
DIAD(1991)
Telematics(2001 / 2006)
Methods and measurement
(1940’s)
ORION(2012)
Package Flow Tech.(2003)
EDGE(2015)
70%
30%
16%
3%
UPS Evolution of
BIG DATA
DIAD(1991)
Telematics(2001 / 2006)
Methods and measurement
(1940’s)
ORION(2012)
Package Flow Tech.(2003)
EDGE(2015)

<#>
UPS has been utilizing Big Data
for over 20 years
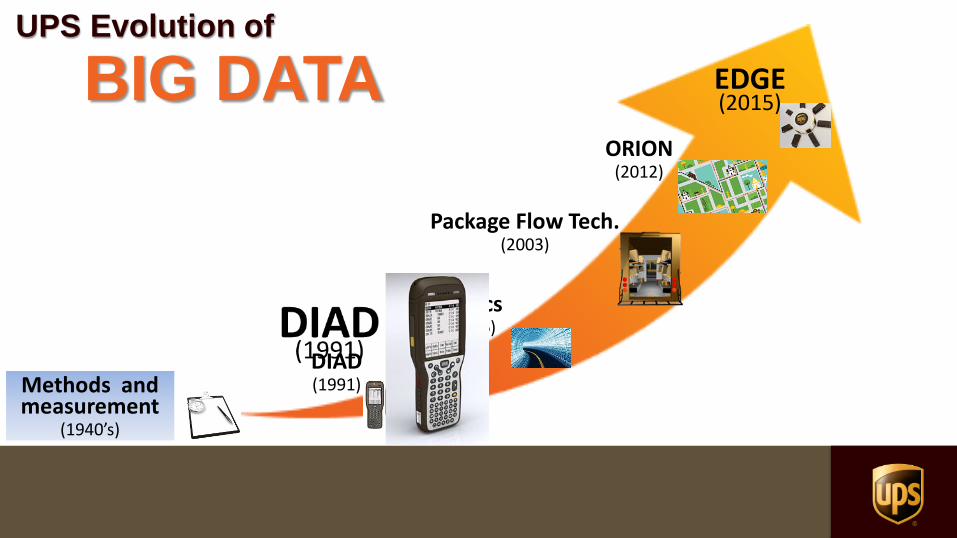
Delivery Information
Acquisition Device
(DIAD)
11
DIAD I
1990
DIAD II
1993
DIAD III
1999
DIAD IV
2004
DIAD V
2011
UPS has been utilizing Big Data
for over 20 years

12
Enhanced DIAD
Download (EDD)

13
Changing the DIAD from an Acquisition device to a
driver Assistant for making better decisions
Number of
Packages
Shelf
Location
Additional Activity(COD, signature, etc.)
Commit
Time
Address
Information

14
Keeping our promise to the customer
Enabling more services
Street # Street NameAdult Signature Required
3924 PLANDOME RD
------------------------------------------
1 Col Amt Ship # ID# Remark
1 #000000 675 CAL
Edit Dup Ship#<6 PreRec Ovrride
PkgInfo NonDel Notes Deliver
Park at Dock OnlyMailroom
Check in with SecurityUse freight elevator
No Indirect/Reroute/LA
Edit Dup Ship#<6 PreRec Ovrride

70%
30%
16%
3%
UPS Evolution of
BIG DATA
DIAD(1991)
Telematics(2001 / 2006)
Methods and measurement
(1940’s)
ORION(2012)
Telematics(2001 / 2006)
Package Flow Tech.(2003)
EDGE(2015)

16
Telematics
Telematics provides additional
sources of data

17
Speed Seat belt off in travel
Delivery while idling Route overlap
0 500 1,000 1,500 2,000 2,500
664463
664452
664049
664034
663547
663502
663481
663314
662783
661578
140120
134425
134416
134404
134370
134356
August 28 - Sep 1
Engine Speed to Road Speed - MBENZ - Roswell
10
20
30
40
50
01 Oct 06 01 Nov 06 01 Dec 06 01 Jan 07date
avgofpercent engine load engload_ucl
Percent Engine Load: Vehicle 131370
Predictive Failure Analysis
Telematics closes the loop by providing
detailed analysis

18
Integrated Data
Allows for Diverse Usage
Visibility on primary and behavioral characteristics that affect fuel consumption
1. Automotive 2. Safety 4. On-Road Performance 5. Work Measurement
Vehicle Diagnostics Data,
Fault Codes, and Usage
Cycles can be used to
anticipate part failure and
predict vehicle
breakdowns.
Through GPS, DIAD, and
Sensor Devices (Seatbelt,
Bulkhead Door, and
Reverse), a driver’s driving
habits can be monitored
and areas of improvement
can be displayed visually
on maps.
Dispatch Planning process
may be enhanced and
simplified through “Work
Area” Concept. Dispatch
planning & address
validation processes may
be enhanced and
simplified through GPS
data.
Combining GPS and DIAD
data displayed on maps,
allows us to monitor and
analyze daily driver travel
paths and highlight excess
miles and dispatch
inefficiencies.
Using GPS, DIAD, and
Map data, has allowed us
to enhance, automate and
simplify several steps in
On-Road time study and
work measurement
processes.
2. Safety 3. Dispatch Planning 4. On-Road Performance 5. Work Measurement1. Automotive
Ap
plic
ati
on
A
rea
s

70%
30%
16%
3%
UPS Evolution of
BIG DATA
DIAD(1991)
Telematics(2001 / 2006)
Methods and measurement
(1940’s)
ORION(2012)
Package Flow Tech.(2003)
Package Flow Tech.(2003)
EDGE(2015)

10- 20510- 245 10- 145
10- 005
10- 14010- 20010- 320
10- 240
10- 32510- 36510- 455
10- 405
10- 45010- 600 10- 400
10- 360
1118
To reduce driver time and miles, packages are loaded in a
general order of delivery based on preload knowledge
Prior to PAS

Simplification through Package Level Detail (PLD)
UPS Smart Labels act as a “trip ticket” to carry
packages through the network and the final mile

The preloader still loads the package in the General order of
delivery, but the package is now smart and tells the preloader
where it belongs.
1118

Breakthrough Change
UPS Data Infrastructure
Customer
Address(USPS)
Geography(Map)
UPS Proprietary
Regulatory
GPS
Vehicle
Service
The UPS model is designed to know where every package is,
where it is going, where it needs to go, and why.

25
Delivery Forecasting and
Planning

Each package planned on the
right vehicle for the right day

27
New Products
based on Data Architecture
• Delivery Alerts• Delivery Planner • Reschedule Delivery • Hold for Will Call• Authorize Shipment Release • "Leave at" Instructions (Driver
Instructions) • Leave with Neighbor• Deliver to a UPS Store• Deliver to Another Address• Approx. delivery time• Confirmed Delivery Window (2-hour)

28
Smart Stop
Improving Service
Every delivery at the right location
29
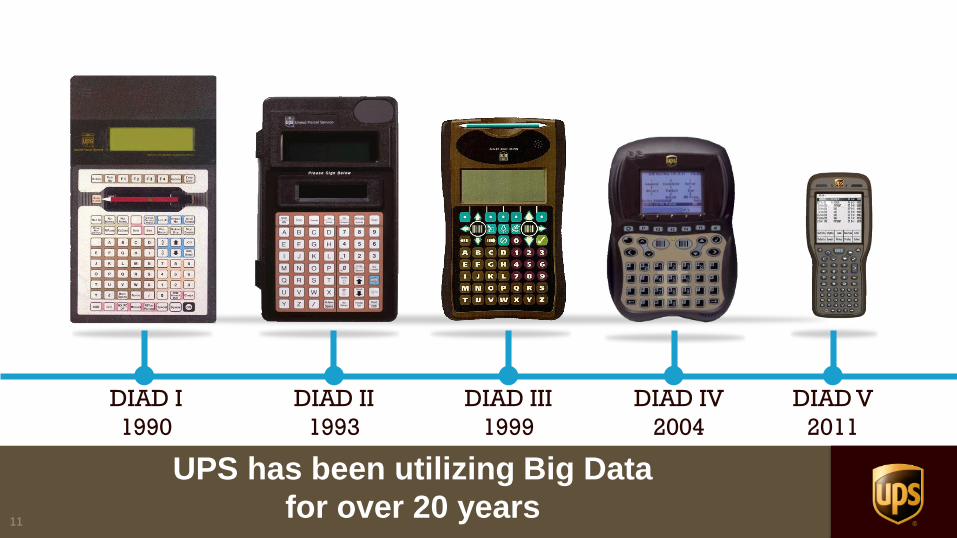
Real-time Request Execution
Through the use of our technology, our devices are
connected to our infrastructure AND to the customer.

30
The Impact (so far…)
85 million miles
driven reduced
8 million gallons
of fuel reduced
85,000 metric tons of
emissions reduced
Improvements in Safety, Service, and Performance
95% reduction
in loader
training time
Highest service
levels in
history
First of their kind
product offerings
>99.9% seatbelt usage 8 Billion fewer manual
entries by drivers

70%
30%
16%
3%
UPS Evolution of
BIG DATA
DIAD(1991)
Telematics(2001 / 2006)
Methods and measurement
(1940’s)
ORION(2012)
ORION(2012)
Package Flow Tech.(2003)
EDGE(2015)

32
On-Road Integrated Optimization & Navigation (ORION)
Operations Technology
Foundation
UPS Data Model
UPS’ ORION Algorithm
Additional Planning / Analysis Tools
UPS Technology
Infrastructure
Customized Map Data
ORION
ORION builds upon UPS’ rich technology foundation

33
• Optimizes a driver’s route using:
– Advanced mathematical models
– Data from planning systems
– Customized map data
• Accounts for business rules, customer needs, and
service commitments
• Allows “what if” analysis and decision making
• ORION can enhance customer service and reduce
the numbers of miles driven by determining the most
efficient delivery route.
Previous Route
ORION Route
On-Road Integrated Optimization & Navigation (ORION)

34
250 Million Global Data Points are used to optimize
routes based on exact delivery locations.
ORION
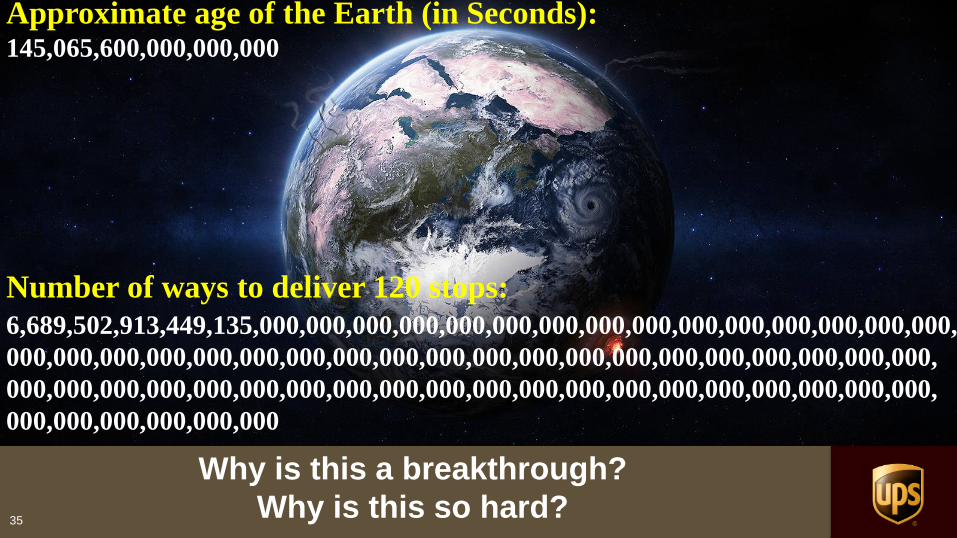
35
Why is this a breakthrough?
Why is this so hard?
Approximate age of the Earth (in Seconds):145,065,600,000,000,000
Number of ways to deliver 120 stops:
6,689,502,913,449,135,000,000,000,000,000,000,000,000,000,000,000,000,000,000,000,
000,000,000,000,000,000,000,000,000,000,000,000,000,000,000,000,000,000,000,000,
000,000,000,000,000,000,000,000,000,000,000,000,000,000,000,000,000,000,000,000,
000,000,000,000,000,000

36
ORION “sorts the list” from a General order to a
Specific order for the day’s specific conditions

37
Demonstrating Complexity
The ORION Test
What is the most cost effective way to
serve these customers?

38
What is the most cost effective way to
serve these customers?
Drivers have to worry about commit times, customer needs, and business rules etc…
How would one deliver all these points (there are 147)

Which route has fewer miles?
One has more than 10 miles

40
The ORION
Test
on NOVA
Working smarter rather than harder

41
Business rules add additional complexity
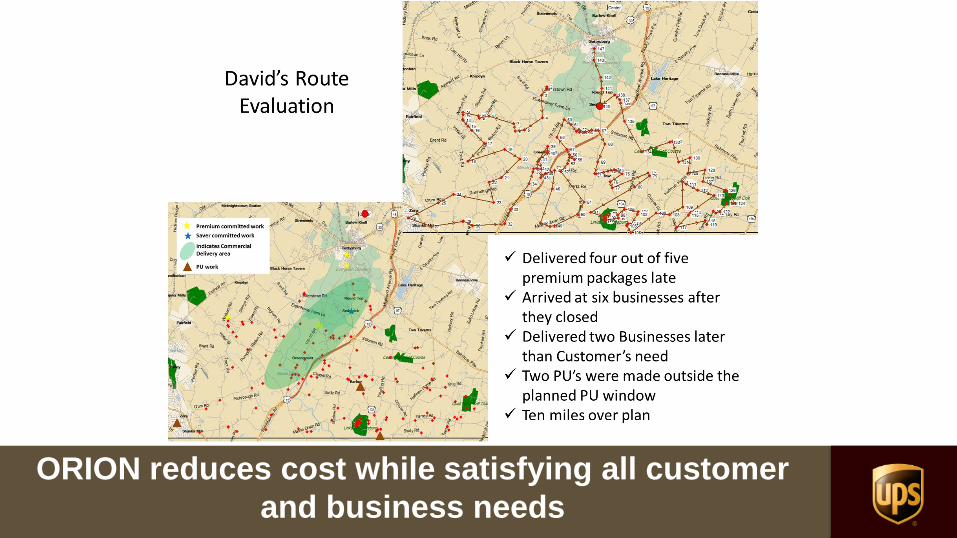
ORION reduces cost while satisfying all customer
and business needs

<#>
70%
30%
16%
3%
UPS Evolution of
BIG DATA
DIAD(1991)
Telematics(2001 / 2006)
Methods and measurement
(1940’s)
ORION(2012)
Package Flow Tech.(2003)
EDGE(2015)
EDGE(2015)

Breakthrough Change
UPS Data Infrastructure
Customer
Address(USPS)
Geography(Map)
UPS Proprietary
Regulatory
GPS
Vehicle
Service
What’s new for 2015? Listen to the following video as UPS moves
into the age of Enhanced Dynamic Global Execution systems.

<#>46

47
Big Data enabled the start of fully automated facilities.
These facilities feature new technologies for material handling and a sophisticated sorting
system.
They use the latest technologies to speed the sorting of "smart" packages and to reduce
the physical workload for employees.
Packages are immediately run through a scanner where information about the package is
captured by high-speed computers.
UPS's internally developed software uses that information to electronically guide the
package through the facility, directing it to the proper truck for delivery. The software,
designed to work in any automated UPS facility, even indicates the precise spot on the
truck where the package should be placed to ensure efficient delivery.
Automation
Let’s look at technology from a package’s perspective!
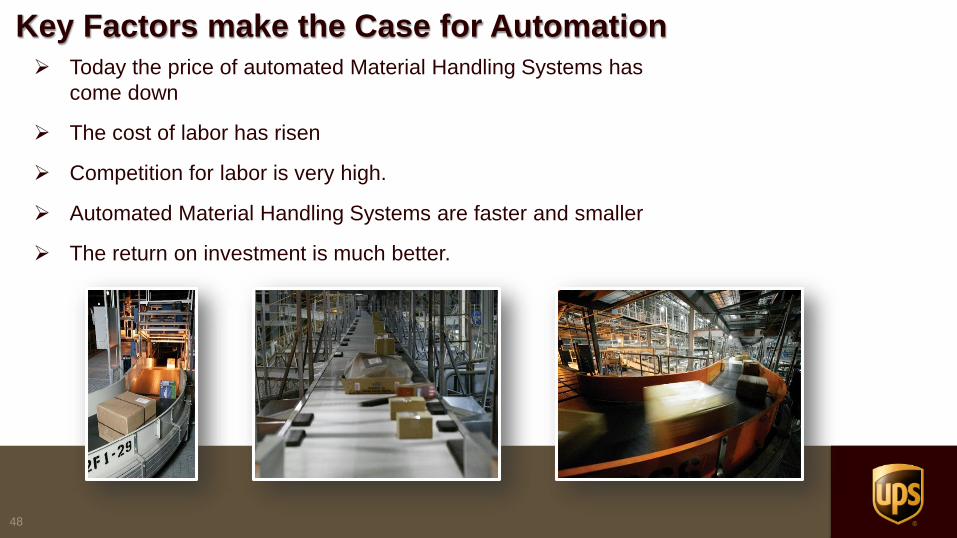
48
Today the price of automated Material Handling Systems has
come down
The cost of labor has risen
Competition for labor is very high.
Automated Material Handling Systems are faster and smaller
The return on investment is much better.
Key Factors make the Case for Automation

49
High Speed Package Singulators
Converting bulk flow into single file flow
BULK Package Flow Singulated Flow
Singulator

50
6-Sided Camera Decode Tunnels
Decoding the bar and Maxicode labels

51
High Speed Label Applicators
Applying PAS labels at high speed

52
High Speed Parcel Sorters
Sorting Parcels to their Destinations

<#>