Embed Size (px)
Citation preview

2009 Tire Inflation
and Attitudinal
Study
May, 2010
2009 Tire Maintenance Study
CONTENTS
1.Stakeholders2.Background3.Methodology4.Vehicles Surveyed5.Tire Data6.Tire Care Attitudes & Habits
2

2009 Tire Maintenance Study
STAKEHOLDERS
The Rubber Association of Canada is the national trade association representing the interests of tire manufacturers.
The Consumer Tire Inflation Study is part of The Rubber Association of Canada’s Consumer Tire Education Initiative.
http:// www.rubberassociation.ca
3

2009 Tire Maintenance Study
STAKEHOLDERS
DesRosiers Automotive Consultants Inc. (DAC) has, for nearly 25 years, been a primary source of market research and management consulting to Canada’s automotive sector.
Our clients have included companies from along the full length of the automotive sector supply chain, from raw material suppliers to OE parts suppliers, vehicle assemblers, dealer organizations and aftermarket manufacturers and distributors. As well, we have completed assignments for government departments and agencies at all levels, industry associations and have worked extensively with financial institutions providing sector analysis and market risk due diligence services.
http://www.desrosiers.ca
4

2009 Tire Maintenance Study
STAKEHOLDERS
Natural Resources Canada’s Office of Energy Efficiency (OEE) is Canada's centre of excellence for energy conservation, efficiency and alternative fuels information. The OEE is mandated to strengthen and expand Canada's commitment to energy efficiency in order to help address the Government of Canada's policy objectives.
In addition, the OEE offers grants and incentives and other resources, including workshops for professionals, statistics and analysis, awards and hundreds of free publications
http://oee.nrcan.gc.ca
5

2009 Tire Maintenance Study
STAKEHOLDERS
AUTO21 is a multi-disciplinary, auto-related research and development (R&D) initiative established by the Canadian Federal Networks of Centres of Excellence (NCE) program.
The federal government established the AUTO21 NCE to help position Canada as a leader in automotive research and development. To achieve this mandate, AUTO21 supports researchers at universities across the country who are working on innovative, applied auto-related research.
Partnering the public and private sectors, AUTO21 currently supports more than 300 researchers across Canada working on 54 auto-related projects in a variety of areas.
http://www.auto21.ca
6

2009 Tire Maintenance Study
BACKGROUNDThe Consumer Tire Inflation Study sampled consumers in six locations across Canada to determine current knowledge, attitudes, and practices regarding their vehicle tire inflation pressure.
Toronto
SherbrookeFredericton
WinnipegCalgary
Vancouver
7

2009 Tire Maintenance Study
BACKGROUND
Objective
• The 2009 Tire Study serves to determine the current knowledge levels and motivators of Canadian consumers in regards to tire inflation and tire maintenance.
• Specifically, this study was implemented to determine if Canadians have improved their tire inflation habits since 2003, when a national under inflation problem was revealed by a similar study.
• The 2003 study set the benchmark for the level of tire inflation (under/over inflation) across Canada. The current study was designed to replicate its predecessor as closely as possible in order to provide an “apples to apples” comparison with the results from 2003.
8

2009 Tire Maintenance Study
BACKGROUND
Data
• The results presented represent the complete data set, consisting of 1,811 survey respondents.
• For some questions, some survey data was omitted, either due to lack of respondent willingness to answer said question, or to ensure quality control in the case of survey inconsistencies. These adjustments were few and minor, and do not affect the statistical relevance of the study.
9

2009 Tire Maintenance Study
BACKGROUND
Data
• The data set is national in scope, representing respondents from Vancouver in the West to Fredericton in the East.
• Statistically, the total sample is large enough so that the overall results are accurate to within 2.5 percentage points, nineteen times out of twenty.
10

2009 Tire Maintenance Study
• 300 consumer interviews in each of 6 locations across Canada for a total sample of 1800.
• Vancouver - University of British Columbia• Calgary – University of Alberta• Winnipeg – University of Manitoba• Toronto – University of Toronto• Sherbrooke - L'Université de Sherbrooke• Fredericton – University of New Brunswick
• Consumer interviews plus field data collection coordinated by AUTO21
• Vehicles were sampled based on a segment quota system derived from current vehicle registration data for each location.
METHODOLOGY
Overview
11

2009 Tire Maintenance Study
• Through AUTO21, engineering professors at each location were approached, who in turn, hired engineering students to perform the survey.
• Preference was given to 4th year and graduate students.
• The students and professors were trained by DAC in all areas of the survey process, including a walk-through of the survey and where to find certain information, proper measuring techniques, safety procedures, vehicle criteria, and strategies for approaching drivers and conducting a successful survey.
METHODOLOGY
Survey Agents
12

2009 Tire Maintenance Study
• Private passenger vehicles. Not commercial usage.
• Under 4536KG (10,000lbs) gross vehicle weight rating (GVRW)
• Avoided vehicles that had non-original specification, or dual rear wheels and tires.
• Location-specific vehicle segment criteria.
METHODOLOGY
Vehicle Selection Criteria
13

2009 Tire Maintenance Study
• Consumers were approached at self-service filling stations and asked questions about their knowledge and practices regarding the maintenance of their vehicles tire pressure.
• The interview took 12 – 15 minutes. During this interview, tire pressure and tread depth data were collected from the consumer’s vehicle as well as the vehicle make, model, VIN number, and GVWR.
• No consumer names, addresses, or license plate information were collected and all individual data collected during this study will be kept strictly confidential.
METHODOLOGY
Survey Process
14

2009 Tire Maintenance Study
• To help educate consumers on this important topic, participating consumers, and those who declined, were provided with tread depth indicator cards and brochures published by the Rubber Association of Canada and Transport Canada that provide valuable information on proper tire maintenance and road safety.
METHODOLOGY
Survey Process
15

2009 Tire Maintenance Study
• Vehicle Identification Number (VIN)
• Gross Vehicle Weight Rating (GVWR)
• Tire Markings (Sizing)
• Tire Pressure
• Tire Tread Depth
METHODOLOGY
Key Data Fields
16

2009 Tire Maintenance Study
• For the purpose of this study, tire pressure was measured in pounds per square inch (PSI) using only the instruments provided.
• Team members replaced any missing valve caps with stock provided.
• Consumers were notified of a marked difference in the pressure levels in one or more of their 4 tires.
METHODOLOGY
Tire Pressure Measurement
17

2009 Tire Maintenance Study
• Normally, tires should be measured “cold” – when they have been driven for less than 2 km or have been stationary for at least 3 hours. Due to the logistics of the data collection, it was not possible to guarantee “cold” tire samples.
• At the same time, all service station locations were situated in urban areas, predisposing them to a larger “cold” tire sample
• The tire measurement procedure was consistent with what was performed in 2003, allowing for comparison between the two studies.
METHODOLOGY
Tire Pressure Measurement
18

2009 Tire Maintenance Study
• For the purpose of this study, tire tread depth was measured in 32nd of an inch using only the instruments provided.
• Team members measured the centre of the tire tread for tread depth avoiding contact with tire wear bars.
METHODOLOGY
Tire Tread Depth
19

2009 Tire Maintenance Study
• In consideration of consumer safety, team members, to the best of their ability, informed consumers if the following tire/wheel conditions were observed during field data collection:
• Excessive tire wear
• An imbedded object or cut in the tire sidewall
• An imbedded object in the tire tread
• Separation of tread.
• Excessive damage to the rim
• Visible damage to tire valve
METHODOLOGY
Public Safety Issues
20

2009 Tire Maintenance Study
VEHICLES SURVEYED
• The sample representation is slightly younger than that of the national fleet.
2006-201029%2002-
200535%
1997-200125%
1996 & Earlier
8%
Model Year Distribution
21

2009 Tire Maintenance Study
VEHICLES SURVEYED
• A higher proportion of passenger cars were surveyed relative to Canadian registrations.
• Lower light truck representation was seen among pick up trucks and vans.
Small / Sport Car40%
Large / Luxury Car26%
Small Sport Utility9% Large
Sport Utility10%
Pick Up Truck6%Van
9%
Segmentation Distri-bution
22
2009 Tire Maintenance Study
VEHICLES SURVEYED
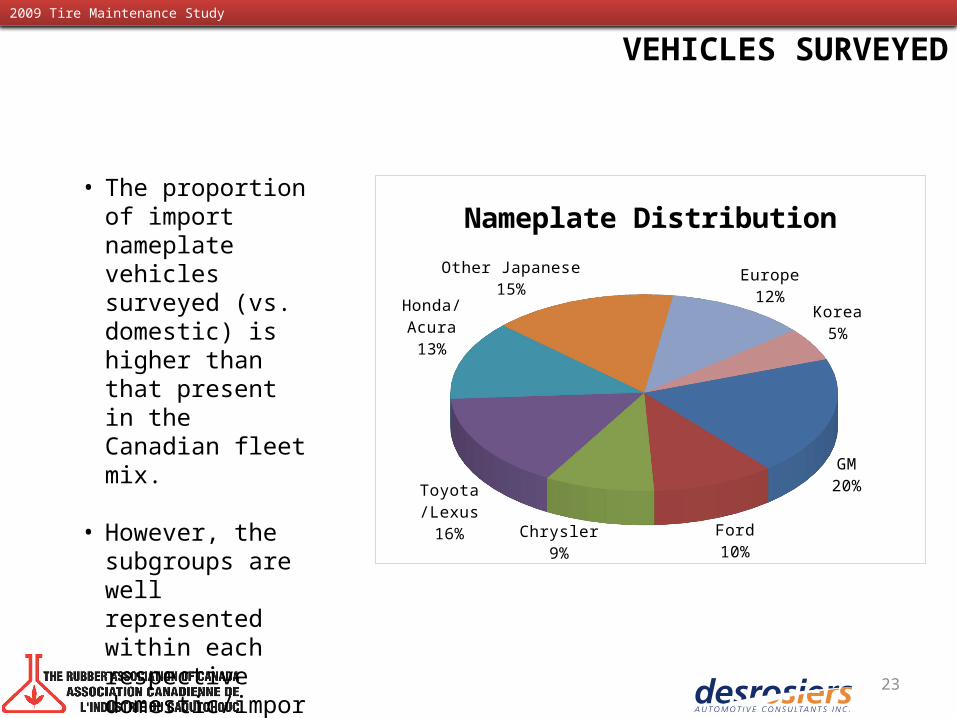
• The proportion of import nameplate vehicles surveyed (vs. domestic) is higher than that present in the Canadian fleet mix.
• However, the subgroups are well represented within each respective domestic/import designation.
GM20%
Ford10%
Chrysler9%
Toyota/Lexus16%
Honda/Acura13%
Other Japanese15% Europe
12%Korea
5%
Nameplate Distribution
23

2009 Tire Maintenance Study
VEHICLES SURVEYED
• The spectrum of odometer readings is relatively even across the sample.
0-50K29%
50-100K25%
100-150K20%
150-200K13%
200K+13%
Odometer Readings (Km)
24

2009 Tire Maintenance Study
CONSUMERS SURVEYED
• The age of the consumers sampled reflects the age of drivers across Canada.
16-2425%
25-4549%
46-6923%
70+3%
Age Distribution
25

2009 Tire Maintenance Study
CONSUMERS SURVEYED
• More men responded to the survey than women.
• The male/female split is much closer to even than the 2003 study (70:30). Male
59%
Female41%
Male / Female Mix
26

2009 Tire Maintenance Study
TIRE DATA
26 27 28 29 30 31 32 33 34 35 36 37 38 39 40 41+0
50100150200250300350400450500550
Recommended Tire Pressure
Front Tire
PSI
Resp
onse
s
• Recommended tire pressure varies across a broad range, as vehicle sizes and weights differ. The majority of OEM recommended tire pressure falls under 30, 32, and 35 psi..
27

2009 Tire Maintenance Study
TIRE DATA
2009 20030%
10%
20%
30%
40%
50%
60%
70%
80%
48.8%
71.0%
Vehicles with at least One Over/Underinflated
Tire: 2009 vs. 2003• Tire inflation in Canada
has improved vastly from the 2003 study to the 2009 study, as the proportion of vehicles with at least one tire more than 10% above or below OEM recommendation fell from 71% to 49%.
28

2009 Tire Maintenance Study
TIRE DATA
0%10%20%30%40%50%60%
200910.5%
200931.5%
20099.7%
200930.3%2003
23.0%
200356.0%
200317.0%
200340.0%
Inflation Problems per Vehicle: 2009 vs. 2003
• Improvements in both under and overinflation are evident in the 2009 study. Of particular note, underinflation of at least one tire has subsided, falling from 56% in 2003 to 32% in 2009.
29

2009 Tire Maintenance Study
TIRE DATA
• Improved consumer education, awareness and attitudes
• Increase in tire changeovers (for winter tires – spring and fall)
• Advanced technology – nitrogen inflation and the proliferation of Tire Pressure Monitoring Systems
• Differences in the average ambient temperatures recorded during each study – the 2003 study was performed in the winter while the 2009 study was performed in the summer/fall.
30
Possible Rationale for Improved Tire Inflation Results

2009 Tire Maintenance Study
TIRE DATA
Vancouver Calgary Winnipeg Toronto Sherbrooke Fredericton0%
10%
20%
30%
40%
50%
60%
70%
80%
90%
59.1%66.9%
45.5%57.7% 53.0%
20.3%
68.0%77.0%
63.0%69.0%
75.0% 70.0%
Proportion of Vehicles With at Least One Problem Tire (By Inflation): 2009 vs.
2003(more than + or – 10%) – By Survey Site2009 2003
National Average 2009
National Average 2003
31

2009 Tire Maintenance Study
TIRE DATA
0-50K 50-100K 100-150K 150-200K 200K+0%
10%
20%
30%
40%
50%
60%
70%
80%
90%
40.9% 42.6%51.2%
60.5% 59.8%57.0%67.0%
75.0% 77.0%83.0%
Proportion of Vehicles With at Least One Problem Tire (By Inflation): 2009 vs.
2003(more than + or – 10%) – By Odometer
Reading (Km)2009 2003
National Average 2009
National Average 2003
32

2009 Tire Maintenance Study
TIRE DATA
OVERALL 0-50K 50-100K 100-150K 150-200K 200K +
At least 1 tire under inflated by more than 10%
32% 21% 27% 39% 37% 40%
At least 1 tire under inflated by more than 20%
11% 5% 9% 15% 15% 14%
At least 1 tire over inflated by more than 10%
30% 26% 27% 31% 38% 39%
At least 1 tire over inflated by more than 20%
10% 8% 7% 10% 10% 15%
All Tires Acceptable(within + or - 10%) 51% 59% 57% 49% 40% 40%
Tire Inflation Summary(by Odometer Reading – Km)
33
2009 Tire Maintenance Study
TIRE DATA
Rear Right
Rear Left
Front Right
Front Left
25 26 27 28 29 30 31 32 33 34
32.7
32.7
32.2
32.2
29.8
29.6
29.6
29.62009 Actual
Recommended
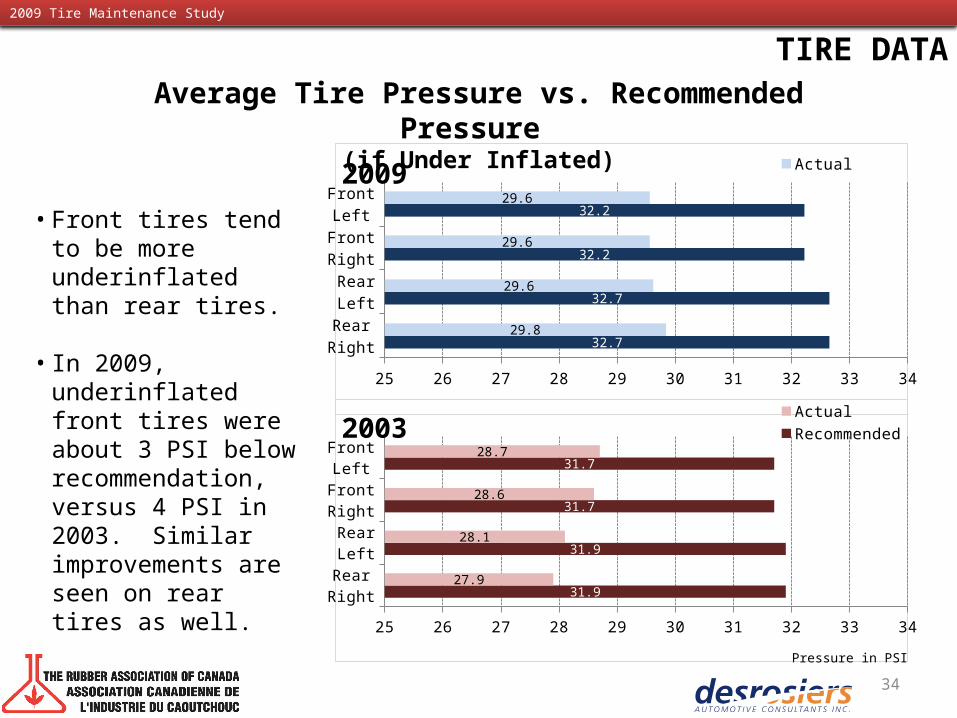
• Front tires tend to be more underinflated than rear tires.
• In 2009, underinflated front tires were about 3 PSI below recommendation, versus 4 PSI in 2003. Similar improvements are seen on rear tires as well.
34
Average Tire Pressure vs. Recommended Pressure
(if Under Inflated)
Rear Right
Rear Left
Front Right
Front Left
25 26 27 28 29 30 31 32 33 34
31.9
31.9
31.7
31.7
27.9
28.1
28.6
28.72003 Actual
Recommended
Pressure in PSI

2009 Tire Maintenance Study
TIRE DATA
Rear Right
Rear Left
Front Right
Front Left
25 26 27 28 29 30 31 32 33 34 35 36
32.7
32.7
32.2
32.2
35.0
35.1
35.4
35.42009 Actual
Recommended
• Similar to underinflation, front tires tend to be more overinflated than rear tires.
• A slight improvement among overinflated tires is seen in 2009 versus 2003.
35
Average Tire Pressure vs. Recommended Pressure
(if Over Inflated)
Rear Right
Rear Left
Front Right
Front Left
25 26 27 28 29 30 31 32 33 34 35 36
31.9
31.9
31.7
31.7
34.1
34.1
35.1
35.32003 Actual
Recommended
Pressure in PSI

2009 Tire Maintenance Study
TIRE DATA
Light Truck - Under
Passenger Car - Under
Light Truck - Over
Passenger Car - Over
0% 5% 10% 15% 20% 25% 30% 35% 40%
15.4%
23.5%
23.7%
19.0%
7.9%
11.6%
13.0%
8.0%
Proportion of Vehicles with at Least One Tire Over/Under Inflated
11%-20% More Than 20%
36

2009 Tire Maintenance Study
TIRE DATA
0-21%
3-410%
5-631%
7-834%
9-1019%11-12
4%13-141%
15 & Over0%
Overall Tread Depth(measured in 32nds of an
inch) • The average tire had a tread depth of 7/32” in 2009.
• Among the 7,000 tires measured, only 74 were recorded as having a tread depth of 2/32” or less, the legal and safety minimum requirement. This equates to 1% of all tires.
37

2009 Tire Maintenance Study
TIRE CARE ATTITUDES & HABITS
When vehicle last serviced
31%
Within last year27%Within last two years
or more5%
Winter/Spring changeover
7%
Never16%
Don't Know14%
“When was the last time you had your tires ro-
tated” - Unaided
2009
38
When vehicle last serviced
26%
Within last year31%
Within last two years or more
4%
Winter/Spring changeover
12%
Never18%
Don't Know10%
2003
• More than half of total respondents indicated having their vehicle’s tires rotated either the last time it was serviced or within the twelve months previous – in both the 2003 and 2009 studies.
2009 Tire Maintenance Study
TIRE CARE ATTITUDES & HABITS
When vehicle last serviced
29%
Within last year26%
Within last two years or more
8%
Never19%
Don't Know18%
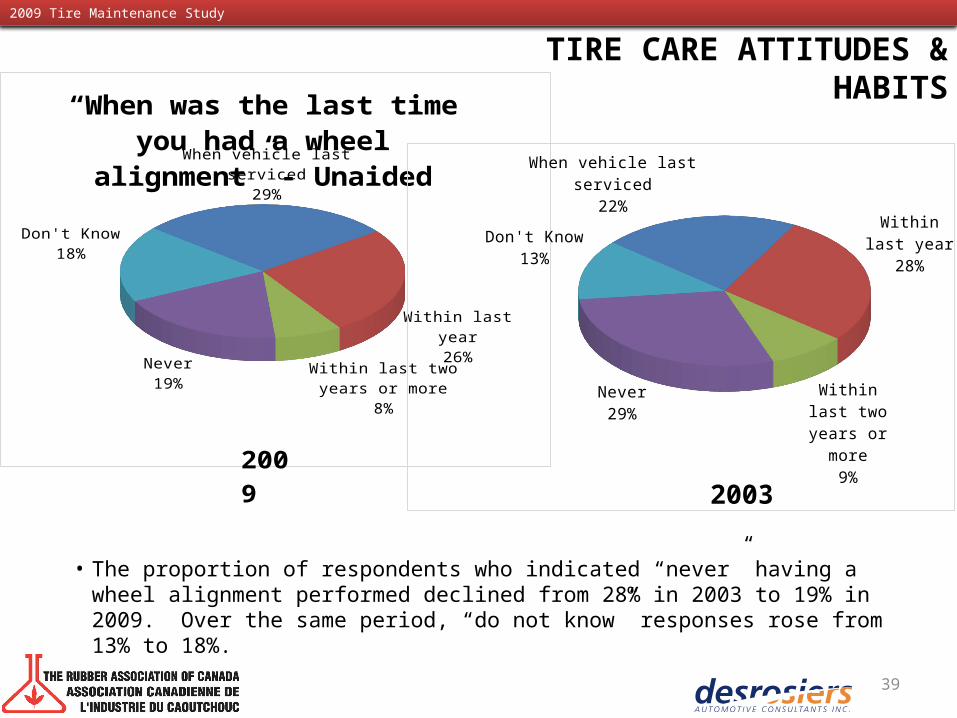
“When was the last time you had a wheel align-
ment” - Unaided
2009
39
When vehicle last serviced
22%Within last
year28%
Within last two years or
more9%
Never29%
Don't Know13%
2003
• The proportion of respondents who indicated “never” having a wheel alignment performed declined from 28% in 2003 to 19% in 2009. Over the same period, “do not know” responses rose from 13% to 18%.

2009 Tire Maintenance Study
TIRE CARE ATTITUDES & HABITS
When warm17% When cold
44%
Either16%
Don't know23%
“When is the best time to check tire pressure?” -
Aided
2009
• Nearly half of Canadian drivers are aware that it is optimal to check tire pressure when tires are cold.
• Respondents who stated “don’t know” made up nearly a quarter of the sample. Including “either” responses, 39% of Canadians do not know when the best time to check tire pressure is.
• “When cold” responses tended to increase consistently with respondent age, rising from 39.0% for 16-24 year olds, to 58.6% for those aged 70 years or older. 40
When warm22% When cold
38%
Either13%
Don't know27% 200
3

2009 Tire Maintenance Study
TIRE CARE ATTITUDES & HABITS
Prevent tread separation
Improve handling
Longer tire life
Improve fuel economy
Overall vehicle safety
1 2 3 4 5
4.39
4.6
4.61
4.42
4.68
4.07
4.46
4.46
4.47
4.51
“Why is maintaining proper tire inflation important to
you?” – Aided (average among those who feel it is
important)(out of 5)
20092003
• When asked to rate each factor, most respondents considered all areas very important.
• From 2003 to 2009, “to improve fuel economy” increased in importance, ranking fourth in 2003 versus second in 2009.
41

2009 Tire Maintenance Study
TIRE CARE ATTITUDES & HABITS
Other
Nothing/Don't know
Change in seasons
Time since last vehicle check/service
A tire pressure monitoring system
Someone else pointed it out
Part of regular routine
Noticed change in handling/steering
Tires looked low
0% 10% 20% 30% 40% 50% 60%8%
5%
3%
6%
2%
3%
21%
24%
53%
4%
6%
6%
8%
17%
18%
21%
30%
57%
“What would lead you to check your tire pressure?” - Unaided
20092003
• Physical cues, such as the tire looking low or changes in handling/steering are the major motivators for getting consumers to check their tire pressure.
42

2009 Tire Maintenance Study
TIRE CARE ATTITUDES & HABITS
Don't know
Other
Visually
Placard in the vehicle
Another person maintains the vehicle
Tire Sidewall Information
Owner's manual
0% 5% 10% 15% 20% 25% 30% 35% 40%
12%
10%
5%
16%
14%
31%
22%
9%
3%
9%
17%
20%
26%
35%
“How do you normally de-termine what pressure to set
your tires?” - Unaided
20092003
• More than a quarter of drivers believe that the appropriate tire pressure is indicated on the tire sidewall.
• 52% of respondents know the correct location to reference recommended tire pressure (owner’s manual or placard), compared to 38% in 2003.
43

2009 Tire Maintenance Study
TIRE CARE ATTITUDES & HABITS
Other
Does not check
Waits for vehicle servicing
Another person normally checks
Visually
Using the gauge on service station air pump
Using a personal air pressure gauge
0% 10% 20% 30% 40% 50% 60% 70%
1%
7%
6%
9%
8%
13%
64%
2%
6%
8%
15%
16%
19%
59%
“How do you normally check your tires for proper inflation?” - Unaided
20092003
• Personal air pressure gauges stand alone as the most common means of checking tire pressure.
44

2009 Tire Maintenance Study
TIRE CARE ATTITUDES & HABITS
Don't Know
Other
Never/Does not normally check
Each change of seasons
When preparing for a long trip
When the car is serviced
Whenever they seem low
0% 10% 20% 30% 40% 50% 60% 70% 80%
9%
6%
4%
24%
37%
39%
61%
4%
3%
6%
25%
43%
57%
69%
“When do you normally check your tires for proper
inflation?” - Aided
20092003
• Physical cues most often determine when a consumer checks their tire inflation.
• Temporal and situational factors are also strong drivers, such as when the car is being serviced, when preparing for a long trip, and when seasons change.
45
2009 Tire Maintenance Study
TIRE CARE ATTITUDES & HABITS
Once a month or
more fre-
quently
Every 2 to 6 months
Every 7 to 11 months
About yearly
Every 2 to 3 years
Don't know/Not
stated
0%
10%
20%
30%
40%
50%
60%
30%
46%
12%7%
2% 3%
39%
49%
3%7%
2% 2%
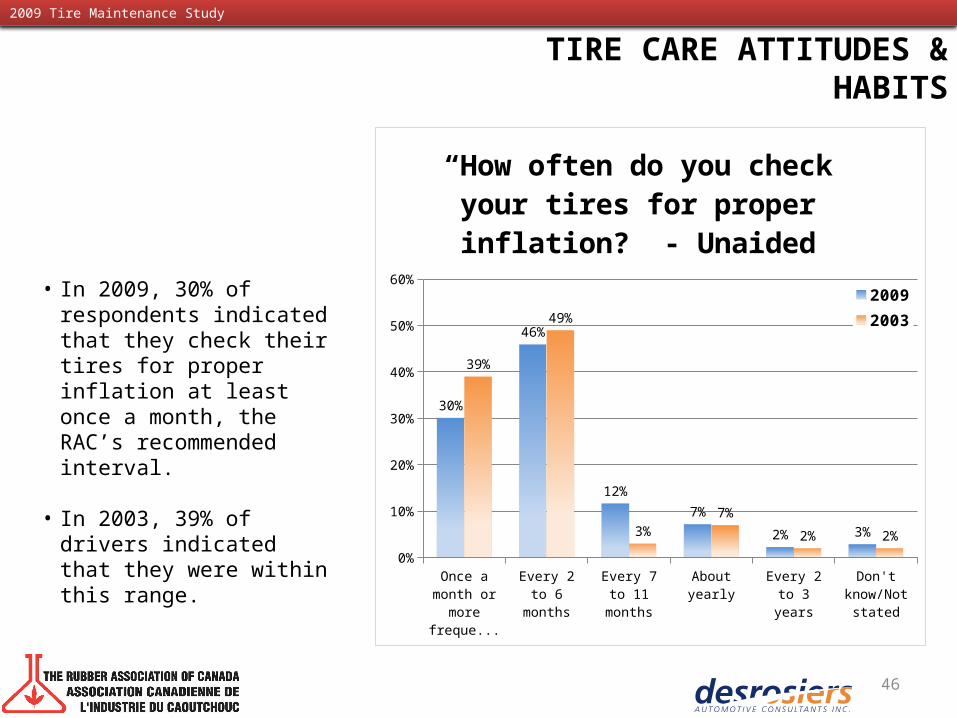
“How often do you check your tires for proper in-
flation? - Unaided
20092003
• In 2009, 30% of respondents indicated that they check their tires for proper inflation at least once a month, the RAC’s recommended interval.
• In 2003, 39% of drivers indicated that they were within this range.
46

2009 Tire Maintenance Study
TIRE CARE ATTITUDES & HABITS
Don't know
Other
Too difficult
Too dirty
Don't know how
It doesn't change that much
It's a waste of time/Not necessary
Didn't know I should
Can't be bothered
0% 5% 10% 15% 20% 25% 30% 35%6%
18%
1%
1%
5%
12%
23%
9%
31%
6%
6%
3%
3%
4%
21%
22%
23%
28%
Reasons for not checking inflation more regularly -
Unaided
20092003
• Considering that 30% of respondents report that they check their tire inflation every month or more often, it is no surprise that many do not believe they should do so more frequently.
• Regardless, there is opportunity for increased consumer education.
47
2009 Tire Maintenance Study
TIRE CARE ATTITUDES & HABITS
Don't know
Other
By mail
With tire clinics
During traffic reports
Public service announcements
Advertising campaign
Notice on the gas pump
0% 20% 40% 60% 80%4%
9%
13%
14%
23%
30%
50%
54%
2%
3%
17%
24%
27%
30%
47%
55%
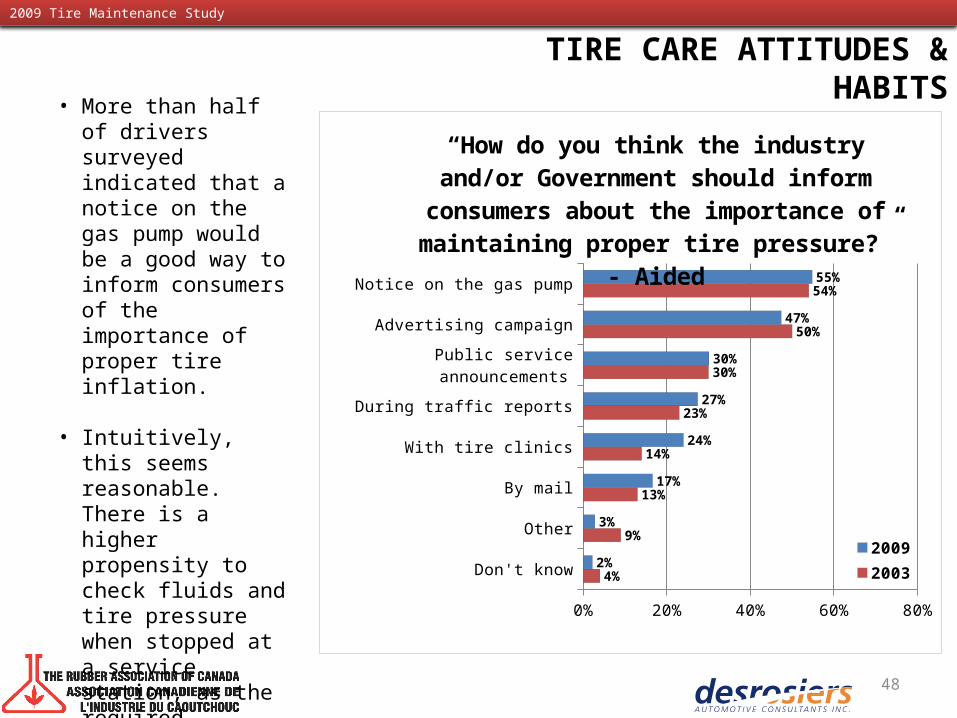
“How do you think the industry and/or Government should inform
consumers about the importance of maintaining proper tire pressure?” -
Aided
20092003
• More than half of drivers surveyed indicated that a notice on the gas pump would be a good way to inform consumers of the importance of proper tire inflation.
• Intuitively, this seems reasonable. There is a higher propensity to check fluids and tire pressure when stopped at a service station, as the required equipment and potential products are readily available.
48
2009 Tire Maintenance Study
TIRE CARE ATTITUDES & HABITS
Yes6%
No77%
Don't know17%
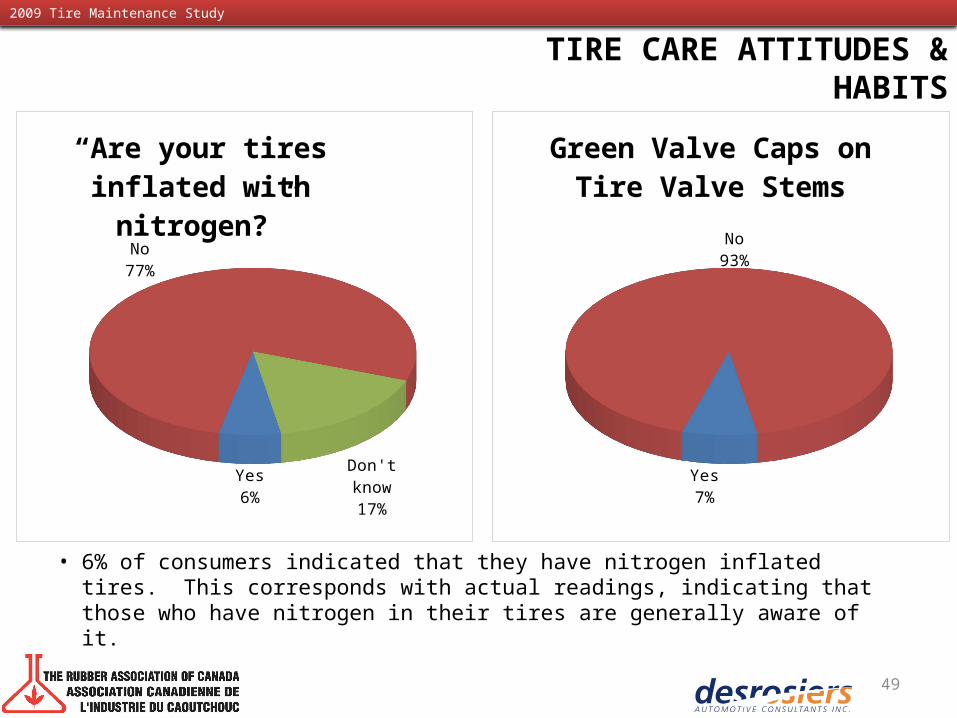
“Are your tires inflated with ni-
trogen?”
Yes7%
No93%
Green Valve Caps on Tire Valve Stems
• 6% of consumers indicated that they have nitrogen inflated tires. This corresponds with actual readings, indicating that those who have nitrogen in their tires are generally aware of it.
49

2009 Tire Maintenance Study
• In 2007, the U.S. government mandated TPMS to come standard on all new light vehicles. This requirement was phased in, with 70% of the total fleet required to come equipped with TPMS in 2007. While Transport Canada has yet to adopt such a policy, most technology and features are commonly shared between vehicles within the two markets, thus increasing TPMS proliferation in Canada as well.
Yes14%
No75%
Don't Know11%
“Is your vehicle equipped with a Tire Pressure Mon-
itoring System?”
50
TIRE CARE ATTITUDES & HABITS

2009 Tire Maintenance Study
TIRE CARE ATTITUDES & HABITS
Aware of location
30%
Not aware of location
60%Said aware but wrong
11%
2009
• Including those who said that they knew where the Placard was, but could not locate it when asked to, 70% of respondents did not know where to find the Placard for their vehicle, or even that such a thing exists.
• This represents a significant opportunity for consumer education, especially among women (vs. men), of whom only 17% said they were aware of the Placard’s positioning and could locate it. 51
Aware of location39%
Not aware of location55%
Said aware but wrong
6%
2003
Awareness of Location of Tire Placard/Sticker

2009 Tire Maintenance Study
TIRE CARE ATTITUDES & HABITS
Have used61%Have not
used36%
Don't know2% 200
9
• Among the 30% of consumers who know where the placard/sticker is located, 61% have actually referenced it to determine correct tire information.
52
Have used62%
Have not used35%
Don't know3%
2003
Use of Placard/Sticker to Determine Correct Tire Information – if aware of location

2009 Tire Maintenance Study
OPINIONS ON AGGRESSIVE DRIVING & FUEL ECONOMY
Following too closely
Consistently weaving through traffic
Fast and hard cornering
Habitual late braking
Speeding
Jackrabbit Starts
1 2 3 4 5
3.86
3.87
4.07
4.19
4.42
4.45
Average Rating of Aggressive Driving Practices as they Af -
fect Fuel Economy(out of 5)
• Canadians consider jackrabbit starts and speeding to have the greatest impact on reducing fuel efficiency.
53
2009 Tire Maintenance Study
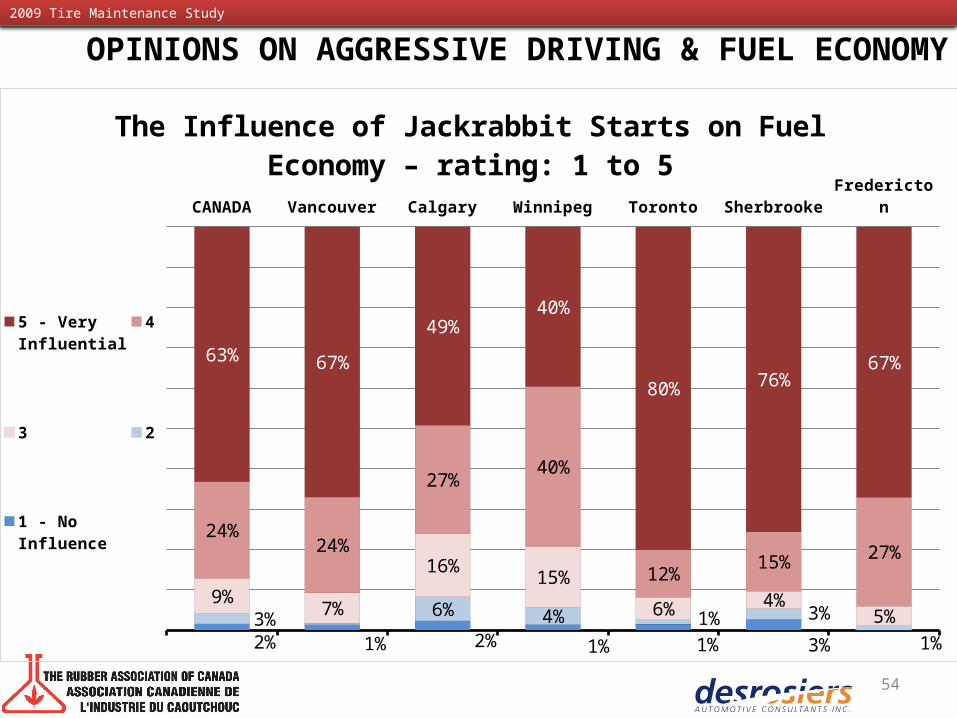
CANADA Vancouver Calgary Winnipeg Toronto Sherbrooke Fredericton
2% 1% 2% 1% 1% 3%3% 6% 4% 1% 3%
1%
9% 7%
16% 15%6% 4%
5%
24% 24%
27% 40%
12% 15% 27%
63% 67%49%
40%
80% 76%67%
The Influence of Jackrabbit Starts on Fuel Economy – rating: 1 to 5
5 - Very In-fluential
4
3
2
1 - No Influence
54
OPINIONS ON AGGRESSIVE DRIVING & FUEL ECONOMY

2009 Tire Maintenance Study
CANADA Vancouver Calgary Winnipeg Toronto Sherbrooke Fredericton
2% 2%4%
2% 3% 2%3% 2% 6% 4% 4%
8% 7%15%
13%3%
7%2%
27% 30%
33% 47%
9%
19%25%
61% 59%42% 35%
85%69% 73%
The Influence of Speeding on Fuel Economy – rating: 1 to 5
5 - Very In-fluential
4
3
2
1 - No Influence
55
OPINIONS ON AGGRESSIVE DRIVING & FUEL ECONOMY

2009 Tire Maintenance Study
CANADA Vancouver Calgary Winnipeg Toronto Sherbrooke Fredericton
3%4% 4% 5%
2% 3% 3%5% 2%
9% 4% 2% 3% 9%14% 10%
20%19%
6% 10%17%
26% 30%
29% 40%
15%19%
24%
52% 53%37% 32%
75%65%
48%
The Influence of Habitual Late Braking on Fuel Economy – rating: 1 to 5
5 - Very In-fluential
4
3
2
1 - No Influence
56
OPINIONS ON AGGRESSIVE DRIVING & FUEL ECONOMY

2009 Tire Maintenance Study
CANADA Vancouver Calgary Winnipeg Toronto Sherbrooke Fredericton
3% 2%4% 4% 7%
1%7% 5%
10% 6%
1%
10%8%
18% 18%
25%21%
3%
22%19%
25% 30%
27% 39%
10%
21%
23%
47% 45%34% 29%
86%
40%49%
The Influence of Fast and Hard Cornering on Fuel Economy – rating: 1 to 5
5 - Very In-fluential
4
3
2
1 - No Influence
57
OPINIONS ON AGGRESSIVE DRIVING & FUEL ECONOMY

2009 Tire Maintenance Study
CANADA Vancouver Calgary Winnipeg Toronto Sherbrooke Fredericton
6% 5% 9%3% 3%
15%
2%
8% 5%12%
6% 5%
14%
4%
20% 21%
30%
24%8%
12%
22%
26% 30%
25%
42%
12%
19%29%
41% 39%24% 25%
72%
40% 43%
The Influence of Consistently Weaving Through Traffic on Fuel Economy – rating: 1
to 5
5 - Very In-fluential
4
3
2
1 - No Influence
58
OPINIONS ON AGGRESSIVE DRIVING & FUEL ECONOMY

2009 Tire Maintenance Study
CANADA Vancouver Calgary Winnipeg Toronto Sherbrooke Fredericton
8% 10% 11% 11% 7%3%
4%7% 9%
17% 10%2% 3% 3%
17%20%
35%
14%
12%6%
18%
27%26%
17%
42%
15% 29%
35%
40% 35%20% 23%
64% 59%41%
The Influence of Following too Closely on Fuel Economy – rating: 1 to 5
5 - Very In-fluential
4
3
2
1 - No Influence
59
OPINIONS ON AGGRESSIVE DRIVING & FUEL ECONOMY

2009 Tire Maintenance Study
OPINIONS ON TIRE RECYCLING
Vancouver Calgary Winnipeg Toronto Sherbrooke Fredericton
43.1%
66.2%
41.7% 37.9%
78.1% 81.2%
56.9%
33.8%
58.3% 62.1%
21.9% 18.8%
Awareness of Provincial Scrap Tire Collection and Recycling System
AWARE
NOTAWARE
AVG: 58.0%
AVG: 42.0%
60

2009 Tire Maintenance Study
OPINIONS ON TIRE RECYCLING
CANADA Vancouver Calgary Winnipeg Toronto Sherbrooke Fredericton
2%6% 7%
1%1% 5%
4% 1%1%
15%
34% 26% 30%
4%10%
4%
29%
28% 39%46%
27%
34%
9%
52%
33% 26%16%
69%54%
87%
Satisfaction with the Manner in which Scrap Tires are Managed – rating: 1 to 5
5 - Very Sat-isfied
4
3
2
1 - Very Unsat-isfied
61

2009 Tire Maintenance Study
OPINIONS ON TIRE RECYCLING
Vancouver Calgary Winnipeg Toronto Sherbrooke Fredericton
54.9%
77.1%
54.4% 51.5%
77.1% 81.8%
45.1%
22.9%
45.6% 48.5%
22.9% 18.2%
Awareness that Recycling Fee is Charged when Purchasing New Tires
AWARE
NOTAWARE
AVG: 66.0%
AVG: 34.0%
62
2009 Tire Maintenance Study
OPINIONS ON TIRE RECYCLING
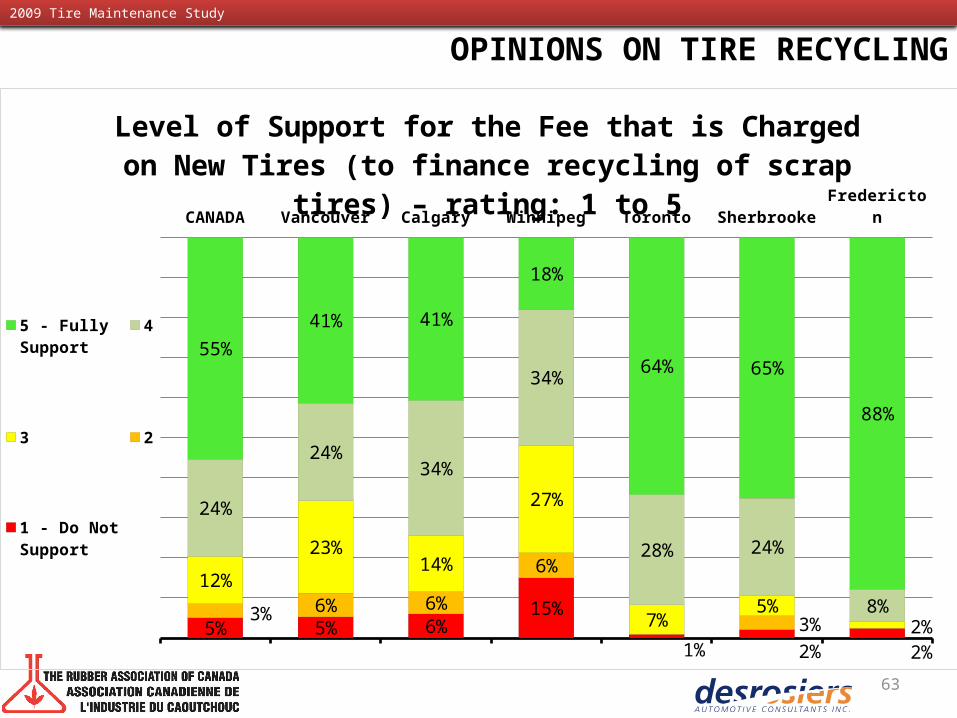
CANADA Vancouver Calgary Winnipeg Toronto Sherbrooke Fredericton
5% 5% 6%15%
1% 2% 2%3% 6% 6%
6%
3%
12%23%
14%
27%
7% 5%2%
24%
24%34%
34%
28% 24%
8%
55%41% 41%
18%
64% 65%
88%
Level of Support for the Fee that is Charged on New Tires (to finance recycling of scrap
tires) – rating: 1 to 5
5 - Fully Support
4
3
2
1 - Do Not Support
63

2009 Tire Maintenance Study
OPINIONS ON TIRE RECYCLING
CANADA Vancouver Calgary Winnipeg Toronto Sherbrooke Fredericton
46%65%
35%50%
68%
32% 25%
3%
2%
6%
7%
1%
4%1%
51%34%
59%44%
31%
64%73%
Satisfaction with What Happens to Tires when they are Scrapped
Scrap Tires are Being Re-cycled Re-sponsibly
Do Not Ap-prove of Re-cycling Op-tions Being Taken
Don't Know/ Don't Care
64

2009 Tire Maintenance Study
OPINIONS ON TIRE RECYCLING
Use of scrap tires as fuel (assuming proper environmental emission controls)
Using tire shred material as light weight fill in civil engineering projects
Using crumb rubber as an additive in asphalt
Using crumb rubber to make sport surfacing or playground material
Using scrap tires to make new rubber products
1 2 3 4 5
3.92
4.17
4.29
4.31
4.44
Average Desirability of Methods to Recycle Tires –
Aided(out of 5)
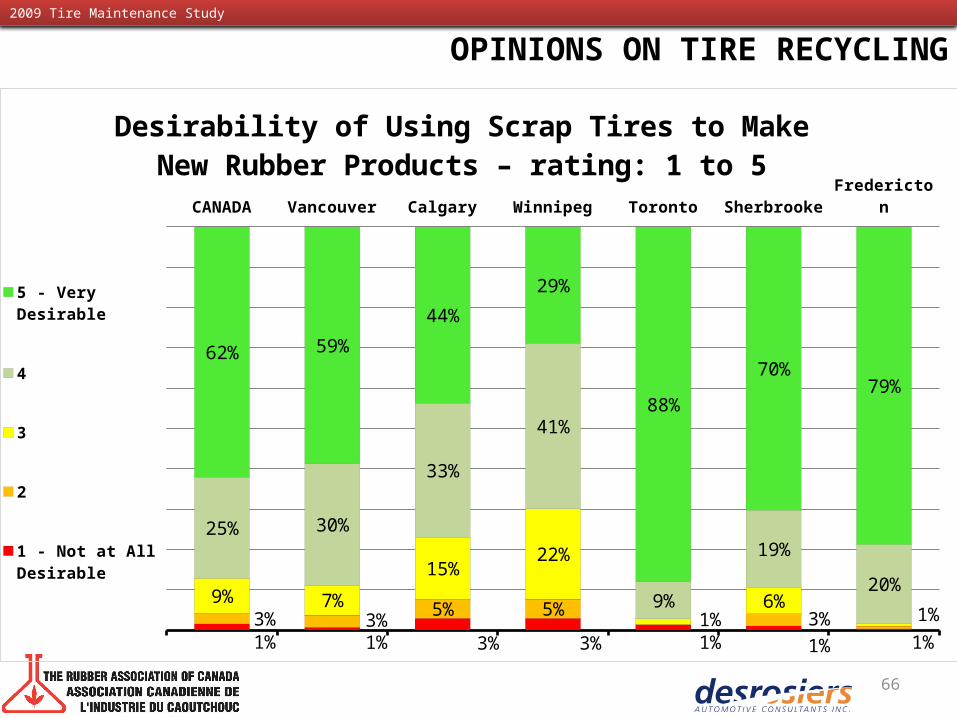
• The recycling of scrap tires to make new rubber products is ranked most desirable among Canadian consumers.
65
2009 Tire Maintenance Study
OPINIONS ON TIRE RECYCLING
CANADA Vancouver Calgary Winnipeg Toronto Sherbrooke Fredericton
1% 1% 3% 3% 1% 1%3% 3% 5% 5% 3% 1%
9% 7%15% 22%
1%6%
1%
25% 30%
33%
41%
9%
19%20%
62% 59%44%
29%
88%70%
79%
Desirability of Using Scrap Tires to Make New Rubber Products – rating: 1 to 5
5 - Very De-sirable
4
3
2
1 - Not at All Desirable
66

2009 Tire Maintenance Study
OPINIONS ON TIRE RECYCLING
CANADA Vancouver Calgary Winnipeg Toronto Sherbrooke Fredericton
3% 2% 3% 3%7%
3%4% 2%
8% 5% 3%4%
11% 8%
19% 23%5% 9%
1%
25%25%
26%
45%
10%21%
24%
58% 63%44%
24%
75%64%
75%
Desirability of Using Crumb Rubber to Make Sport Surfacing or Playground Material – rat-
ing: 1 to 5
5 - Very De-sirable
4
3
2
1 - Not at All Desirable
67

2009 Tire Maintenance Study
OPINIONS ON TIRE RECYCLING
CANADA Vancouver Calgary Winnipeg Toronto Sherbrooke Fredericton
2% 1% 2% 2% 2% 3% 1%4% 4% 4% 6% 1% 4% 4%
12% 13% 13%
26%
3%8% 8%
29% 35% 31%
42%
15%
25% 28%
53% 47% 51%
24%
79%60% 59%
Desirability of Using Crumb Rubber as an Additive in Asphalt – rating: 1 to 5
5 - Very De-sirable
4
3
2
1 - Not at All Desirable
68

2009 Tire Maintenance Study
OPINIONS ON TIRE RECYCLING
CANADA Vancouver Calgary Winnipeg Toronto Sherbrooke Fredericton
4%2% 3% 3%
11% 5%3% 3% 4% 4%
2%2%
1%
12% 13%20% 22% 6%
8%5%
34% 39%40%
46%
11%37%
30%
47% 42%32% 25%
70%
48%64%
Desirability of Using Tire Shred Material as Light Weight Fill in Civil Engineering Projects
– rating: 1 to 5
5 - Very De-sirable
4
3
2
1 - Not at All Desirable
69
2009 Tire Maintenance Study
OPINIONS ON TIRE RECYCLING
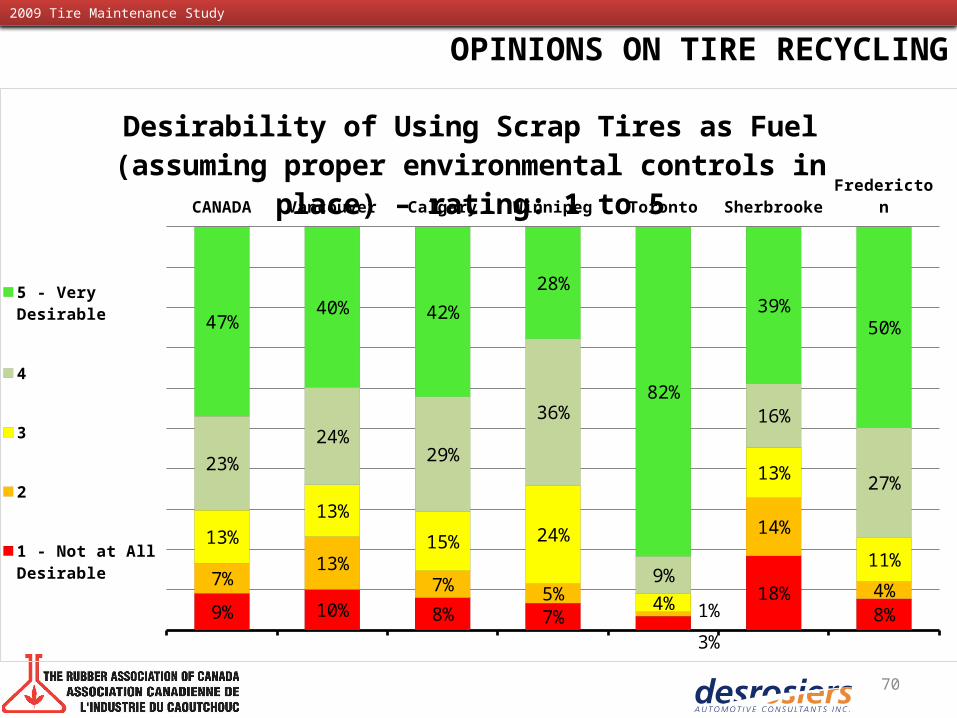
CANADA Vancouver Calgary Winnipeg Toronto Sherbrooke Fredericton
9% 10% 8% 7%3%
18%8%
7% 13%7% 5%
1%
14%
4%
13%13%
15% 24%
4%
13%
11%
23%24%
29%
36%
9%
16%
27%
47% 40% 42%28%
82%
39%50%
Desirability of Using Scrap Tires as Fuel (assuming proper environmental controls in
place) – rating: 1 to 5
5 - Very De-sirable
4
3
2
1 - Not at All Desirable
70