Embed Size (px)
Citation preview

© 2016 Electric Power Research Institute, Inc. All rights reserved.
Nadav EnbarPrincipal Project Manager
PV Life Cycle & Reliability Workshop
PV Systems SymposiumMay 11, 2016
PV O&M Budgeting: Pricing and Practices

2© 2016 Electric Power Research Institute, Inc. All rights reserved.
Presentation insights derived from PV O&M white paper
Research rationale: Little information exists regarding the budgeting process, actual metrics ($/kW-yr), consensus best practices, and industry gaps.
Joint effort by EPRI and Sandia National Labs Focus: Utility-scale solar PV Data/insights derived from:
– In-depth interviews– Online survey
The publicly-available paper is available for download at: http://www.epri.com/abstracts/Pages/ProductAbstract.aspx?ProductId=000000003002006218

3© 2016 Electric Power Research Institute, Inc. All rights reserved.
New PV deployments: now more about economics than mandate?
Greater levels of utility-scale PV procurement based on economics– 8.7 GW to meet states’
RPS mandates / goals*– 7.9 GW beyond RPS*
Install costs improving– 1-10 MW: $1.75-$2.50/W– 10 MW+: $1.40-$1.75/W
Source: GTM Research, Q4 2015 Solar Executive Briefing
Source: GTM Research. U.S. Utility PV Market Tracker.* Values based on procurement pipeline in Sep. 2015
U.S. PV Installed PV Capacity by Market Segment – Post ITC Extension, 2010-20E

4© 2016 Electric Power Research Institute, Inc. All rights reserved.
To lower PV LCOE: OpEx increasingly important as CapEx reduces
CapEx reductions driven by learning curve, innovation, scale economiesOpEx becoming increasingly important to project margins
– Asset Management, O&M, Repower/Decommission
Source: BNEF, “PV OM Index 2015” Sep. 2015. Note: Assumes an initial O&M cost of $30,000/MW‐yr, lifetime of 20 years, CapEx of $1.39.W, 0.7% annual degradation, 2% inflation rate, 21% tax rate, Electricity sold at $110/MWh, initial equity IRR 6.0%
Relative change in rate of return on a 1 MW PV plant
Soft costsLabor
Hard BOSInverter
Module
Source: GTM Research, “Executive Briefing, The Future of U.S. Solar” Nov. 2015
CapEx prices (USD) for utility-scale PV
2.00
1.50
1.00
0.50
0.002012 2013 2014 2015E 2016E
10% decrease
10% increase
Capacity Factor (%) -52% +45%Equipment Cost ($/MW) +18% -18%
Fixed O&M ($/MW) +11% -12%Development cost ($/MW) +11% -10%
Construction debt (%) -8% +11%

5© 2016 Electric Power Research Institute, Inc. All rights reserved.
Unresolved question: What is the cost-benefit of PV O&M?
80% of worldwide utility-scale plants built in last 5 years– Time needed to correlate O&M to
benefit Inadequate budget transparency
– Differing stakeholder motivations / incentives
Many variables impact O&M approach– Size / location water availability, travel distance,
geography– Climate mowing, soiling, wildlife, corrosion
– Plant technology / architecture tracking vs. fixed-tilt, panel and
inverter types
Source: GTM Research and SolChamba Consulting, “Megawatt‐scale PV O&M and Asset Management 2015‐2020: Services, Markets and Competitors,” Nov. 2015.

6© 2016 Electric Power Research Institute, Inc. All rights reserved.
Companies & their roles in the PV O&M space
The structural manner in which PV plants are developed, owned, and operated is a primary explanation for the observed variation in PV O&M approaches and investments.

7© 2016 Electric Power Research Institute, Inc. All rights reserved.
The overarching O&M budgeting landscape
Budgets historically low (and remain so) No one-size-fits-all approach
– Budgets typically 1-5% of MW-scale plant’s $/kW-yr price tag
– Variation based on System / fleet characteristics Business interests O&M approaches (scope) Contractual arrangements Miscellaneous: labor rates,
local energy prices, project volume, profit taking
– Broad structure guides budgeting process that is informed by multiple factors/attitudes
Source: EPRI, PID 3002005779
Note: O&M estimates developed using bottoms‐up approach; incorporates detailed info from EPCs, and input from industry data (i.e. equipment cost and labor indices), market analyst info, and developer feedback. Estimates for conceptual 10‐MWdc plants.
Avg. Utility-Scale PV O&M Costs, by Technology

8© 2016 Electric Power Research Institute, Inc. All rights reserved.
Key factors that frame O&M budgeting approachEmployed O&M strategy
Preventative Maintenance (PM) Reactive Maintenance Condition-based Maintenance (CBM) Reliability-Centered Maintenance (RCM) Reliability Availability and Maintainability (RAM)
9© 2016 Electric Power Research Institute, Inc. All rights reserved.
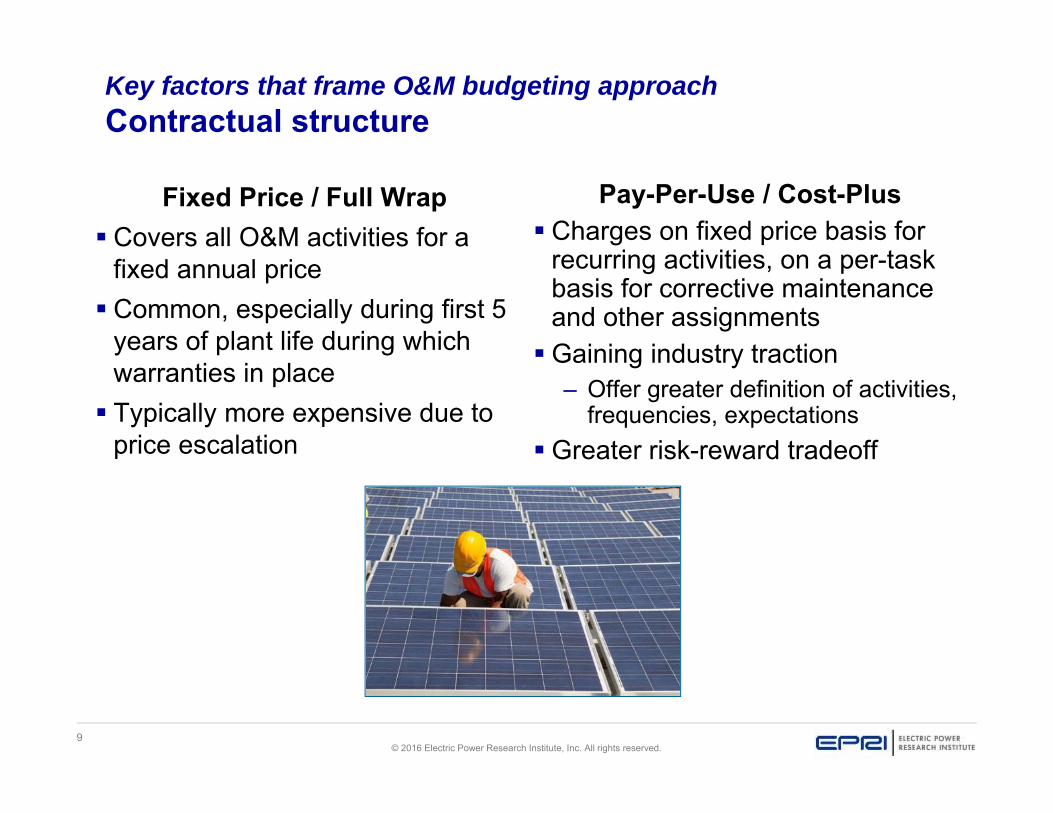
Key factors that frame O&M budgeting approachContractual structure
Fixed Price / Full Wrap Covers all O&M activities for a
fixed annual price Common, especially during first 5
years of plant life during which warranties in place Typically more expensive due to
price escalation
Pay-Per-Use / Cost-Plus Charges on fixed price basis for
recurring activities, on a per-task basis for corrective maintenance and other assignmentsGaining industry traction
– Offer greater definition of activities, frequencies, expectations
Greater risk-reward tradeoff

10© 2016 Electric Power Research Institute, Inc. All rights reserved.
Key factors that frame O&M budgeting approachContractual provisos
Service-level agreements: specify compliance timeframes– Compliance variable based on equipment type, severity, “clock
start/stop”Availability guarantees: define plant uptime requirements
– No standard calculation used for determining availabilityPerformance ratio/yield guarantees: stipulate plant performance
levels– dc:ac overbuild can undermine the provision’s intent
Production guarantees: state annual plant production levelsPerformance incentives: reward/penalize for plant performance
– Can be undermined by environmental factorsEnergy-based contracts: Link plant production with O&M service
provider revenues

11© 2016 Electric Power Research Institute, Inc. All rights reserved.
Key factors that frame O&M budgeting approachBudget development terms
Stated plant owner terms– Organization / design of project bidding and RFP process
EPC / O&M provider negotiationsTurnkey vs. disaggregated development and upkeepUtility vs. non-utility development

12© 2016 Electric Power Research Institute, Inc. All rights reserved.
PV O&M budget components and costs
Caveats $/kW-yr metric can skew
perspectives– Other metrics can be more
instructive Normalizing O&M budget
figures for comparison can be difficult The constituent parts of
O&M budget don’t always add up to overall average budget $/kW-yr O&M costs tend to
decrease as system size increases– Returns diminish as plant
size grows– O&M of smaller systems
can be 2-4x more expensive than for larger sites
Budget Item Budget Range ($/kW-yr)
Overall Budget $10.00 - $45.00/kW-yr*
General Site Maintenance $0.20 - $3.00/kW-yr
Wiring Electrical Inspection $1.40 - $5.00/kW-yr†
Panel Washing $0.80 - $1.30/kW-yr†
Vegetation Management $0.50 - $1.80/kW-yr†
Inverter Maintenance $3.00 - $7.50/kW-yr†
Inverter Replacement $6.00 - $10.00/kW**
Racking / Tracker Maintenance Insufficient data
Spares $2.00 - $20.00/kW-yr***Source: EPRI
Notes: Budget numbers for utility‐scale plants; encompass an entire range of baseline, cost‐plus, and warranty terms.* Constituent O&M budget components are non‐linear; will not necessarily add up to overall budget on a $/kW‐yr basis.** Inverter replacement metrics based on a $/kW, cover one‐time equipment replacement and installation activity over the course of a plant’s lifetime.*** Budget range for spares primarily encompasses equipment procurement and storage costs.† Price points based on a 1x annual frequency (i.e., per event)
13© 2016 Electric Power Research Institute, Inc. All rights reserved.
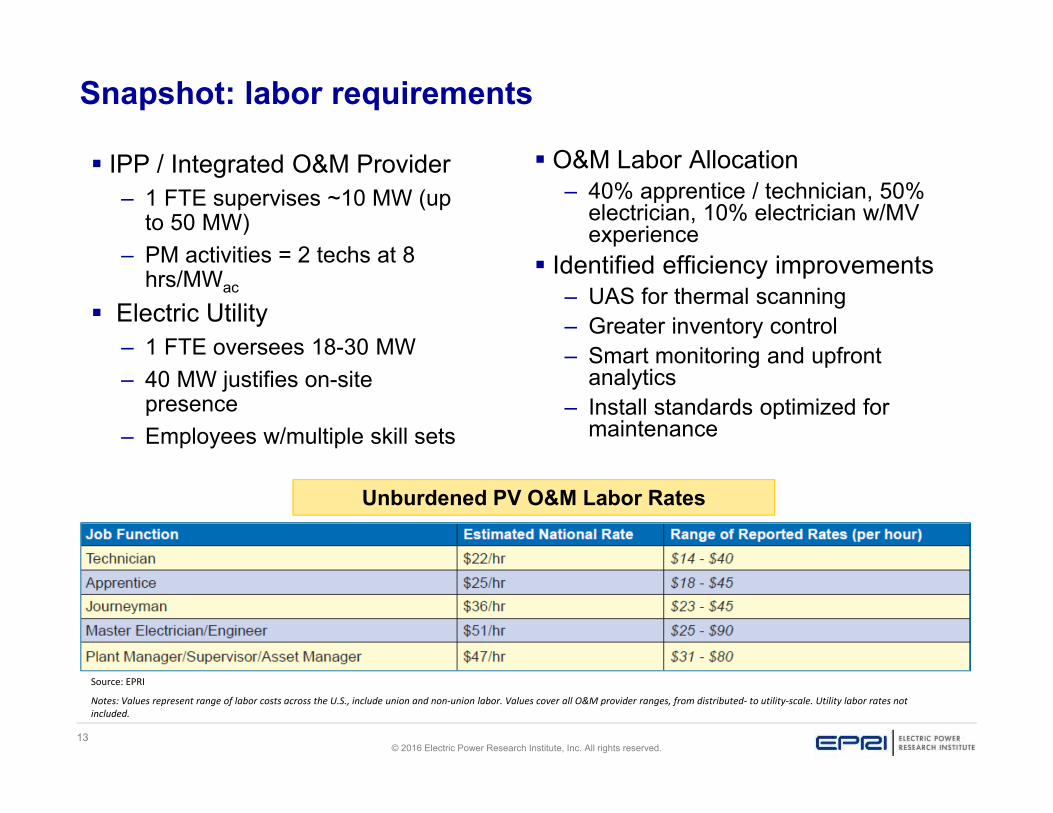
Snapshot: labor requirements
IPP / Integrated O&M Provider– 1 FTE supervises ~10 MW (up
to 50 MW)– PM activities = 2 techs at 8
hrs/MWac
Electric Utility– 1 FTE oversees 18-30 MW– 40 MW justifies on-site
presence– Employees w/multiple skill sets
Unburdened PV O&M Labor Rates
Source: EPRI
Notes: Values represent range of labor costs across the U.S., include union and non‐union labor. Values cover all O&M provider ranges, from distributed‐ to utility‐scale. Utility labor rates not included.
O&M Labor Allocation– 40% apprentice / technician, 50%
electrician, 10% electrician w/MV experience
Identified efficiency improvements– UAS for thermal scanning– Greater inventory control– Smart monitoring and upfront
analytics– Install standards optimized for
maintenance

14© 2016 Electric Power Research Institute, Inc. All rights reserved.
Snapshot: insurance coverage
Rules of Thumb– O&M providers: 5-7% of their revenue to general insurance– Budget $0.10 for ever $100 of insurable value for the components in a PV system– All-risk product = $3,000-$5,000/MW-yr
Conventional insurance categories– General Liability– Property Risk– Environmental Risk– Business Interruption– Contractor Bonding and Risk Management– Underperformance
Emerging Insurance Products– PV Plant Performance Coverage– Cyber Security and SCADA Insurance– Coverage of additional Contract Claims– Forced Outage Insurance

15© 2016 Electric Power Research Institute, Inc. All rights reserved.
Conclusions: re-imagining the O&M budget process
Instill greater O&M budget transparency
Align incentives along value chain
Evaluate / refine budgeting during initial years
Require O&M review in IE reports commissioned by lenders
Incorporate new approaches for determining service requirements to maintain component warranties
Develop better link between maintenance frequency vs. energy output– PV can benefit from development
of Preventative Maintenance Basis Database
Use innovation & big data to reduce cost
Consider decommissioning activities
Standardize budgeting and tasks

16© 2016 Electric Power Research Institute, Inc. All rights reserved.
There is ample room for PV O&M improvement
Improving the link: Maintenance frequency vs. energy output– PV Preventative Maintenance Basis Database– Field research
Increasing O&M budget transparency– New DOE-funded PV O&M Working Group
Misaligned incentives along value chain– PV standards development
Use of innovation & big data to reduce cost
Inadequate attention to plant life cycle considerations
Sources: FLIR Systems, Oregon Infrared LLC, Thermographic Consultancy (clockwise)

17© 2016 Electric Power Research Institute, Inc. All rights reserved.
Questions?
Nadav EnbarPrincipal Project Manager, [email protected]
Geoffrey KliseTechnical Staff, Sandia National Laboratories [email protected]

18© 2016 Electric Power Research Institute, Inc. All rights reserved.
Together…Shaping the Future of Electricity


![Modeling High-Penetration PV for Distribution ......penetration PV at the distribution level (e.g, hosting capacity determinations) [1,2,3]. Likewise, EPRI has also, over the past](https://img.dokumen.tips/doc/110x75/5ebb8c6543b978030f22c9e2/modeling-high-penetration-pv-for-distribution-penetration-pv-at-the-distribution.jpg)