Embed Size (px)
Citation preview

University of Iowa Women’s Basketball Program
Team and Player Analysis
Created by: Justin Ullestad (954)-295-5353
[email protected] www.justinullestad.com
s

OVERVIEW
This document will focus on the team’s performance during the 2015-16 season as well as over the past five seasons (2011-2016). In addition, this document analyzes player performance and progression for athletes currently listed as part of the University of Iowa Women’s Basketball team that logged significant minutes during the 2015-16 season. Using statistical comparisons and advanced metrics, this data can be used to evaluate the team’s overall performance on the court as compared to other programs and student athletes currently playing Division I basketball.
The chart below illustrates some of the significant statistics regarding the performance of the program over the past ten seasons.
Ten-Year Averages as Compared to All Big Ten Teams
W/YR
• IOWA-10.4ConferenceWins/YR(5thBest)• BigTenAverage-9.27Wins
Win%• IOWA-60.8%ConferenceWin%(5thbest)• BigTenAverage-50.7%
PPG• IOWA-71PPG(2ndbest)• BigTenAverage-68.7PPG
PA/G• IOWA-66.47PA/G(14thBest)• BigTenAverage-63.28PA/G
*All the statistics and information presented in this document were sourced from either the main NCAA website or Hawkeyesports.com, and then generated through manually entered equations and algorithms.

2015-16SEASONCategory Actual Rank (of 344) Div. 1 Leader Actual Scoring Offense 73.2 36 UConn 88.1 Scoring Defense 71.3 302 UConn 48.3 Scoring Margin 1.9 151 UConn 39.7 FG Percentage 45.3 22 UConn 53 FG Percentage Defense 42.1 287 Oregon St. 32.4 FT Percentage 73 65 UConn 80 Rebound Margin 1.1 133 Maryland 15.1 3PT FG Per Game 6.1 117 Sacramento St. 12.5 3PT FG Percentage 32.9 90 Oregon 42.1 Won-Lost Percentage 57.6 136 UConn 100 Assists Per Game 16 24 UConn 21.6 Blocks Per Game 4.7 48 West Virginia 6.5 Steals Per Game 6.1 305 Sacramento St. 14.9 Turnovers Per Game 16 179 Villanova 7.9 Fouls Per Game 15.9 82 UConn 11.1 Assist Turnover Ratio 1 59 UConn 1.82 Turnover Margin -2.52 282 Syracuse 10.08 3Pt FG Defense 33.3 282 Georgia 24.3 3PT FGs Attempted 608 105 Sacramento St. 1318 Fewest Turnovers 527 228 Villanova 252 Fewest Fouls 526 114 Penn 343 Free Throw Attempts 619 67 South Carolina 834 Free Throws Made 452 46 St. Mary's (CA) 559 Turnovers Forced 13.45 305 Sacramento St. 24.16 3PT FGs Made 200 99 Sacramento St. 386 Assists 529 26 UConn 821 Blocked Shots 154 41 UConn 241 Rebounds 1254 101 Baylor 1730 Rebounds Per Game 38 161 GW 48.64 Steals 200 266 Syracuse 477

Big Ten Conference Team Rankings Total Stats (2015-16 season)
PTS: 7th FGM: 7th FGA: 7th FG%: 5thAST: 1st 3PA: 7th 3PA: 7th 3P%: 9thTRB: 7th ORB: 8th TOV: 11th FT%: 7th

Big Ten Conference Team Rankings Total Stats Against (2015-16 season)
PTS: 10th FGM: 10th FGA: 10th FG%: 10thAST: 9th 3PA: 6th 3PA: 6th 3P%: 9thTRB: 9th ORB: 11th TOV: 12th FTA: 6th

Big Ten Conference Team Rankings Per Game Averages (2015-16 season)
PTS: 7th FGM: 8th 3PA: 5th FTA: 4thAST: 5th TRB: 6th BLK: 5th STL: 12th

Big Ten Conference Team Rankings Per Game Averages Against (2015-16 season)
PTS: 9th FGA: 12th FGM: 12th FTA: 6thAST: 9th TRB: 6th 3PA: 4th 3PM: 8th

Big Ten Conference Team Rankings Advanced Stats (2015-16 season)
Poss: 7th ScoringPoss: 7th ScoringPoss%: 6th OE: 7theFG%: 4th TS%: 4th TotalS%: 8th ORB%: 6th

Team Performance (2011-2016) A graphic comparison to Division I and Conference averages over past five seasons

Team Performance (2011-2016)

Team Performance (2011-2016)

Team Performance (2013-2016) A graphic comparison to Division I and Conference per game averages over past three seasons

Team Performance (2013-2016)

Team Performance (2013-2016)

Returning Players for the 2016-17 Season
Christina Buttenham Chase Coley Tania Davis
Ally Disterhoff Megan Gustafson Alexa Kastanek
Carly Mohns

Christina Buttenham Class: Junior Position: Forward Height: 6-0 Notes: 2016 Academic All-Big Ten
Valuation Stats: ORtg = 93.06 Team Rank: 7th Big Ten Rank: 70 FIC = 82.25 Team Rank: 5th Big Ten Rank: 64 TS% = 48.25% Team Rank: 7th Big Ten Rank: 69
*Rankingsincludeallreturningplayersw/100minutesplayed
EOP Visualization for 2015-16 Season
Proportional to the total production in each stat for the individual
OE
FG%
Pts Ast
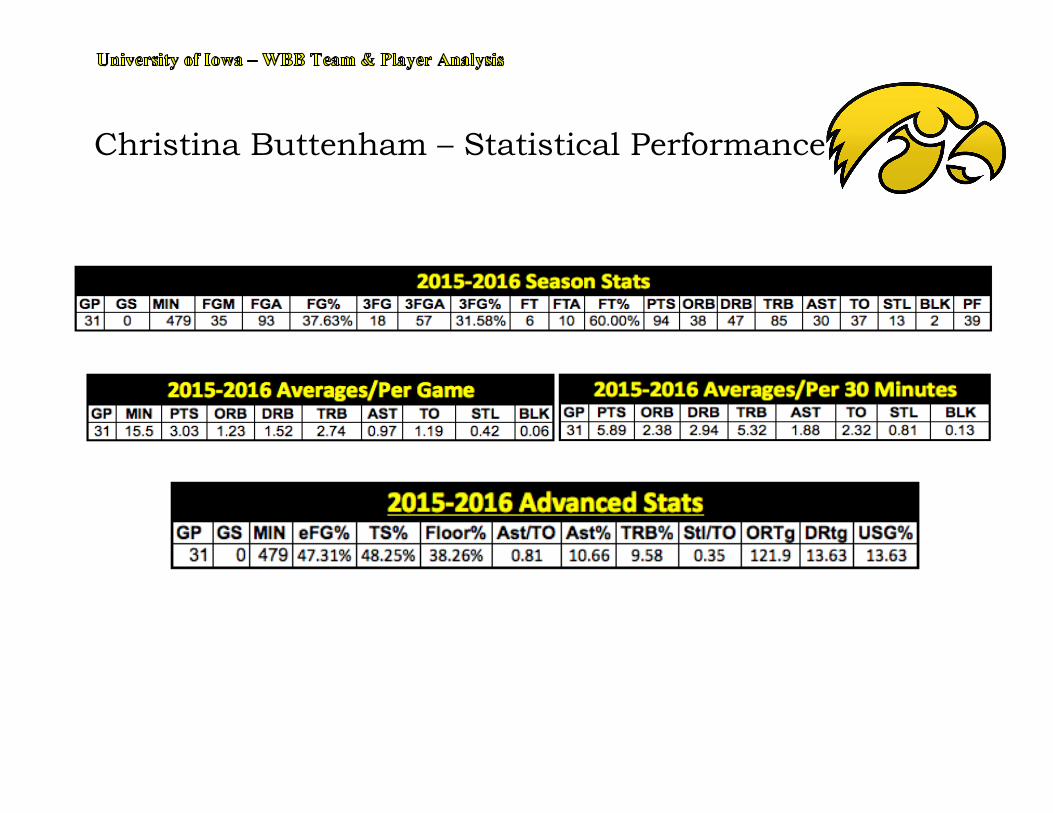
Christina Buttenham – Statistical Performance

Chase Coley Class: Junior Position: Forward Height: 6-3 Notes:
• Most Improved Player award for team last season
• Recorded six double-doubles last season
Valuation Stats: ORtg = 114.70 Team Rank: 2nd National Rank: 18 FIC = 296.75 Team Rank: 3rd Big Ten Rank: 19 TS% = 56.4% Team Rank: 3rd Big Ten Rank: 25
* Rankings include all returning players w/ 100 minutes played
OE
FG%
Pts Ast
EOP Visualization for 2015-16 Season
Proportional to the total production in each stat for the individual

Chase Coley – Statistical Performance

Tania Davis Class: Sophomore Position: Guard Height: 5-4 Notes:
• 2016 Big-Ten All-Freshman Team
• Led team in assists last season (Second highest assist total for a freshman in program history)
Valuation Stats: ORtg = 100.44 Team Rank: 5th National Rank: 47 FIC = 193.38 Team Rank: 4th Big Ten Rank: 39 TS% = 49.77% Team Rank: 6th Big Ten Rank: 60
*Rankingsincludeallreturningplayersw/100minutesplayed
EOP Visualization for 2015-16 Season
Proportional to the total production in each stat for the individual
OE
FG%
Pts Ast

Tania Davis – Statistical Performance

Ally Disterhoft Class: Senior Position: Guard Height: 6-0 Notes:
• 2016 Second Team All-Big Ten • 2016 Academic All-Big Ten • 2015 Second Team All-Big Ten • 2015 Academic All-Big Ten • 2014 Big Ten All-Freshman
Team • 2014 Big Ten All-Tournament Team
Valuation Stats: ORtg = 122.94 Team Rank: 1st Big Ten Rank: 5th FIC = 411.00 Team Rank: 1st Big Ten Rank: 7th TS% = 63.42% Team Rank: 1st Big Ten Rank: 6th
*Rankingsincludeallreturningplayersw/100minutesplayed
EOP Visualization for 2015-16 Season
Proportional to the total production in each stat for the individual
OE
FG%
Pts Ast

Ally Disterhoft – Statistical Performance

Megan Gustafson Class: Sophomore Position: Center Height: 6-3 Notes:
• 2016 All-Big Ten Freshman • 2016 Big Ten Freshman of the
Week (Feb 22.) • Led team in FG%, RPG, and
BPG last season
Valuation Stats: ORtg = 112.41 Team Rank: 3rd Big Ten Rank: 22 FIC = 311.00 Team Rank: 2nd Big Ten Rank: 15 TS% = 57.56% Team Rank: 2nd Big Ten Rank: 21
*Rankingsincludeallreturningplayersw/100minutesplayed
EOP Visualization for 2015-16 Season
Proportional to the total production in each stat for the individual
OE
FG%
Pts Ast

Megan Gustafson – Statistical Performance

Alexa Kastanek Class: Senior Position: Guard Height: 5-10 Notes:
• 2016 Academic All-Big Ten • 2015 Academic All-Big Ten • Led team in made 3-Point FGs
last season (56)
Valuation Stats: ORtg = 98.41 Team Rank: 6th Big Ten Rank: 54 FIC = 133.13 Team Rank: 5th Big Ten Rank: 44 TS% = 55.56% Team Rank: 4th Big Ten Rank: 27
*Rankingsincludeallreturningplayersw/100minutesplayed
EOP Visualization for 2015-16 Season
Proportional to the total production in each stat for the individual
OE
FG%
Pts Ast

Alexa Kastanek – Statistical Performance

Carly Mohns Class: Junior Position: Forward Height: 6-1 Notes:
• Played in nine games during the 2015-16 season before an injury caused her to miss the remainder of the season
Valuation Stats: ORtg = 110.98 Team Rank: 4th Big Ten Rank: 24 FIC = 34.63 Team Rank: 7th Big Ten Rank: 80 TS% = 56.40 Team Rank: 5th Big Ten Rank: 29
*Rankingsincludeallreturningplayersw/100minutesplayed
EOP Visualization for 2015-16 Season
Proportional to the total production in each stat for the individual
OE
FG%
Pts Ast

Carly Mohns – Statistical Performance

Abbreviations: +/-: Plus/Minus rating
2P: 2-Point Field Goals
2P%: 2-Point Field Goal Percentage; the formula is 2P / 2PA.
2PA: 2-Point Field Goal Attempts
2PM: 2-Point Field Goals Made
3P: 3-Point Field Goals
3P%: 3-Point Field Goal Percentage.
3PA: 3-Point Field Goal Attempts
3PM: 3-Point Field Goals Made
APG: Assists Per Game
AST: Assists
AST: The percentage of possessions that end in an assist AST%: Assist percentage is an estimate of the percentage of teammate field goals a player assisted while he was on the floor.
AST/TO: Assist to Turnover Ratio
BLK: Blocks
BLK%: Block percentage is an estimate of the percentage of opponent two-point field goal attempts blocked by the player while he was on the floor.
BPG: Blocks Per Game
DRB: Defensive Rebounds
DRB%: Defensive rebound percentage is an estimate of the percentage of available defensive rebounds a player grabbed while he was on the floor.
DRtg: Defensive Rating; for players and teams it is points allowed per 100 possessions.
DWS: Defensive Win Shares
eDiff: Efficiency Differential

eFG%: Effective Field Goal Percentage. This statistic adjusts for the fact that a 3-point field goal is worth one more point than a 2-point field goal.
EOP: Efficient Offensive Production
FG: Field Goals (includes both 2-point field goals and 3-point field goals)
FG%: Field Goal Percentage
FGA: Field Goal Attempts (includes both 2-point field goal attempts and 3-point field goal attempts)
FGM: Field Goals Made (includes both 2-point field goal makes and 3-point field goal makes)
FIC: Floor Impact Counter. FIC is formula to encompass all aspects of the box score into a single statistic. The intent of the statistic is similar to other efficiency stats, but assists, shot creation and offensive rebounding are given greater importance. FIC40: The FIC total presented on a per-40 minute basis. FT: Free Throws
FT/FGA: Free Throw Factor. It is a measure of both how often a team gets to the line and how often they make them FT%: Free Throw Percentage
FTA: Free Throw Attempts
FTA: Free Throws Made
GP: Games Played
GS: Games Started
HOB: Number of buckets a player is directly involved in whether as the scorer or passer MP: Minutes Played
NetRtg: A pace controlled statistic that measures point differential (+/-) per 100 possessions. OE: Offensive Efficiency
ORtg: Offensive Rating: for players it is points produced per 100 possessions, while for teams it is points scored per 100 possessions.

Opp: Opponent
ORB: Offensive Rebounds
ORB%: Offensive rebound percentage is an estimate of the percentage of available offensive rebounds a player grabbed while he was on the floor.
OWS: Offensive Win Shares
Pace: Pace factor is an estimate of the number of possessions per 48 minutes by a team.
PER: Player Efficiency.
Per 36 Minutes: A statistic (e.g., assists) divided by minutes played, multiplied by 36.
Per Game: A statistic (e.g., assists) divided by games.
PF: Personal Fouls
Poss: Possessions; this stat estimates possessions based on both the team's statistics and their opponent's statistics, then averages them to provide a more stable estimate.
PProd: Points Produced
PPG: Points Per Game
PPS: Points Per Shot
PTS: Points
REB: Rebounds
RPG: Rebounds Per Game
SPG: Steals Per Game
STL: Steals
STL%: Steal Percentage is an estimate of the percentage of opponent possessions that end with a steal by the player while he was on the floor.
STL/TO: Steals to Turnover Ratio
TotalS%: Total shooting percentage is a measure of shooting efficiency that combines field goal, 3-point field goal, and free throw percentages.
TOV: Turnovers
TOV%: Turnover percentage is an estimate of turnovers per 100 plays.

TRB: Total Rebounds
TRB%: Total rebound percentage is an estimate of the percentage of available rebounds a player grabbed while he was on the floor.
TS%: True shooting percentage is a measure of shooting efficiency that takes into account field goals, 3-point field goals, and free throws.
TSA: True Shooting Attempts;
Usg%: Usage percentage is an estimate of the percentage of team plays used by a player while he was on the floor.
• %FGM: The percentage of a team’s field goals made that a player has while on the court
• %FGA: The percentage of a team’s field goals attempted that a player has while on the court
• %3FGM The percentage of a team’s three point field goals made that a player has while on the court
• %3FGA: The percentage of a team’s three point field goals attempted that a player has while on the court
• %FTM: The percentage of a team’s free throws made that a player has while on the court
• %FTA: The percentage of a team’s free throws attempted that a player has while on the court
• %OREB: The percentage of a team’s offensive rebounds that a player has while on the court
• %DREB: The percentage of a team’s defensive rebounds that a player has while on the court
• %REB: The percentage of a team’s total rebounds that a player has while on the court
• %AST: The percentage of a team’s assists that a player has while on the court
• %TO: The percentage of a team’s turnovers that a player has while on the court
• %STL: The percentage of a team’s steals that a player has while on the court
• %BLK: The percentage of a team’s blocks that a player has while on the court
• %BLKA: The percentage of a teams’ own block field goal attempts that a player has while on the court

• %PF: The percentage of a team’s personal fouls that a player has while on the
court
• %PFD: The percentage of a team’s personal fouls drawn that a player has while on the court
• %PTS: The percentage of a team’s points that a player has while on the court
W: Wins
Win%: Win Percentage
WS: Win Shares; an estimate of the number of wins contributed by a player.
WS/48: Win Shares Per 48 Minutes; an estimate of the number of wins contributed by the player per 48 minutes (league average is approximately 0.100)