Embed Size (px)
Citation preview

Tuning Java Servers
Srinath Perera

Outline With size of systems growing, Performance
become increasingly critical for both R&D as
well as support o Less performance => more machines => lot of
Devops costs and potential for failures
We will doo Bit of Theory
o Then to Profiling
Will discuss different profiling views, and most
importantly when to use them.

Based on article
http://www.infoq.com/articles/Tuning-Java-Servers

Big Pic
What is Performance Tuning? Get maximum out of the machine
o Max Throughput
o Min Latency
Often this become a tradeoff, so you need a
balance o General case is to get max throughput within given
latency limits. (E.g. max throughput with latency
less than 100ms.)

Lets understand what they are What is throughput?
o Number of messages server can process per second
o Measured as the number of messages processed/ time to process messages
What is latency? o End to end time for a server to process an message
We discuss performance as relationship
between three variables: latency,
concurrency, throughput
What Limits Performance? Lack of resources
Bottleneck – most scarce resource decides the
performance o CPU bound
o Disk bound
o Bandwidth bound
o Latency bound
o Memory bound

Performance and Bottlenecks Think of performance as a water pipe system
Bottle neck decides overall throughput
Latency problems often caused at the same
bottlenecks due to contention
Potential Bottlenecks (Resources)o CPU
o Disk
o Network
o Memory - Available Memory
- Heap Size
- GC (Java) – will eat in CPU

Performance of a Server

Little’s Law
Bound your queue’s (reject too much requests
to give better response time)

Amdhal’s Law

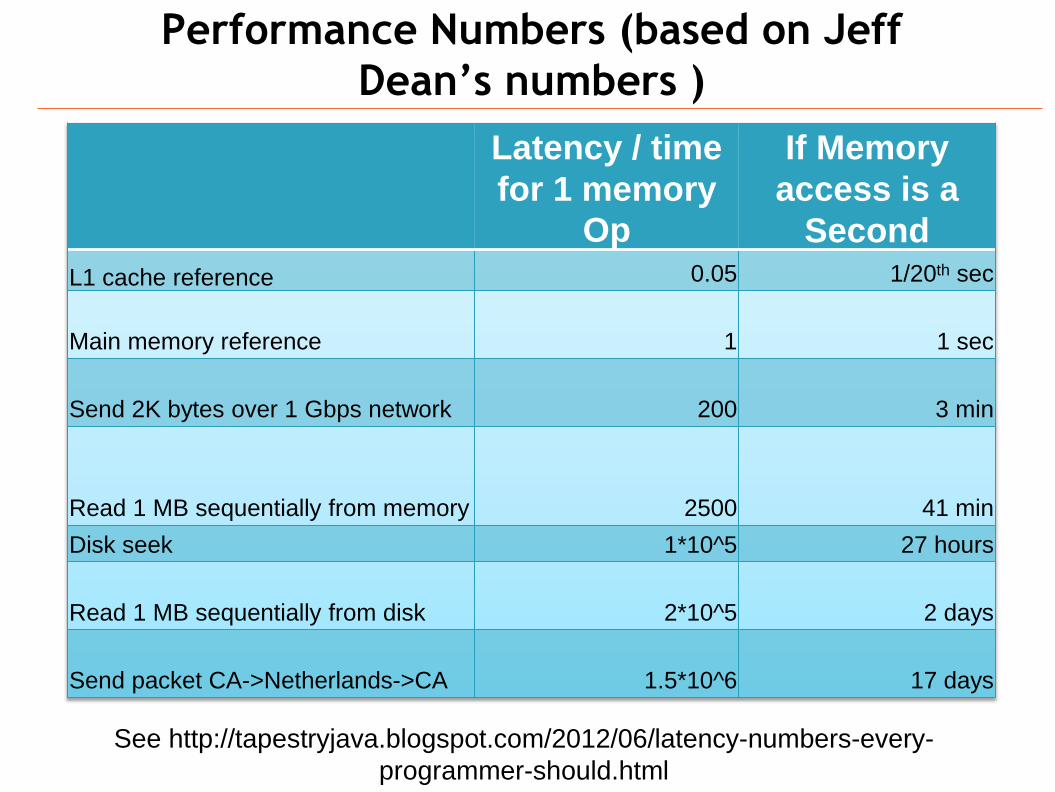
Performance Numbers (based on Jeff
Dean’s numbers )
Latency / time
for 1 memory
Op
If Memory
access is a
Second
L1 cache reference 0.05 1/20th sec
Main memory reference 1 1 sec
Send 2K bytes over 1 Gbps network 200 3 min
Read 1 MB sequentially from memory 2500 41 min
Disk seek 1*10^5 27 hours
Read 1 MB sequentially from disk 2*10^5 2 days
Send packet CA->Netherlands->CA 1.5*10^6 17 days
See http://tapestryjava.blogspot.com/2012/06/latency-numbers-every-
programmer-should.html

Latency Lags Bandwidth
Observation in prof.
Patterson’s Keynote at 2004
Bandwidth improves, but
not latency
Same holds now, and the
gap is widening with new
systems

Handling Speed Differences in
Memory Hierarchy
1. Caching
o E.g. Processor caches, file
cache, disk cache, permission
cache
2. Replication o E.g. RAID, Content Distribution
Networks (CDN), Web Cache
3. Prediction – Predict what data
will be needed and prefect o Tradeoff bandwidth
o E.g. disk caches, Google Earth

Potential Performance Problems Low performance
o Low Throughput
o High latency
Memory leaks
File, Thread, Connection Leaks

Warning Many think performance is due to CPU
People forget network and Disk (most our
workloads are network bound)o That’s why CPU 10% but machine is loaded (load
average 40)
Need to look at all
First step is find the bottleneck

Where to start? Load Average Most start by looking at CPU usage
That does not reflect non-CPU load
Load average is much bettero Represent the size of the process queue
o Can found via top (1m, 5m, 15m)
o Goes high when CPU, network, disk, memory etc.,
are limited
o Normal value = number of cores, 4X number of
cores means high
o 10X core size means machine is unusable
Read
• http://prutser.wordpress.com/2012/04/23/understanding-linux-load-average-
part-1/ also part2 and part 3

Profiling Tools First step is connect through JConsole, and get
basic idea.
Also monitor the load average, CPU usage, and
IO operations (via top or Sar)
Then you can switch to tools like JProfiler,
Yourkit, Java Flight Recorder
Important views o CPU views (bottlenecks)
o Thread views and monitor views
o Memory views (GC, allocations, and memory leaks)
o IO and JDBC tracing

Top

JConsole

Java Flight Recorder Former Oracle Jrocket Mission control
Now included with JDK 7 update 44+
Nice tool, very fast, you could run it in
production
Can start via $JAVA_HOME/bin/jmc
Profiling JVM need to have following java
option at start o -XX:+UnlockCommercialFeatures -XX:+FlightRecorder


Hands On Code and scripts from
https://github.com/srinathperera/JavaProfilingTalk
Run ant to build the service
Download and unzip WSO2 AS. Run wso2server.sh to
start
Go to http:// 127.0.0.1:9443/carbon and login via
admin/ admin
Deploy the aar by going to Services->Add->AAR
Service
Download jmeter, unzip, and run bin/jmeter
Run Jmeter scripts to recreate performance problems

Get started with JProfiler Download install – work with linux, windows,
and Mac
New Session, then configureo Same Machine connect
o Remote connect - Java -
agentpath:/Applications/jprofiler7/bin/macos/libjprofil
erti.jnilib=port=8849 \
o Offline profile
Adjust filters to org.wos2, org.apache,
java.util. and remove excludes (can change
this)
Connect

JProfiler Instrumentation vs. Sampling
Jpenable let you connect to an running server
remotely

Problem 1: Tuning for Throughput Is machine loaded (checked via load average)?
o If you are putting small load, throughout will be
less
Try increasing concurrency (load)
Problem 1: Tuning for.. (Contd) If load average low
o Check lock profile
o Try tuning threads - If server set to small number of threads, that will limit
performance
o Ensure network not saturated - Try transfer a large file

Problem 1: Tuning for.. (Contd) If high load average
o Is machine loaded by something else?
o Check CPU (top)- If high check CPU profile
- If GC percentage > 10% tune GC
o Check network
o Check Disk
o Check is Machine paging

CPU Profile

CPU Profile First check hotspots
Then call tree o show inherent time as oppose to cumulative time
(Call graph)
Make sure what takes CPU is where real work is
done
CPU1 and CPU2 samples

Network/ Disk Profile Enable Socket or Servlet (or Files) via Probes
Hotspots
Read/Write via telematics
Samples tooManyIOPSCall.jmx
tooManyNetowrkCalls.jmx

Lock Profile Threads view (History and telemetric view)
Monitor view
bockedThreadsCall.jmx sample
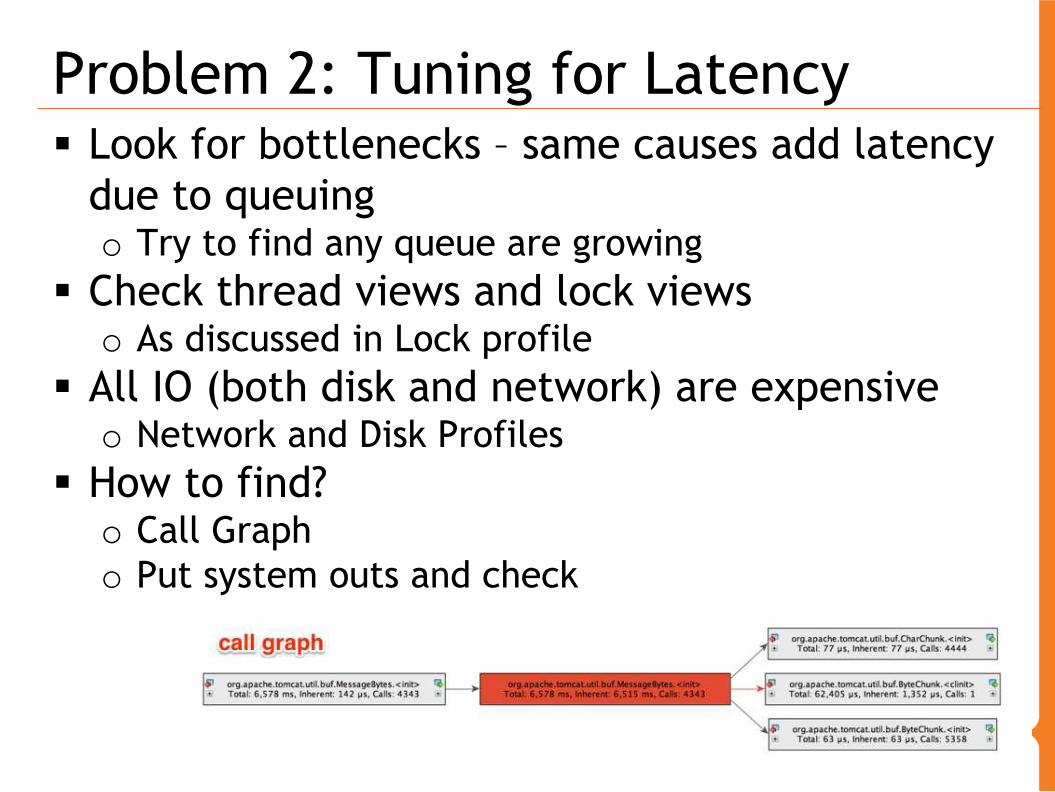
Problem 2: Tuning for Latency Look for bottlenecks – same causes add latency
due to queuing o Try to find any queue are growing
Check thread views and lock views o As discussed in Lock profile
All IO (both disk and network) are expensive o Network and Disk Profiles
How to find?o Call Graph
o Put system outs and check

Problem 3: Finding Memory Leaks Use Eclipse Memory Analyzer
Go to JProfiler if it is hard to pin down
Support mark and monitoring memory in
running system
Can also analyze a memory dump o Select the objects
o Checking incoming references (cumulative)
o Reference Graph can also help

Eclipse Memory Analyzer When OOM, WSO2 servers create a dump
Open with eclipse memory analyzer

Memory leaks with Jprofiler

Allocation view Use to find where objects are created

GC Tuning If time spent on GC > 10%, then should tune GC
“gc overhead limit exceeded” – means > 90%
time spent on GC
GC Tuning If time spent on GC > 10%, then should tune GC
“gc overhead limit exceeded” – means > 90%
time spent on GC
Consider using allocation views to reduce
objects created

Problem 4: Finding Thread Leaks Check the number of threads in thread graph
Check which thread are created
Thread dumps o jstack <pid> >> threaddumps.log
o Jprofiler can get thread dumps as well
Take thread dumps at different times

Thread Views
Problem 3: Connection Leaks Exhausted pools, file descriptor limits
Check at finally points and in catch clauses
Tuning without an GUI Create a JProfile session and configure the triggers.
o Need Periodic triggers Copy local .jprofiler7/config.xml and
JProfiler binaries or agent code to the remote machine
Add following before the java command.o -
agentpath:JPROF_LOCATION/bin/macos/libjprofilerti.jnilib=offline,id=S
ESSION_ID,config=/Users/srinath/.jprofiler7/config.xml
Here replace the configuration file and JProfiler location with
your machine's values. o SESSION_ID is the session ID of the session you created with JProfiler UI.
Here ~./jprofiler7/config.xml file has settings for all sessions creates by
jprofiler, and it will pick up the right value. If you are profiling in a
remote machine copy your local configs to the remote host.
Start and run the program, and it will print the following
JProfiler> Using JVMTI
..
Open the snapshot file and analyze using JProfiler UI.

Tuning OS Level Tuning
o For example,
http://www.lognormal.com/blog/2012/09/27/linu
x-tcpip-tuning/
o Generally available with the product
o It depends on OS etc.
Product Tuning o Thread pools sizes mainly, there may be others
Application Tuning o This is your application, you need to profile
Conclusion Know the goals
Find where the bottleneck using Load average and
other OS tools
Zoom in using profiler
Know profile views and when to use them
Details are important, so is the big picture
Think .. Think ..

References Responding in a Timely Manner,
https://www.youtube.com/watch?v=q_DCipkM
sy0
Tuning Java Servers -
http://www.infoq.com/articles/Tuning-Java-
Servers
Thinking Clearly about Performance,
http://queue.acm.org/detail.cfm?id=1854041#
content-comments

Questions?