Embed Size (px)
Citation preview

The (Ultimate) Guide for Marketplace Analytics bonus: open-source dashboard

Marketplace Dynamics
#1

Marketplace dynamics are the key forces that drive the marketplace. However generic the framework to analyze a
company might be, the answers are very specific: a specific system, addressing a specific need, in a specific time.
Discussion about marketplace dynamics will take most of the time in a first meeting with a VC and it requires a rigorous
preparation from the entrepreneurs.
We won’t take too much time discussing about really important considerations such as the problem the
marketplace is solving, the founders’ stories, what makes their vision unique or the company's DNA, since these discussions
are generic to every startups.

1.1. Environment

Macro-trends & regulation
Questions
– What are the emerging trend influencing the users’ behaviour?
– Are there specificities between countries?
– What is the regulation?
Tips
– Look for beliefs, new behaviours, new technologies and devices, etc.
– Use both quantitative and qualitative perspectives.
– The key is to explain why there is a momentum now and why the solution will be great for the years to come

Consumer psychology & social dynamics
Questions
– What are the underlying needs?
– What is the consumer present customer journey?
– Who influences him into buying?
– Who are the hot kids using the product or alternatives right now?
Tips
– Read this slideshare

Competition & opportunity
Questions
– What is the market size and how could it evolve?
– Who are the companies answering the needs today? How are they operating?
– What is the value chain?
– Are the consumers overserved or underserved?
Tips
– To assess a market size use both a top-> down and a bottom->up estimates
– Don’t forget that a market can expand

Self improvement, network effect &
switching cost
Questions
– Will the product become better with scale?
– What kind of network effects are there?
– Is the demand / offer stuck with the service?
Underlying questions
– Will it work at the beginning, without high liquidity (eg: if not, do not forget to build a single player mode)?
– Has it the potential to become a giant? (not too much local network effects)?
– Are there a lot of direct & indirect network effects that will ensure high barrier to entry?

Seasonality & the right timeframe to
look at
Questions
– Is a user really active when he uses the app every day? Every week? Every month? The answer is not the same when you buy a home and when you rent a home.
– Is there a seasonality in your business?
Benchmarks
– Uber looks at weekly data
– Whatsapp looks at daily data

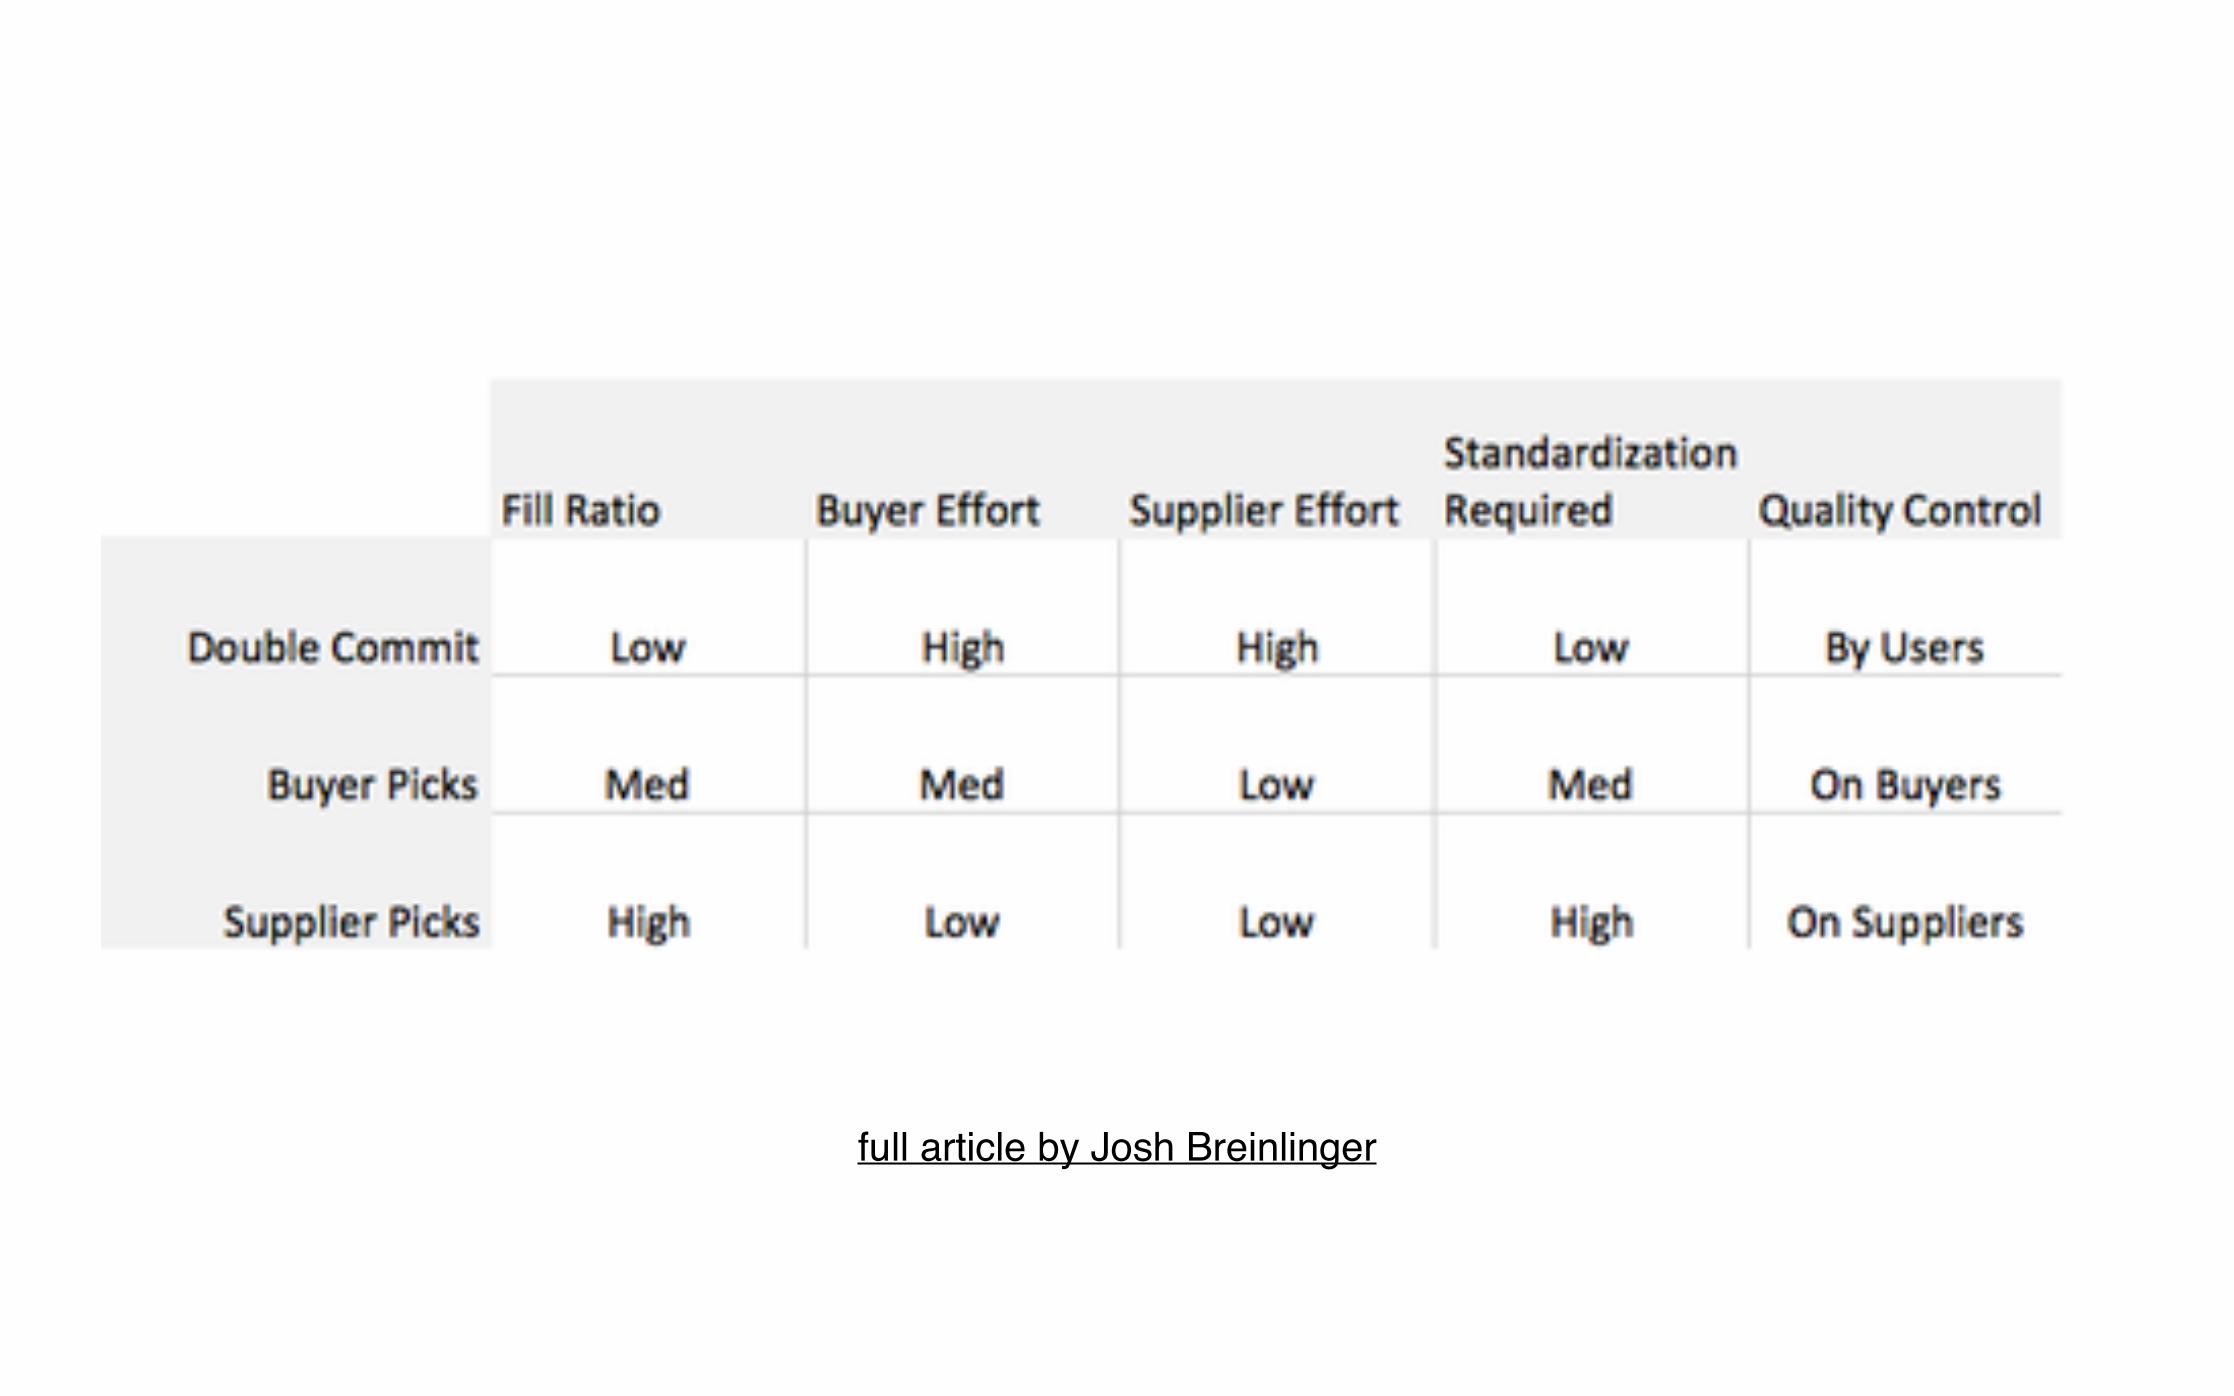
1.2. Three kind of marketplaces

double-commit
full article by Josh Breinlinger
Exemples Upwork, Thumbstack, Airbnb.
Typical workflow
1. Buyer posts job or invites candidates 2. Candidates apply to job 3. Interviews happen4. Buyer makes a hire
Key focus
– improving the fill ratio.
– improving the hiring process (lots of dropoff through the funnel)
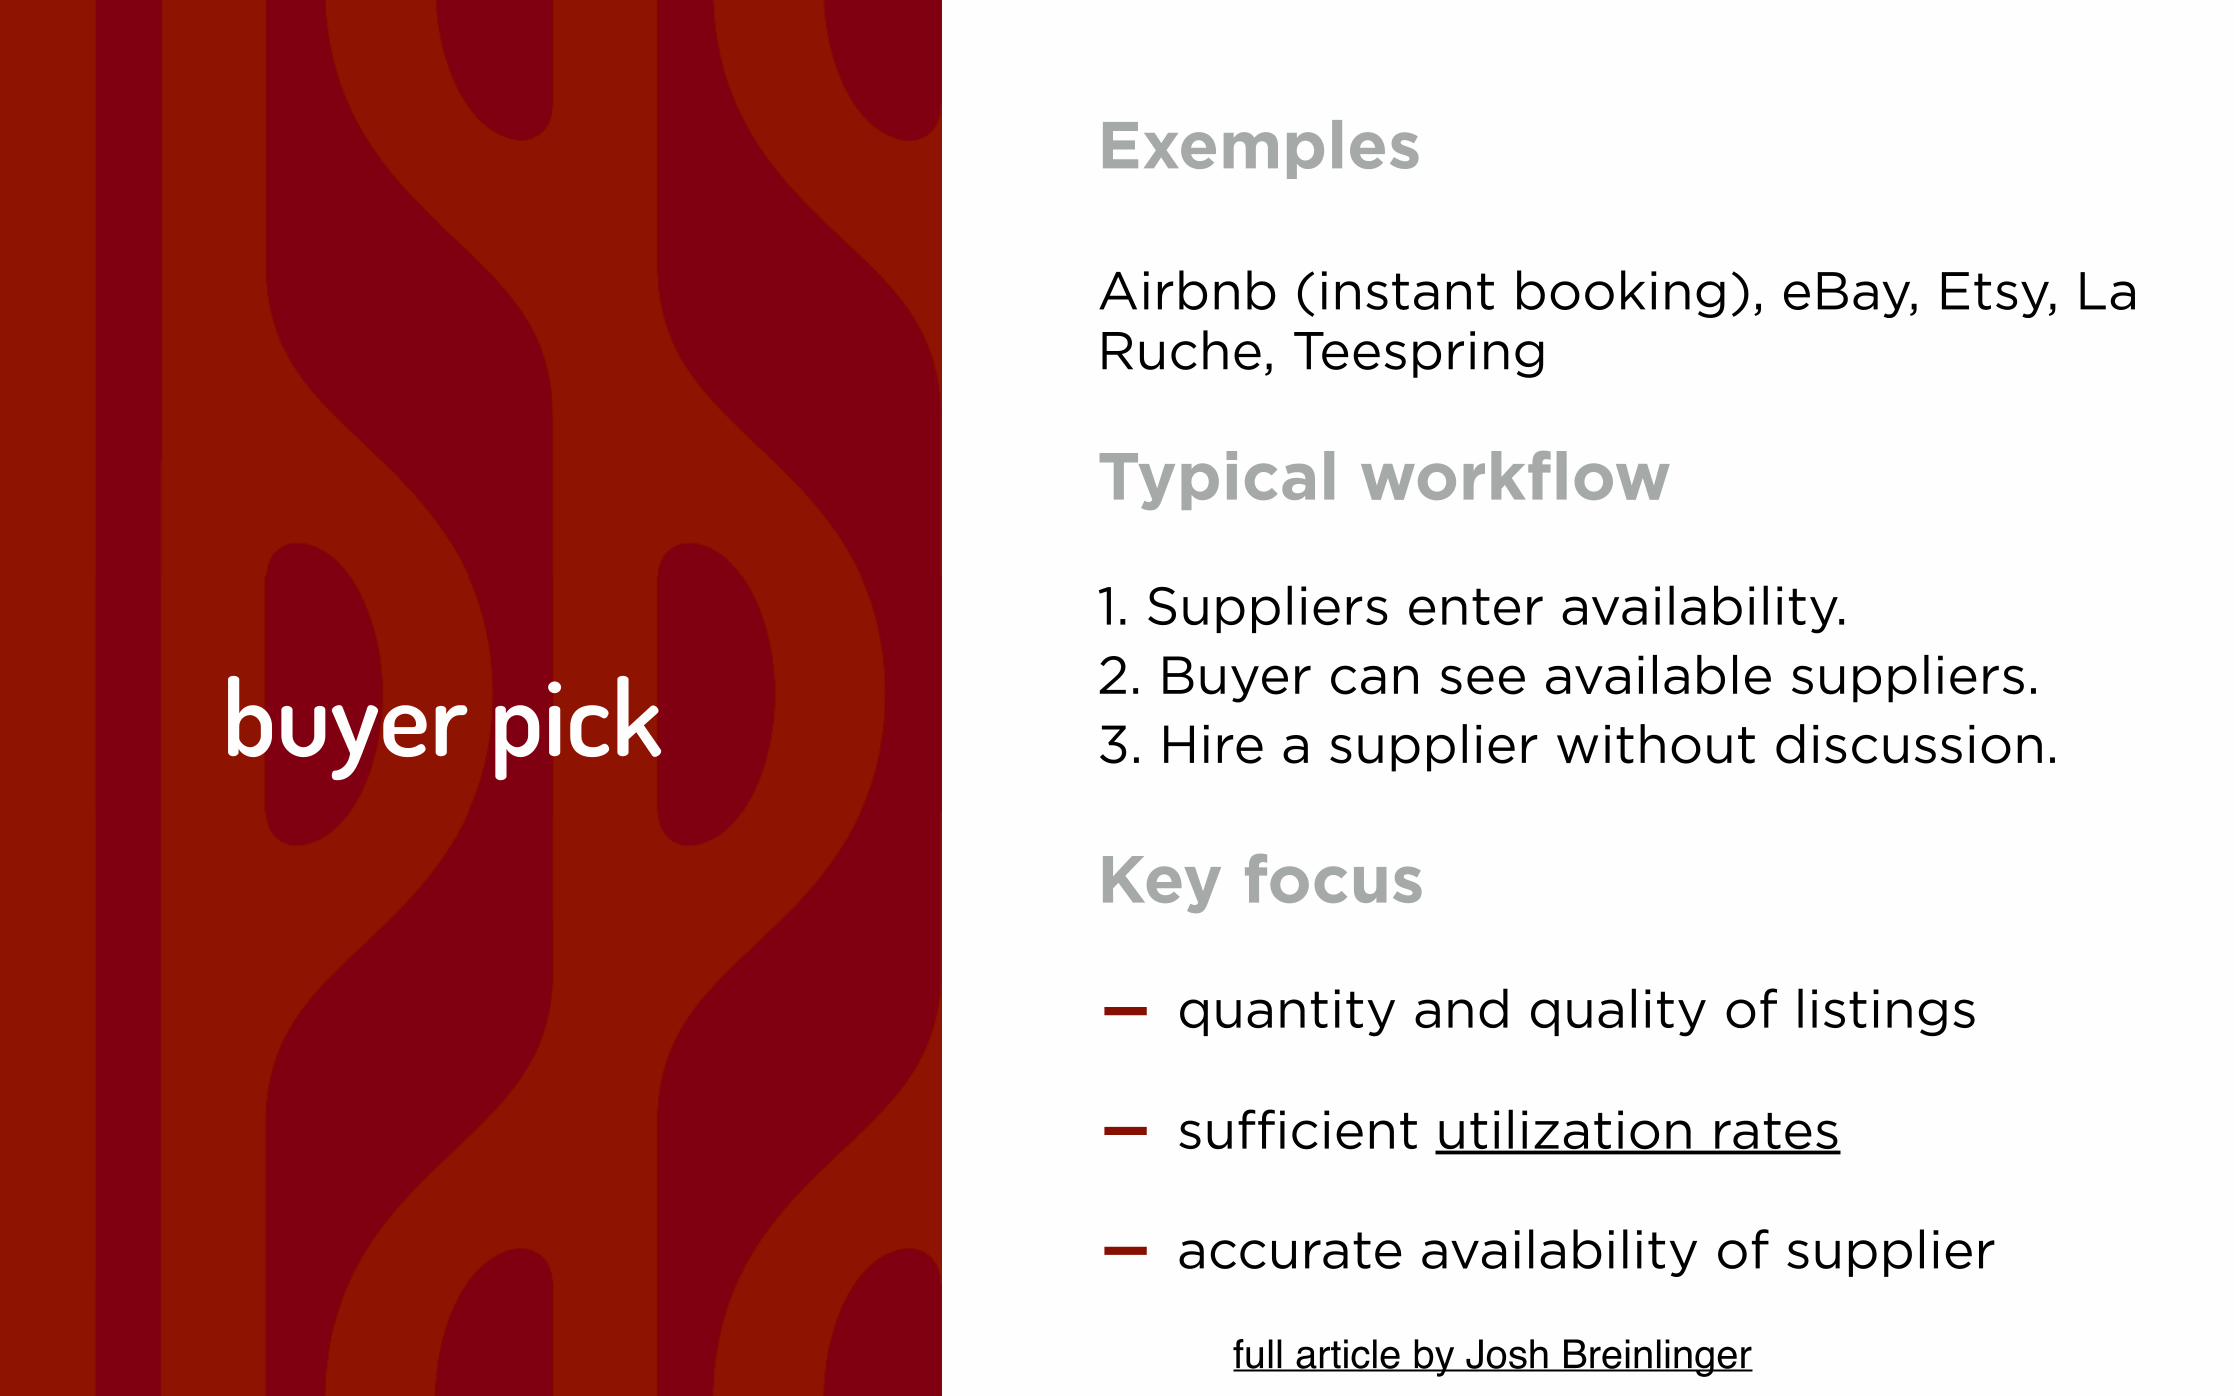
buyer pick
ExemplesAirbnb (instant booking), eBay, Etsy, La Ruche, Teespring
Typical workflow
1. Suppliers enter availability. 2. Buyer can see available suppliers.3. Hire a supplier without discussion.
Key focus
– quantity and quality of listings
– sufficient utilization rates
– accurate availability of supplier
full article by Josh Breinlinger
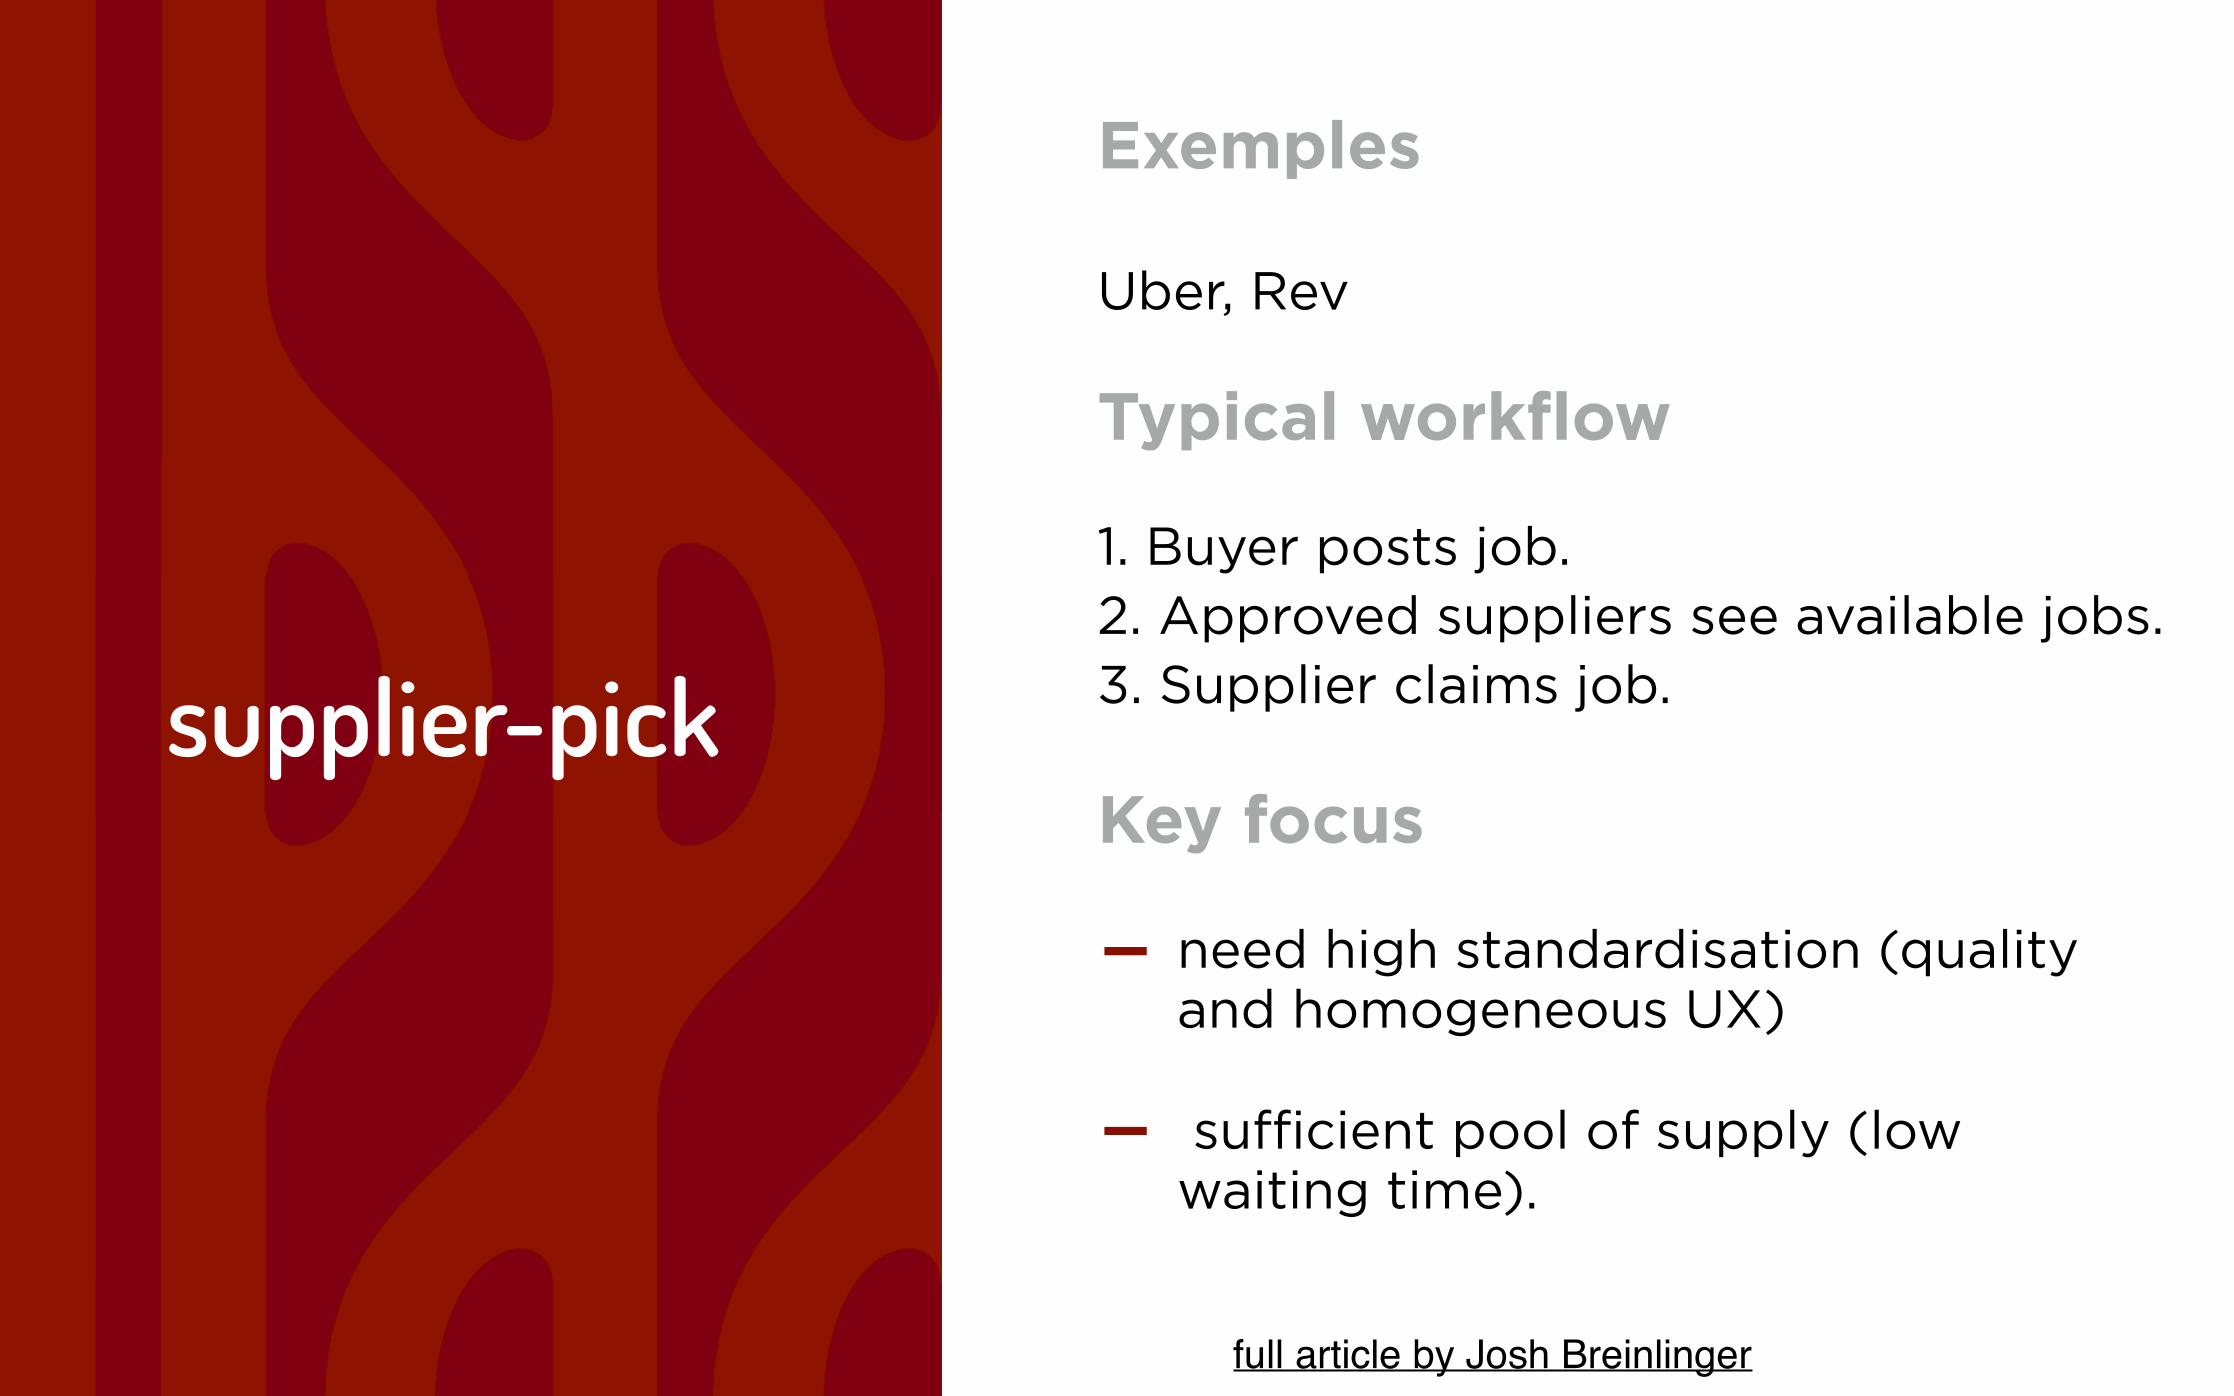
supplier-pick
ExemplesUber, Rev
Typical workflow
1. Buyer posts job. 2. Approved suppliers see available jobs. 3. Supplier claims job.
Key focus
– need high standardisation (quality and homogeneous UX)
– sufficient pool of supply (low waiting time).
full article by Josh Breinlinger
full article by Josh Breinlinger

1.3. Buyer perspective: the 5 questions framework

The 5 questions framework Read this great slideshare from Martin Mignot
–How Urgent? –How Frequent? –How Complex? –How Mobile-driven? –How Profitable?
1.4. Seller perspective: two important ratios

Fill ratio
Key question
– Does your platform represent a large amount of a worker total income?
Reason why
– Most of the time, the more people spend time doing something, the better they get (they know how to communicate, to structure, they have more materials/supports).
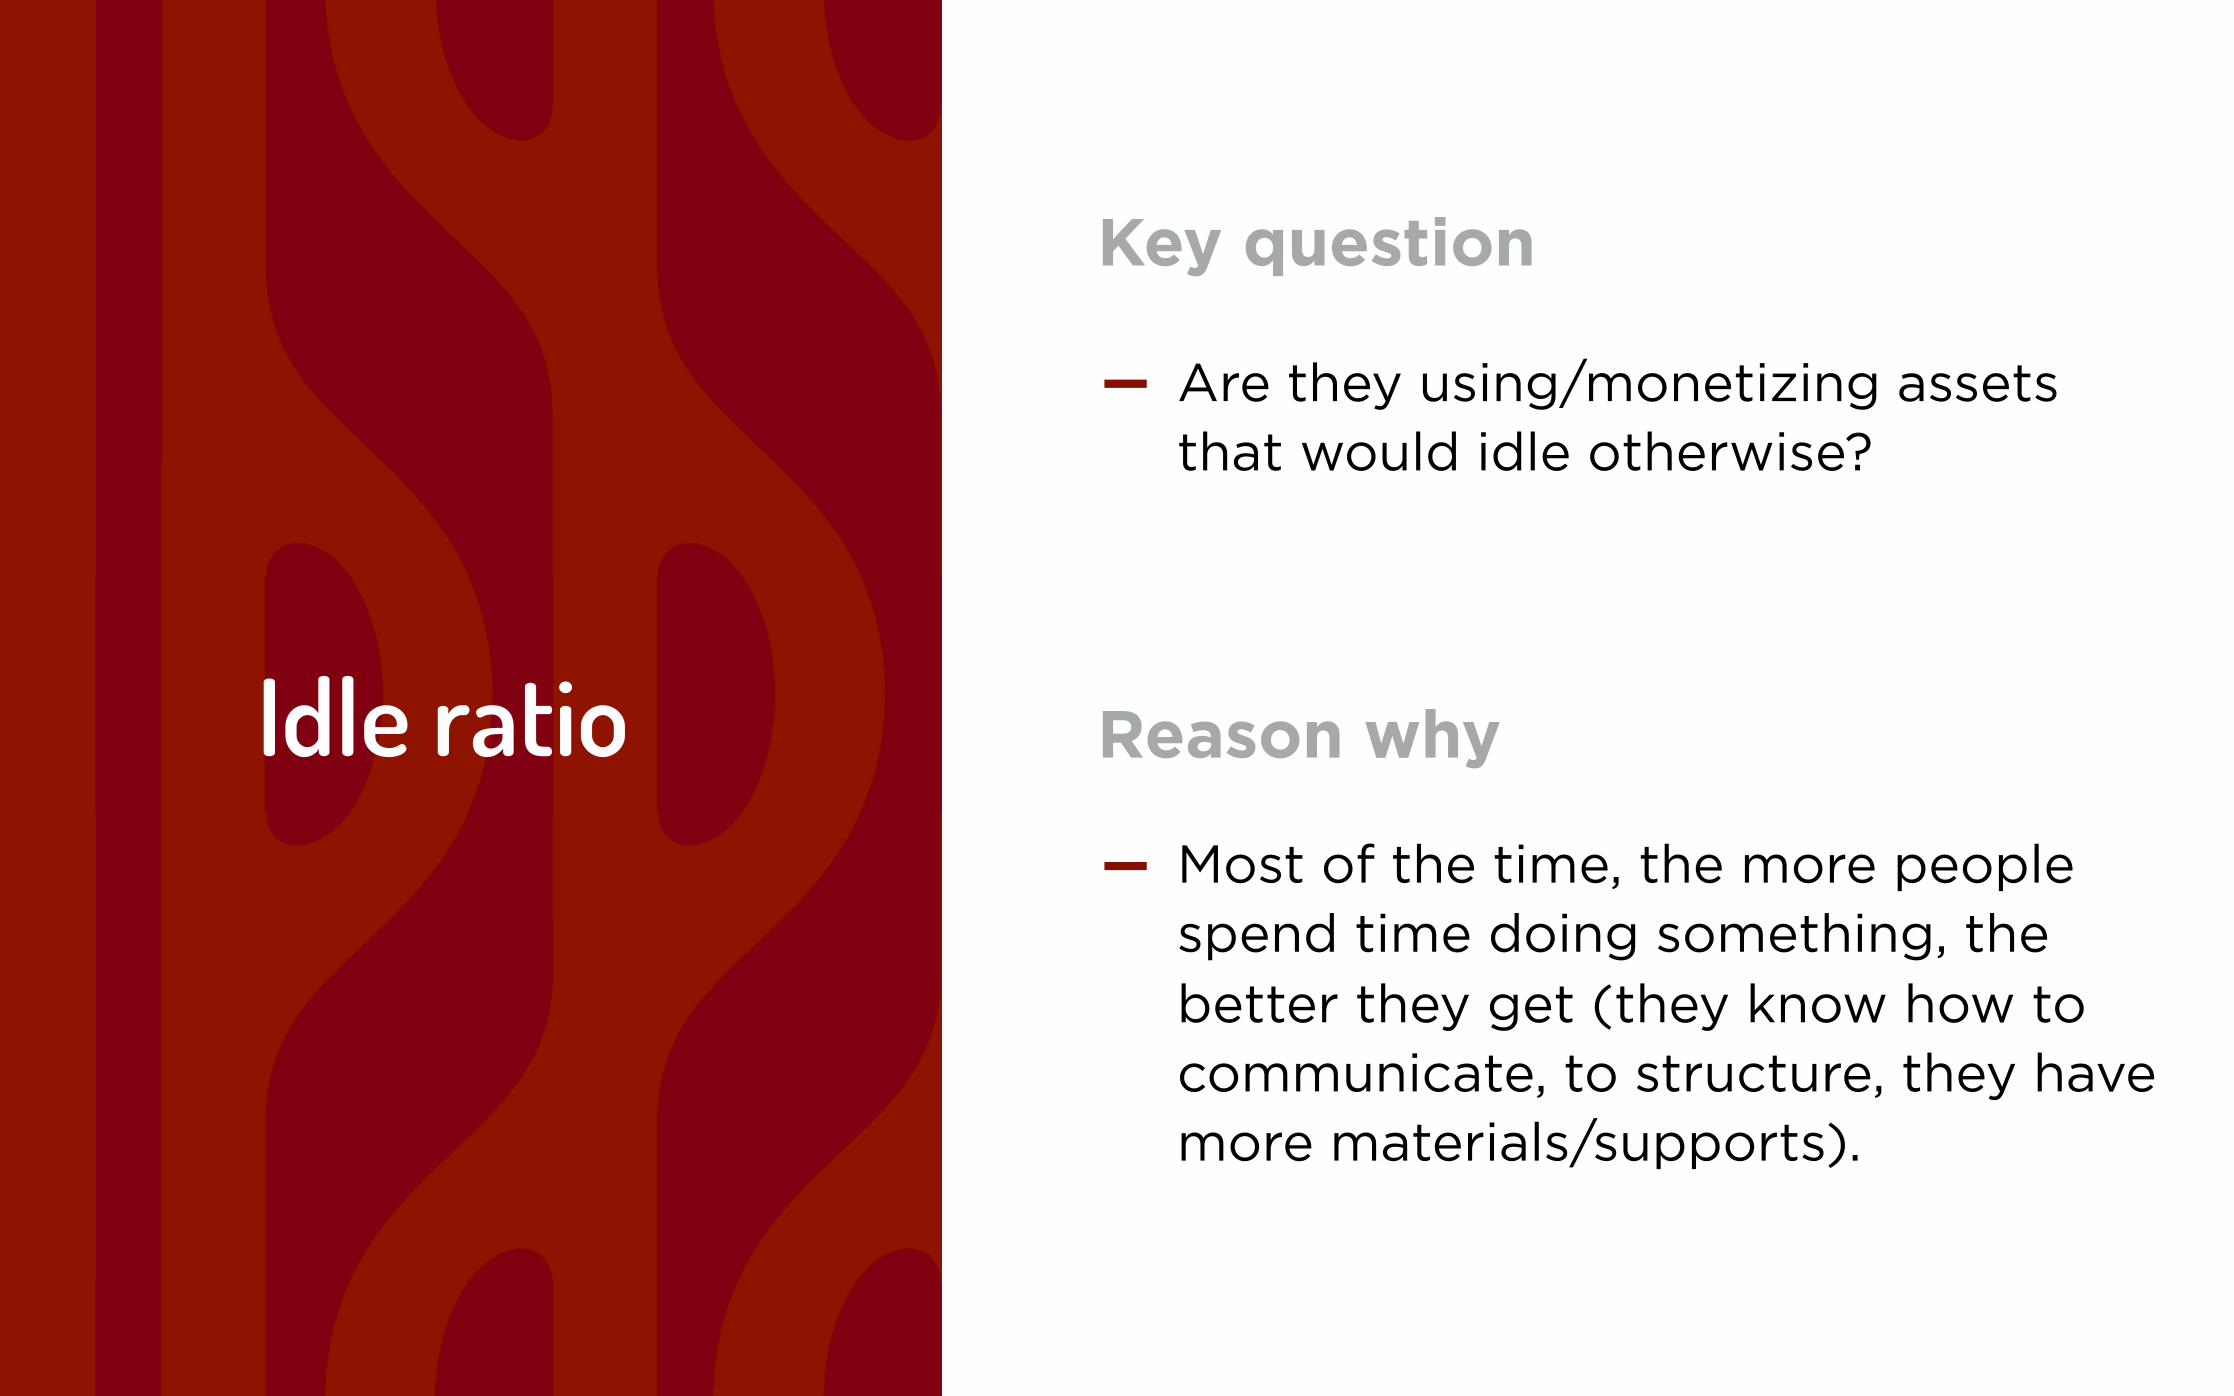
Idle ratio
Key question
– Are they using/monetizing assets that would idle otherwise?
Reason why
– Most of the time, the more people spend time doing something, the better they get (they know how to communicate, to structure, they have more materials/supports).

Marketplace KPIs#2

download this open-source dashboard!
first tab is the dashboard, second is a cohort analysis

Let’s now consider some of the most important KPIs of this dashboard.

Gross merchandise volume (GMV)
Definition
– GMV is the total sales dollar value for merchandise sold through the marketplace, it is sometimes called “Total Order Value“, “Total Dollars Processed” and “Gross Revenue”.
Reason Why
– GMV Growth is a good indicator of the overall growth of the marketplace.
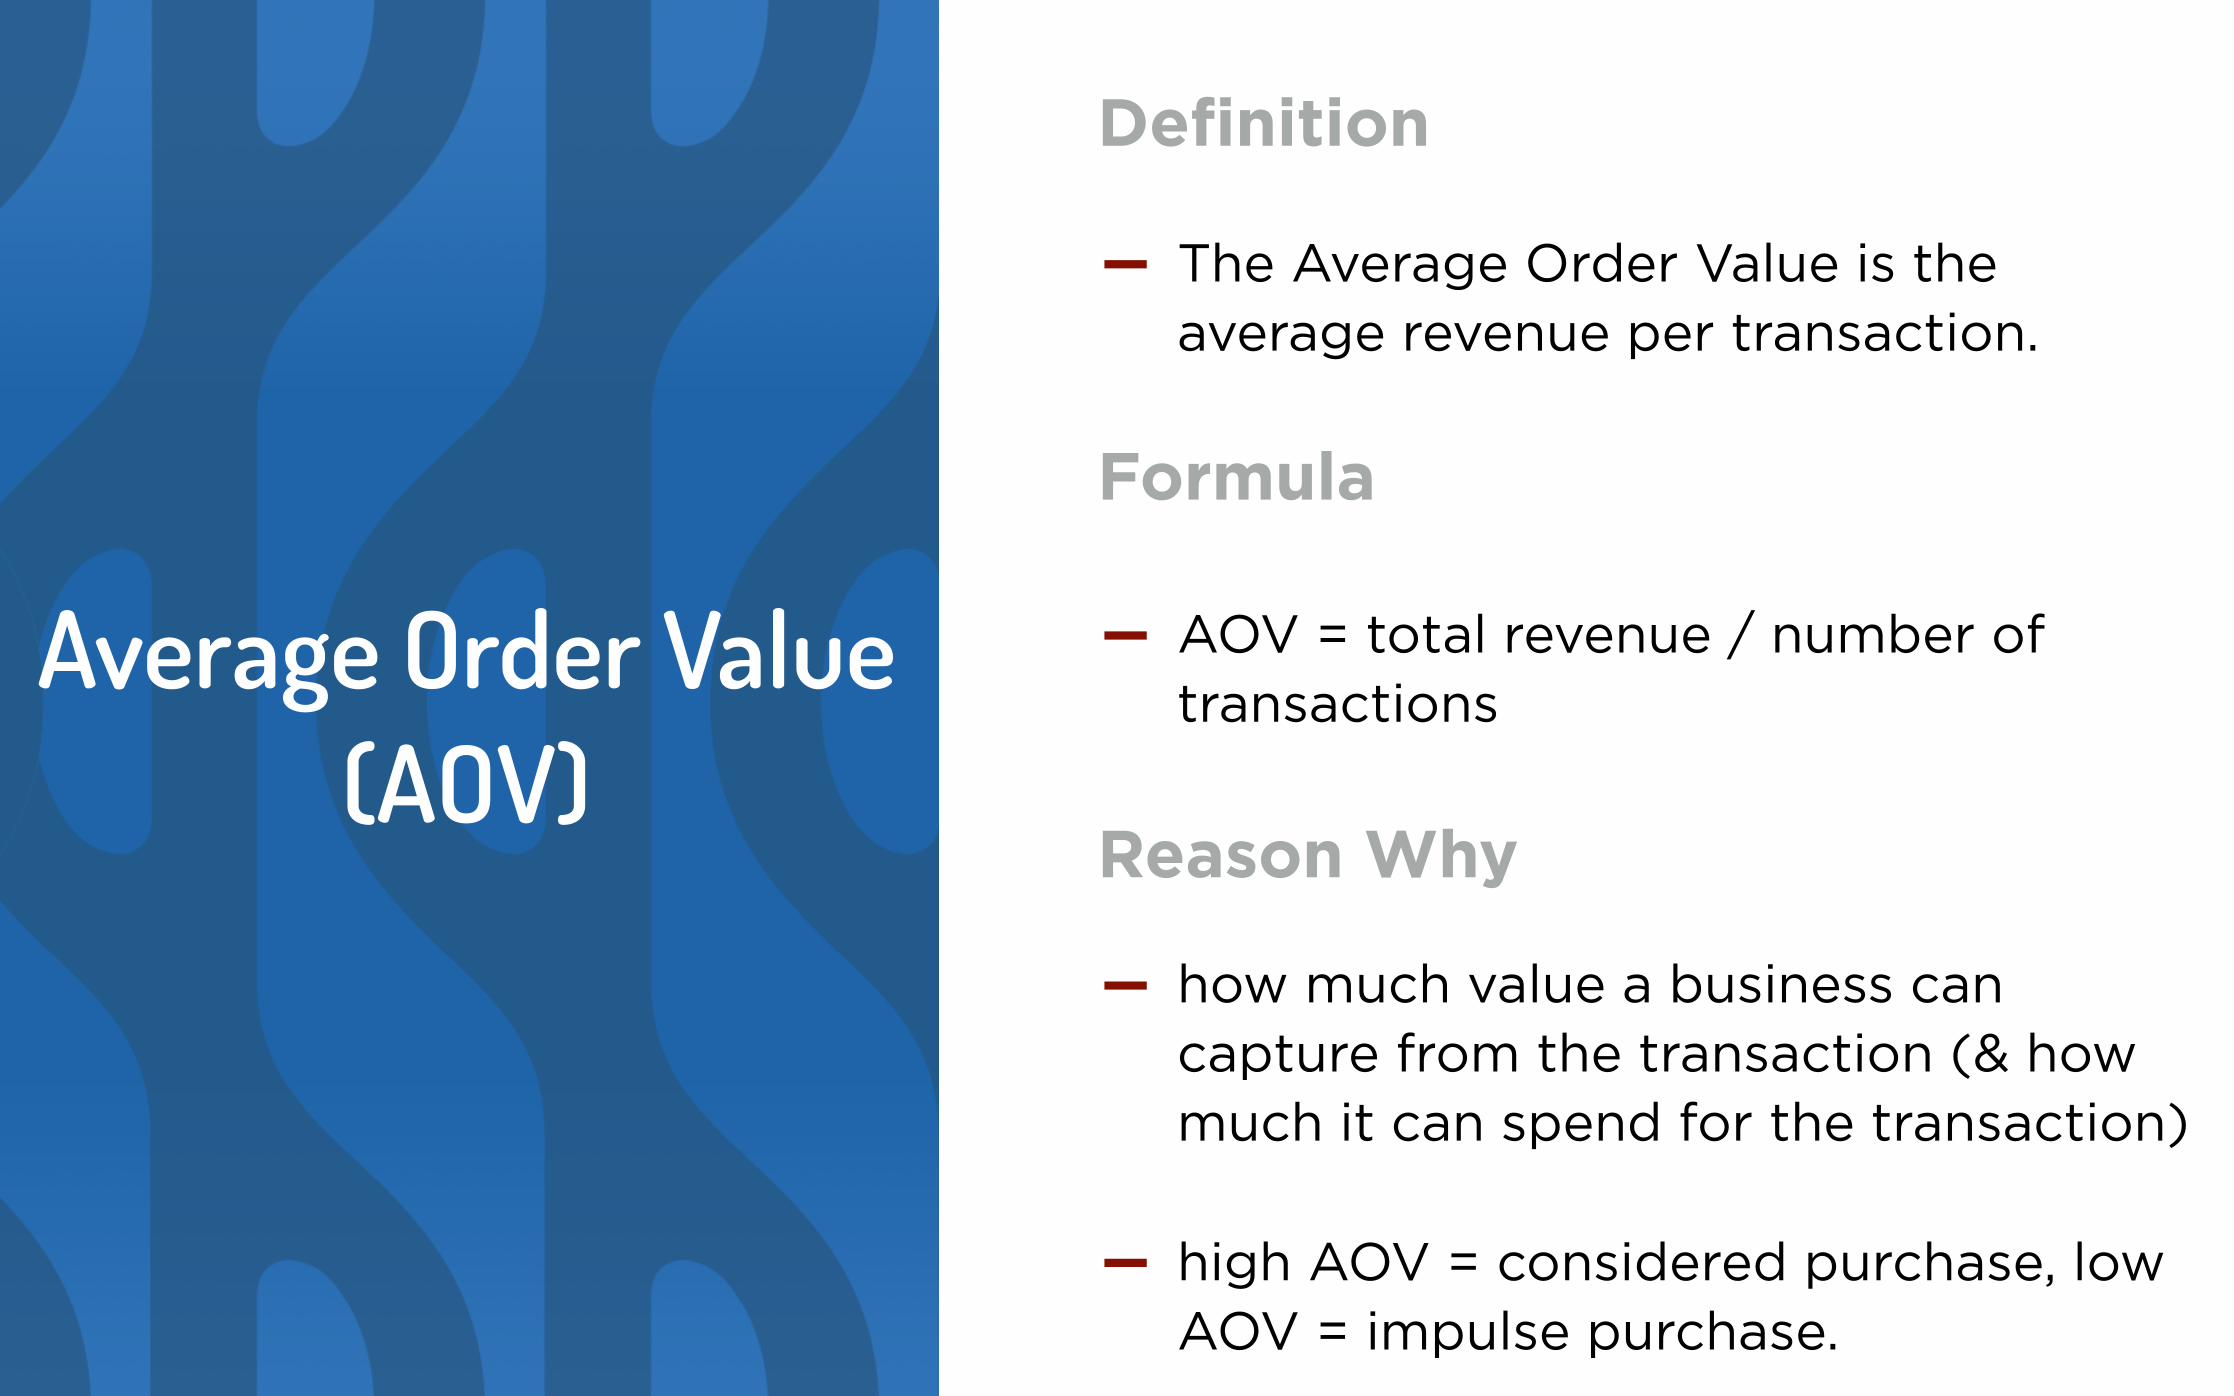
Average Order Value (AOV)
Definition
– The Average Order Value is the average revenue per transaction.
Formula
– AOV = total revenue / number of transactions
Reason Why
– how much value a business can capture from the transaction (& how much it can spend for the transaction)
– high AOV = considered purchase, low AOV = impulse purchase.
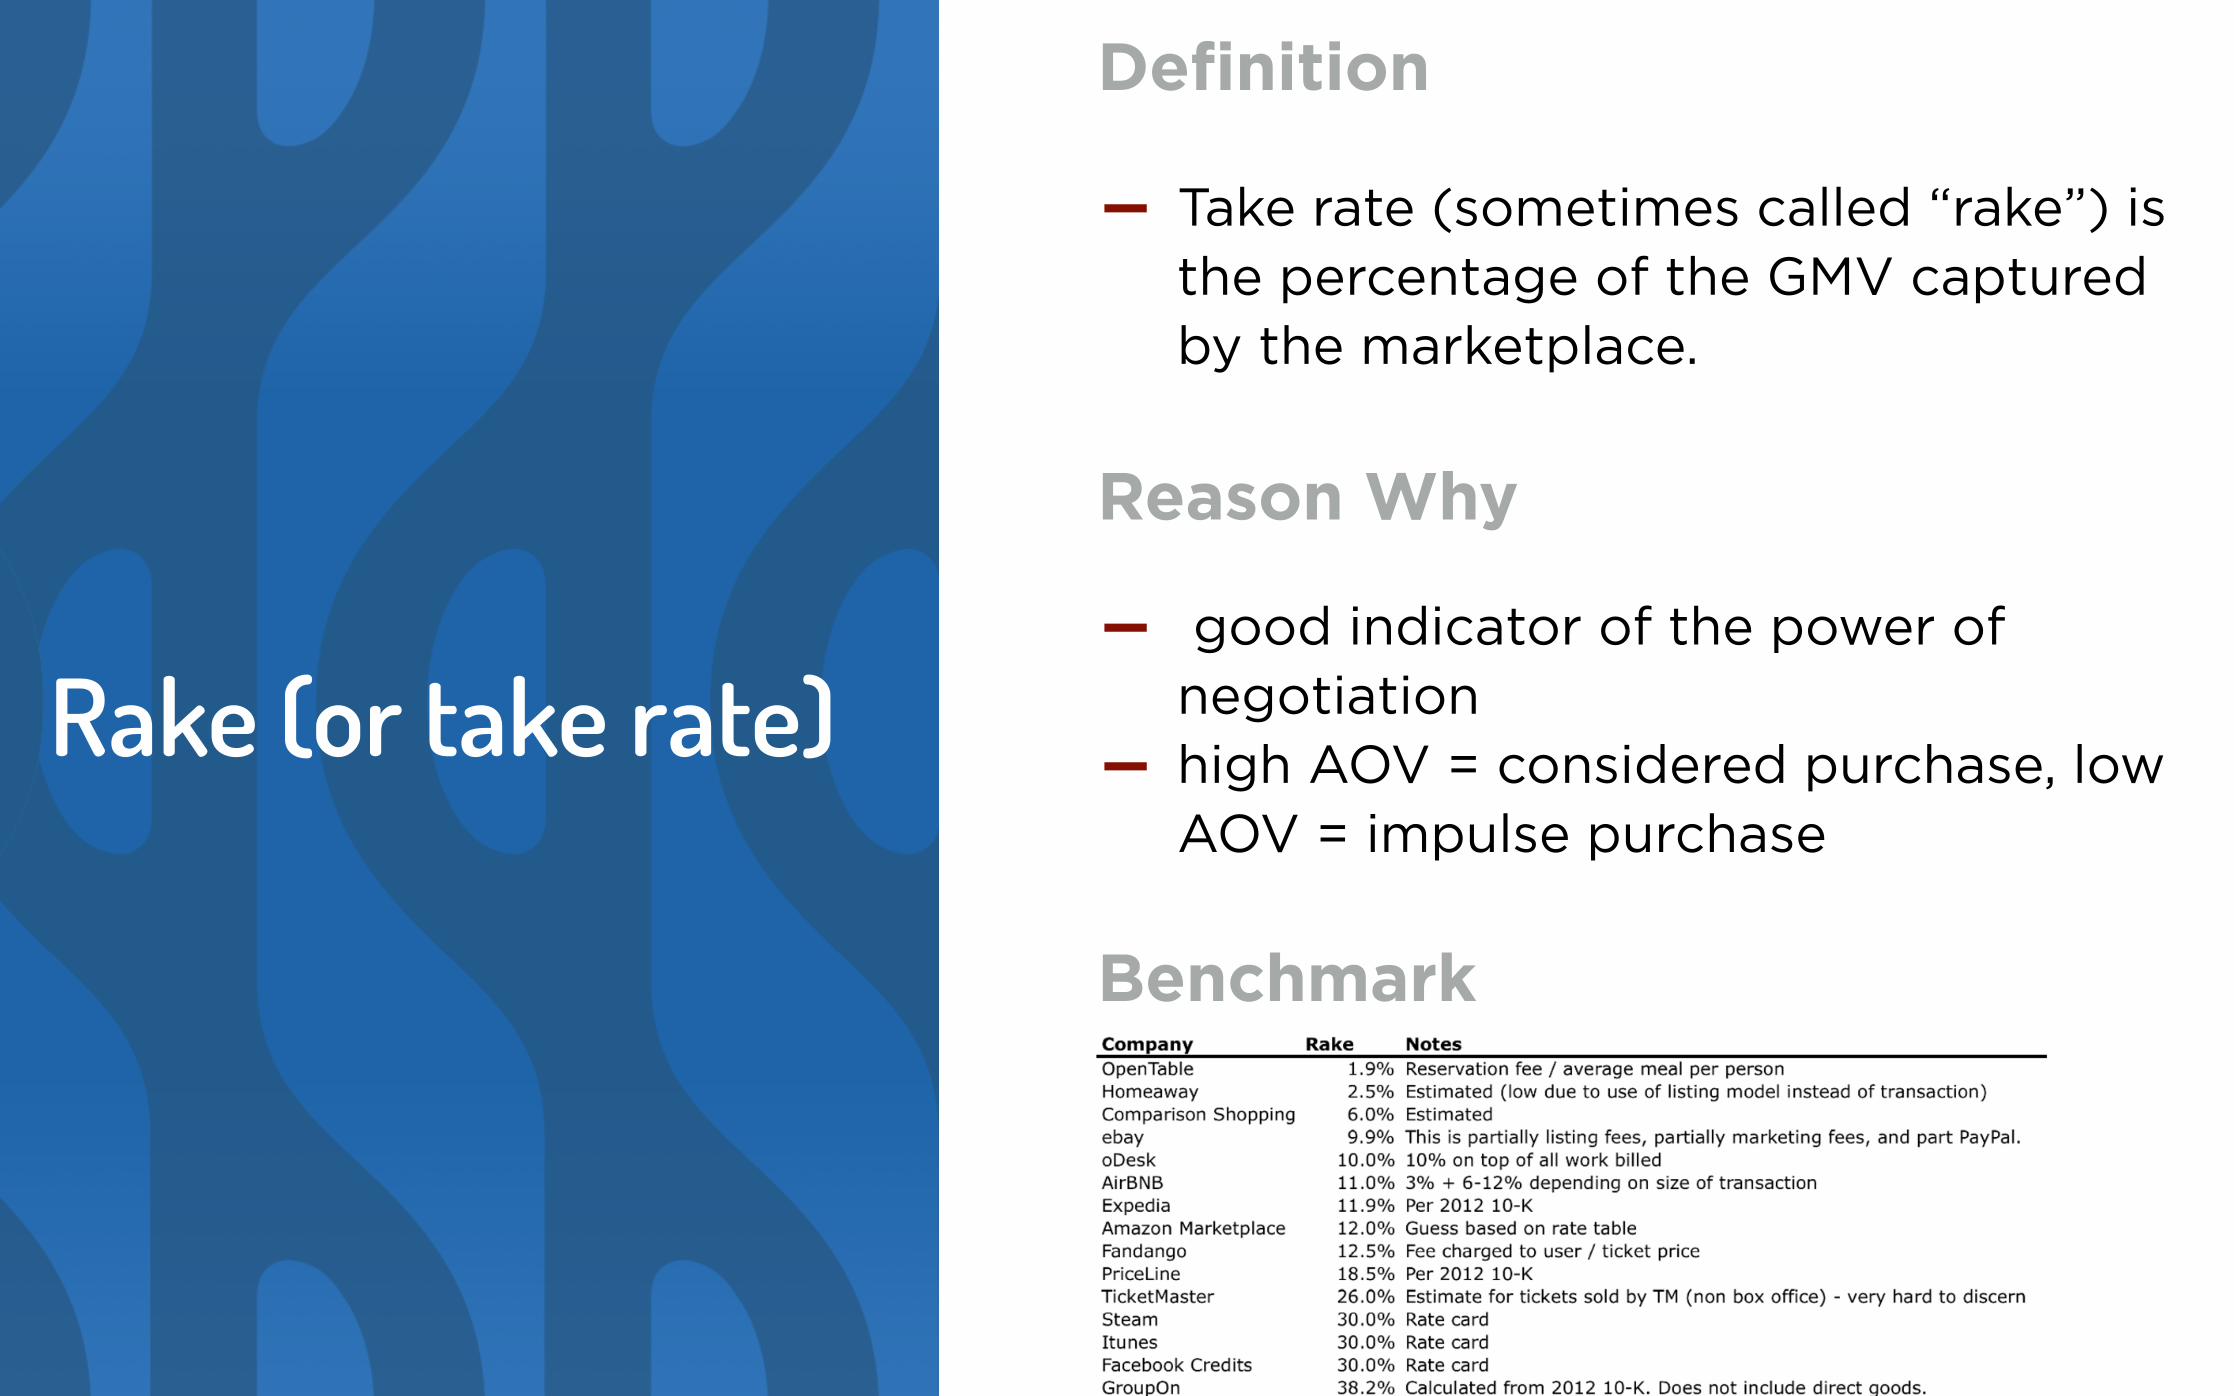
Rake (or take rate)
Definition
– Take rate (sometimes called “rake”) is the percentage of the GMV captured by the marketplace.
Reason Why
– good indicator of the power of negotiation
– high AOV = considered purchase, low AOV = impulse purchase
Benchmark

Buyer/Seller Overlap, Buyer-to-Seller ratio
and TPB/TPS
Definition
– Buyer/seller overlap is the number of sellers who are also buyers ; buyer-to-seller ratio is the number of buyers divided by the number of sellers
Reason Why
– often a good sign when the supply also buys stuff/services
– the more in-depth ratio Transactions Per Buyer/Transactions Per Sellers (TPB/TPS) is even more interesting
Benchmark
– AirBnb’s TPB/TPS = 1/70
– Uber TPB/TPS = 1/50
– eBay TPB/TPS = 1/5

Contribution Margin & Contribution Margin
Ratio
Definition
– Contribution margin is difference between the price paid and associated variable costs
Formula
– Contribution Margin = Sales — Variable Costs*
– Contribution Margin Ratio = Total contribution margin / Total sales
Reason Why
– the contribution margin ratio is the percentage of revenues that remains after all variable costs have been covered.
with variable costs = cost of goods sold (COGS) + human cost if the transaction is a service + sales commissions +
payment processing + delivery price

Quick ratio
Definition
– A quick ratio is a metric that measure if growth outpaces churn.
Formula
– Quick ratio = (new users + resurrected users) / churned users
Reason Why
– a ratio above 1 means that the marketplace is growing (new+resurrected > churn), otherwise you would be losing users (churn > growth).
more about quick ratio

Net Promoter Score
Definition
– Net Promoter Score (NPS) is a management tool to measure customer satisfaction.
Formula
– The score is obtained asking the following question: “How likely is it that you would recommend [brand] to a friend or colleague?”
– NPS = Promoters [score 9 or 10] - Detractors [score 0 to 6]
Benchmark
– An NPS that is positive (i.e., higher than zero) is felt to be good, and an NPS of +50 is excellent.

Read the full article & get our newsletter!

about daphini & the author
@willybraun, co-founder of daphni
special thanks to my parter @mathieudaix, for his feedbacks & inputs
follow us! (twitter, facebook, newsletter)


![The Marketing Manager’s Ultimate Cheat Sheet for …abeedle.com/UltimateCheatSheet-Analytics[PDF-GUIDE].pdf · The Marketing Manager’s Ultimate Cheat Sheet for Google Analytics](https://img.dokumen.tips/doc/110x75/5b8871067f8b9aaf728db567/the-marketing-managers-ultimate-cheat-sheet-for-pdf-guidepdf-the-marketing.jpg)