Embed Size (px)
Citation preview

PARKING SPACE DETECT
_Amanullah Tariq, Muazzam Ali and Deep Ganatra

Content
TASK 1 : Parking area detection in 2D Image• KEY IDEA : Detect patterns in Parking area.• Results
TASK 2 : 2D – 3D Registration• KEY IDEA : Register known correspondence points• Ground plane detection and filtering
TASK 3 : Segmentation of objects and 2D-3D Mapping• Step 1 : Object Detection• Step 2 : Applying Supervised Learning• Step 3 : Combining 2D – 3D data

TASK 1: Parking area detection in 2D Image
• Detect parking area features in images (e.g., lines, corners, patterns…)
• Generate a map of parking spaces.

Applying Bilateral
Original Image

Applying Bilateral
Bilateral Image

• Converting Image to Grey for easy processing

Detecting Line Segments
Algorithm : Line Segment Detect (OpenCV 3.0).

Categorising Lines on basis of Slopes
𝑆𝑙𝑜𝑝𝑒 (𝑚)=𝑦 2− 𝑦 1𝑥 2−𝑥 1
𝐴𝑛𝑔𝑙𝑒()=𝑎𝑟𝑐𝑡𝑎𝑛 (𝑚 )

Working with Lines at same slope

Categorize lines at same slope, by length and threshold
Maxlinelength = length of most occurring lines (l)

Calculating distance between mid-points of the lines
𝑀𝑖𝑑𝑝𝑜𝑖𝑛𝑡 (𝑥 3 , 𝑦 3)=((𝑥 2+𝑥1)2, (𝑦 2+ 𝑦1)
2 )
𝐸𝑢𝑐𝑙𝑖𝑑𝑖𝑒𝑛𝑑𝑖𝑠𝑡𝑎𝑛𝑐𝑒 ,𝑑=√(𝑥 6−𝑥3)2+(𝑦6− 𝑦 3)2

Checking Aspect ratio
Aspect ratio =
0.4 < Aspect ratio for rectangle < 0.7

Calculating perpendicular distance between lines
𝑦 1=𝑚∗𝑥1+𝑏1𝑦 2=𝑚∗𝑥2+𝑏2
𝑏2=𝑦 2−𝑚∗𝑥2𝑏1=𝑦 1−𝑚∗𝑥1
𝑑𝑝𝑒𝑟=|𝑏2−𝑏1|√𝑚2+1

Getting rectangle corner points
(𝑥 4 , 𝑦 4 )=(𝑥3 , 𝑦 3 )+ 𝑑𝑝𝑒𝑟√(𝑦 1−𝑦 2)2+(𝑥 2−𝑥 1)2
∗(( y 1− y 2) ,(x2− x1))
Desired points

Rectangle plotted results

TASK 2: 2D – 3D Registration

TASK 2: 2D – 3D Registration
• Manually detect the Correspondence points.
• Compute a transformation of the 2D image and the 3D point cloud.

3D PCD with Intensity of parking space

Normalizing & Thresholding the Intensity values
• Normalizing Intensities of each point (0 to 1)
• = Maximum Intensity value in Point Cloud Data
• = 0.5

New Intensity value
𝑁𝑒𝑤𝑃𝑜𝑖𝑛𝑡 𝐼𝑛𝑡𝑒𝑛𝑠𝑖𝑡𝑦=𝑀𝑎𝑥∗(𝑂𝑙𝑑𝐼𝑛𝑡𝑒𝑛𝑠𝑖𝑡𝑦< h h𝑇 𝑟𝑒𝑠 𝑜𝑙𝑑)𝑁𝑒𝑤𝑃𝑜𝑖𝑛𝑡𝐼𝑛𝑡𝑒𝑛𝑠𝑖𝑡𝑦=0∗(𝑂𝑙𝑑 𝐼𝑛𝑡𝑒𝑛𝑠𝑖𝑡𝑦> h h𝑇 𝑟𝑒𝑠 𝑜𝑙𝑑)

2D image and Point Cloud

KEY IDEA : Register known correspondance points

Correspondence points

Transformation using Umeyama1 Algorithm
• Least square estimation of the transformation parameters.
• Single Value Decomposition of covariance matrix.
1 - S. Umeyama - Least-Squares Estimation of Transformation Parameters Between Two Point Patterns, Pattern Analysis and Machine Intelligence, 1991


Ground plane detection and filtering

RANSAC – Random Sample Consensus
• Algorithm for robust model fitting
• Select sample Set – Point Cloud Data
• Computes Model - SACMODEL_PLANE
• Computes inliers – Points in Plane
• Repeats until sufficient confident.

SACMODEL_PLANE 1
The four coefficients of the plane are its Hessian Normal form: [normal_x, normal_y, normal_z, d]
1 -http://docs.pointclouds.org/1.7.0/group__sample__consensus.html

Filtering out the plane using EXTRACT INDICES
Plane detectedPoint cloud with Extract indices

Task 3: Car Detection

Task 3: Car Detection (Required)
• Registration from previous task provides a segmentation of cars.
• Use these point clouds as training examples to compute car features.
• Implement a car detector.• Map Improvement.

Task 3: Car Detection (Solution)
Object Detection
• Clustering Methods
• Identifying Threshold Values
Applying Supervised Learning
• Logistic Regression
Combining 2D and 3D data
• Matching • Drawing
Reference:• Logistics Regression

Step 1: Object Detection

Step 1: Object Detection
Clustering Methods
• Euclidean Cluster Extraction• Region Growing Segmentation
Identifying Threshold
• Manual feature(s) detection
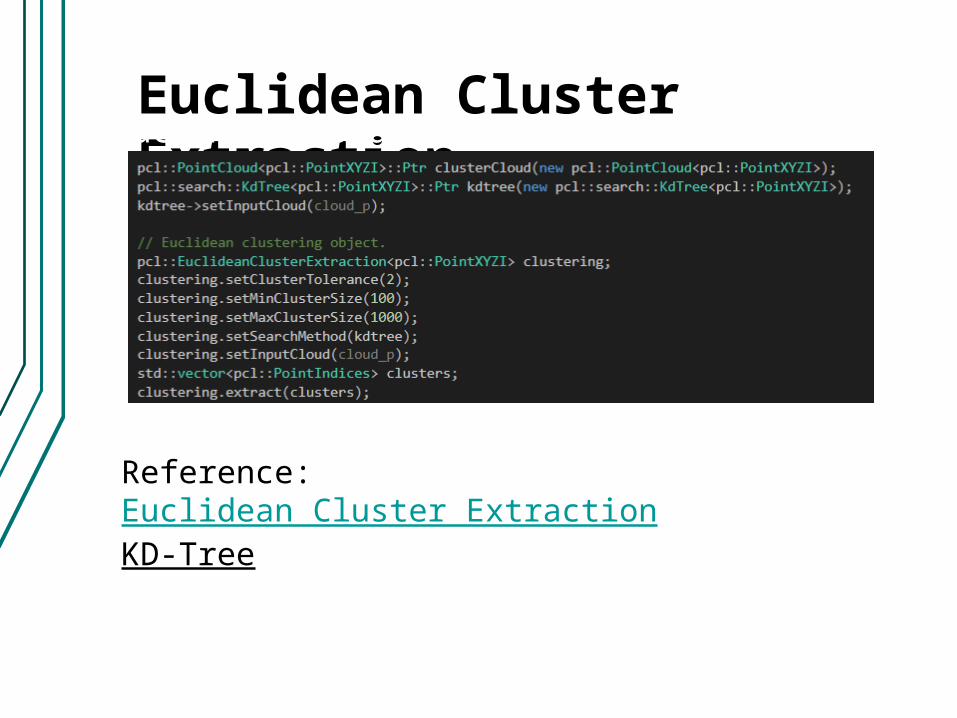
Euclidean Cluster Extraction
Reference:Euclidean Cluster ExtractionKD-Tree
Euclidean Cluster Extraction

Euclidean Cluster Extraction (Continue)
Reference:Euclidean Cluster ExtractionKD-Tree
Euclidean Custer Extraction
Blue objects are identified clusters

Region Growing Segmentation• This algorithm merge the points that are close enough in
terms of the smoothness constraint. Thereby, the output of this algorithm is the set of clusters, were each cluster is a set of points that are considered to be a part of the same smooth surface. The work of this algorithm is based on the comparison of the angles between the points normal.
• Takes more time than Euclidean Cluster Extraction.
Reference:Region Growing Segmentation

Region Growing Segmentation (Continue)

Region Growing Segmentation (Continue)
Reference:Region Growing Segmentation
Blue objects are identified clusters

Comparison: Euclidean VS Region Growing
Euclidean Region Growing
• For our rest of the program we used Region Growing.

Identifying Threshold Values (Manually)
• Manually visualize all the clusters and saved them in a Excel sheet.•Attributes saved where
1. Length ( y – value)2. Height ( z – value)3. Width ( x – value)4. Type ( Car / Not Car)
• Result Microsoft Excel Worksheet

Problem(s)• Can we used the manually identified thresholds?
1. Hard coded values can lead to big errors.2. What if truck comes and what if small car comes.3. If we have to hard code the threshold values then why we are
writing so much code?
• How to solve this problem?• Supervised Learning.
• Which supervised algorithm to use ?• Small feature list.• Only need to classify objects as Cars and Not Cars (binary)• SVM, Linear , logistic regression etc.
Reference:• Liblinear

Step 2: Applying Supervised Learning

Step 2: Applying Supervised Learning
Process
• Training• Prediction
Results
• Output• Accuracy

Process (Training & Prediction)
Feature List as text file Model File/ learned function
.
Training
.
PredictorModel File
Output (Classifying Clusters)
Map
Clusters

Process (continue)
• Training • We use following solver or methods
1. L1-regularized logistic regression2. L2-regularized L2-loss support vector classification (dual)
• Prediction1. Model 2. Output3. Input
Reference:• Liblinear
train_rg.model
input.txt
output.out

Results

Accuracy
• L1-regularized logistic regression• L2-regularized L2-loss support
vector classification (dual)

Step 3: Combining 2D and 3D

What we will do next ?
Parking spots identified from 2D
Image
Occupied Parking slots
identified from PCD file
Final Map(Parking and
Vacant Spaces)

Step 3: Combining 2D and 3D
Matching• Possibilities of 2D and 3D data.
Drawing
• Identifying Occupied Parking slots with the help of 3D data.
• Drawing final map.

Possibilities of the data:
Matching

Matching (continue)

Drawing

Map Improvement

Map Improvement• How can we improved the generated map ?
• How can we plot the remaining data or Cars, predicted by our Linear classifier?• Identify minimum and maximum point of each clusters and draw the
rectangles:
Good Choice?

Map Improvement (Continue)

Danke Schön